Subaru narrow-band imaging search for Lyman continuum from galaxies at in the GOODS-N field ††thanks: Based on data collected at Subaru Telescope, which is operated by the National Astronomical Observatory of Japan. Proposal IDs: S11A-016, S15A-019, S18A-042.
Abstract
We report results of a search for galaxies at with Lyman continuum (LyC) emission using a narrow-band filter NB359 with Subaru / Suprime-Cam in a 800 arcmin2 blank field around the GOODS-N. We use 103 star-forming galaxies (SFGs) and 8 AGNs with spectroscopic redshifts in a range between 3.06 and 3.5, and 157 photometrically selected Lyman emitter (LAE) candidates as the targets. After removing galaxies spectroscopically confirmed to be contaminated by foreground sources, we found two SFGs and one AGN as candidate LyC emitting sources among the targets with spectroscopic redshifts. Among LAE candidates, five sources are detected in the NB359 image, and three among them may be contaminated by foreground sources. We compare the sample galaxies in the GOODS-N with those in the SSA22, where a prominent protocluster at is known and the LyC search using the same NB359 filter has been made. Frequency of galaxies with LyC leakage in the SSA22 field may be about two times higher than the galaxies in the GOODS-N with the sample UV magnitude range, although the numbers of LyC detections in these fields are too small to make a statistically significant conclusion. By combining the sample galaxies in these fields, we place the 3 upper limits of the observed LyC-to-UV flux density ratio and LyC escape fraction for galaxies at with absolute UV magnitude as () and %, respectively.
keywords:
galaxies: evolution – galaxies:high-redshift – intergalactic medium – cosmology: observations.1 Introduction
A significant portion of photons from young massive stars has wavelengths shorter than the hydrogen Lyman limit (912Å) and they can ionize neutral hydrogen. While some of the ionizing photons emitted from star-forming regions in a galaxy would be absorbed by dust and interstellar Hi gas, some other ionizing photons may escape into the intergalactic medium (IGM). The escape fraction of Lyman continuum (LyC), , is the fraction of ionizing photons which leak into the IGM among those produced. Star-forming galaxies are thought to be primary sources of LyC which have caused cosmic reionization at (e.g., Stiavelli et al., 2004; Oesch et al., 2009), and is one of the most important parameters necessary to understand the process of cosmic reionization. However, since LyC is easily absorbed by the intervening Hi gas, the direct measurement of LyC from galaxies at is practically impossible due to high opacity of the IGM. On the other hand, there is still a significant probability of fairly transparent lines of sight towards galaxies at (Inoue & Iwata, 2008), and we have chances to explore the LyC escape from galaxies in the young Universe.
Although any detection of LyC from faint high-z galaxies is observationally challenging, significant observational efforts on direct detections of LyC radiation from distant galaxies have been made. There are several spectroscopic detections of LyC for individual galaxies at so far (Vanzella et al., 2010b, 2015; Shapley et al., 2016; Vanzella et al., 2018) and a recent report of a systematic spectroscopic survey of LyC from 124 Lyman Break Galaxies (LBGs) by Steidel et al. (2018) at includes 15 individual LyC detections. Steidel et al. (2018) also measured the ratio of observed ionizing to non-ionizing UV flux density with composite spectra, and with correction for the IGM and circum-galactic medium (CGM) via a Monte Carlo analysis. Through population synthesis modelling of the intrinsic spectrum of the observed composite spectra, they constrained the intrinsic for their sample galaxies. the averaged value of for the 124 galaxies with is . Marchi et al. (2018) used a set of 201 rest-frame UV spectra of the galaxies from VUDS (Le Fèvre et al., 2015) at to examine their LyC escape fraction. They constructed subsamples based on Ly equivalent widths (EWs), Ly velocity offsets from systemic redshift, spatial extents in Ly emission and rest-frame UV continuum, and stacked their spectra to constrain LyC/UV flux density ratios. They found that subsamples with large Ly EW and those with smaller spatial extents either in Ly or in rest-frame UV have higher relative LyC flux compared to the other galaxies in their sample, and suggested that these properties would be good indicators of galaxies with strong LyC emission.
An alternative approach to constrain LyC leakage from galaxies is to use photometry using a filter with bandpass free from non-ionizing photons. Because absorption by neutral hydrogen in the CGM and IGM is expected to be smaller for a wavelength range just below the Lyman limit compared to that in shorter wavelengths, use of imaging with a narrow-band filter tracing such a wavelength range for a target redshift could be an efficient way to search for LyC emitting galaxies in a field. This narrow-band approach has been employed by several past researches (Inoue et al., 2005; Iwata et al., 2009; Nestor et al., 2011; Mostardi et al., 2013; Micheva et al., 2017b), and these studies reported detections of a significant number of candidates of LyC emitting galaxies. However, the use of imaging data for LyC search runs the risk of misidentifying foreground sources as LyC emitters due to chance overlap. Indeed, follow-up spectroscopic observations of photometrically selected candidates of LyC emitting galaxies have revealed that many of them were actually contaminated by foreground sources (Vanzella et al., 2010a; Nestor et al., 2013; Siana et al., 2015) and indicates that a detailed inspection of their morphologies, as well as follow-up spectroscopic observations are necessary to identify genuine LyC emitting galaxies.
These previous studies have shown that the frequency of galaxies with strong LyC emission among high-redshift star-forming galaxies (SFGs) is relatively small; it is 5% to 10% (e.g., Micheva et al., 2017b; Nestor et al., 2013; Steidel et al., 2018) for both rest-frame UV colour-based LBGs and narrow-band selected Lyman emitters (LAEs), although the sensitivity limits vary for different studies. Also, the constraints on the intrinsic by these studies have indicated that the average is generally less than 10%, while recent studies have found that there are individual SFGs with strong LyC emission (Naidu et al., 2017; Fletcher et al., 2018; Steidel et al., 2018). On the other hand, arguments based on the UV luminosity function of rest-frame UV-selected SFGs at suggest that 10–20% would be required for SFGs to provide a sufficient amount of ionizing photons for cosmic reionization (e.g., Oesch et al., 2009; Bouwens et al., 2016). Low (less than 2%) is also suggested by independent analyses using GRB afterglows (Chen et al., 2007; Fynbo et al., 2009; Tanvir et al., 2018). While contributions to the ionizing photon budget from AGNs are also necessary to be evaluated more closely (Giallongo et al., 2015; Micheva et al., 2017a; Grazian et al., 2018), studies of LyC emission from SFGs, especially from UV-faint galaxies, are necessary to understand their contributions to the ionizing radiation.
Following the LyC search using Subaru / Suprime-Cam narrow-band imaging in the SSA22 field (Iwata et al., 2009; Micheva et al., 2017b), in this paper we report the results of a search for galaxies with LyC emission in the GOODS-N field. The GOODS-N field is one of the sky areas which have been extensively studied, with multi-wavelength data from X-ray to radio, and with various deep spectroscopic observations (e.g., Wirth et al., 2004; Barger et al., 2008; Reddy et al., 2006; Kriek et al., 2015) providing a large number of sample galaxies at where the Suprime-Cam NB359 filter traces rest-frame ionizing radiation. The available deep multi-band imaging data from the Hubble Space Telescope (HST) from UV to near-infrared in this field (Giavalisco et al., 2004; Grogin et al., 2011; Koekemoer et al., 2011; Oesch et al., 2018) are valuable to check the association of detected signal in the Suprime-Cam narrow-band image with the galaxies in order to verify that the narrow-band fluxes are LyC emission, and to discern cases with contamination by foreground sources from LyC emitting galaxies. Moreover, while the SSA22 field contains a prominent protocluster at (Steidel et al., 1998; Yamada et al., 2012), there is no known over-density of galaxies at in the GOODS-N. We can examine if there is any difference in the properties related to the LyC emission between the galaxies in a protocluster field and those in a general field.
We structure the paper as follows. In Section 2 we describe the narrow-band and broad-band imaging observations, the base sample used to search for LyC emitting galaxy candidates, and the additional observations and data used in this study. In Section 3, the procedure of data analyses and the selection of the LyC emitting galaxy candidates are presented. The properties of the LyC galaxy candidates are examined in Section 4, and in Section 5 we discuss the implications from the results, including a comparison with previous results in the SSA22 field and constraints on the LyC emissivity from galaxies at . Summary and conclusions are presented in Section 6.
We use a flat CDM cosmology with , . All magnitudes are presented in the AB system (Oke & Gunn, 1983).
2 Observations and sample construction
2.1 Suprime-Cam narrow-band imaging
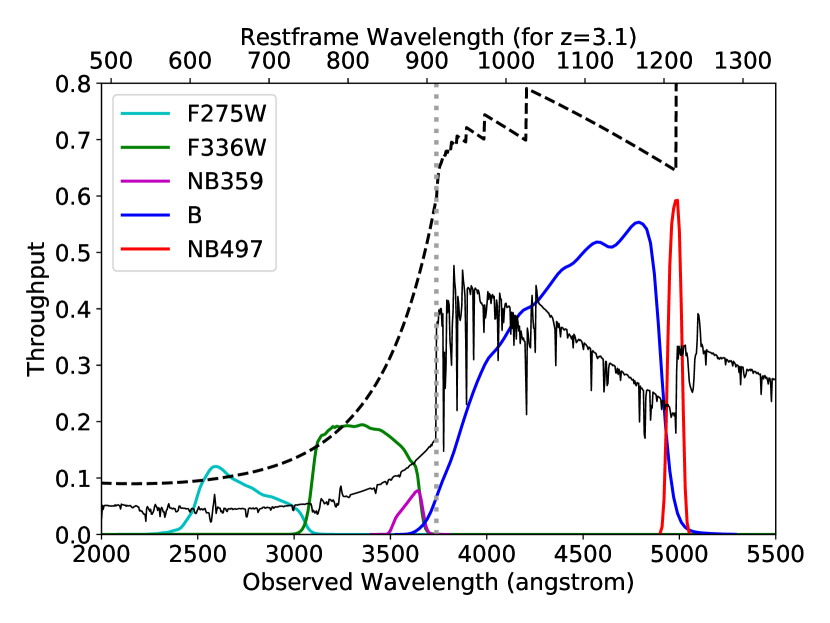
We used a narrow-band filter NB359 which was designed and fabricated to trace LyC from galaxies at . This filter was used in the previous study of Subaru / Suprime-Cam LyC search in the SSA22 field (Iwata et al., 2009; Micheva et al., 2017b). Laboratory measurements have confirmed that the transmission of the filter in the wavelength range of 400 nm – 1200 nm is less than 0.01%. In Fig. 1 the transmission curves for the Suprime-Cam filters (NB359, NB497, B) are shown along with the spectral energy distribution (SED) of a model star-forming galaxy at and average IGM transmission at this redshift. The model SED is taken from an output by BPASS version 2.1 (Eldridge et al., 2017), with a constant star formation rate, 10 Myr age, a metallicity of , and is displayed in units of . NB359 traces a narrow wavelength range just below the Lyman limit, where relatively small IGM opacity for LyC is expected with higher probability compared to shorter wavelengths.
The NB359 imaging observations were carried out using Suprime-Cam (Miyazaki et al., 2002), the prime focus optical camera for the Subaru telescope, on April 5, 2011, April 18–20, 2015, and May 7, 2016 (UT). The field centre (=12:36:49.4, =+62:08:58; J2000) was chosen to be aligned with existing Suprime-Cam imaging observations in broad-band (e.g., Iwata et al., 2007) and NB497 , and it covers the HST/ACS and WFC3 footprints by the GOODS (Giavalisco et al., 2004) and the CANDELS (Grogin et al., 2011; Koekemoer et al., 2011). The total on-source integration time of NB359 imaging is 32.5 hours.
The data reduction of the NB359 images was made using SDFRED2 (Ouchi et al., 2004). Photometric calibration was made using images of spectro-photometric standard stars taken on the same nights. After the mosaiced image was created, astrometric registration was made using sky coordinates of stars in the Sloan Digital Sky Survey (SDSS; York et al., 2000) in the field. The rms errors of positional alignments are –. The median FWHM of the image for point sources after the registration is . Five-sigma limiting magnitudes measured by randomly placing apertures on “empty” sky after masking objects are 27.09 and 26.34 for and diameter apertures, respectively.
2.2 Other Suprime-Cam images
We use Suprime-Cam V, , and z’-band imaging data of the GOODS-N field processed by Iwata et al. (2007). In addition, we collected and processed B-band data from the archive using the same software packages as those used for processing of the NB359 data. The NB497 image, which was used to select Ly emitter (LAE) candidates at in Yamada et al. (2012), together with all the Suprime-Cam images were astrometrically registered with SDSS. The FWHMs of point sources and the limiting magnitudes of B, V, , z’, NB497 images are 102, 111, 113, 113, 115 and 28.20, 28.17, 26.86, 26.55, 27.82 (5, diameter aperture), respectively. For aperture photometry the PSF sizes are adjusted by convolving the images with better seeing sizes so that FWHMs of point sources become uniform over the Suprime-Cam images with different filters.
2.3 HST imaging data
We use HST archival images of the GOODS-N field from CANDELS and HDUV (Oesch et al., 2018) projects, taken from Mikulski Archive for Space Telescopes (MAST). Although the HST observations cover a limited portion of the Suprime-Cam images as shown in Fig. 4, they have higher spatial resolution (FWHM –) than the Suprime-Cam images, enabling us to examine the morphologies of the target galaxies in detail. They are also helpful to find signatures of possible foreground contamination. The ACS F606W and F814W images from CANDELS correspond to images in the rest-frame non-ionizing UV wavelengths, while the WFC3/UVIS F275W and F336W images published by HDUV, trace rest-frame wavelengths shorter than the Lyman limit for our sample galaxies. In Fig. 1 transmission curves of WFC3/UVIS F275W and F336W are plotted, and the figure indicates differences in wavelength range covered by these filters and Suprime-Cam NB359.
2.4 Expected IGM transmission for ionizing photons
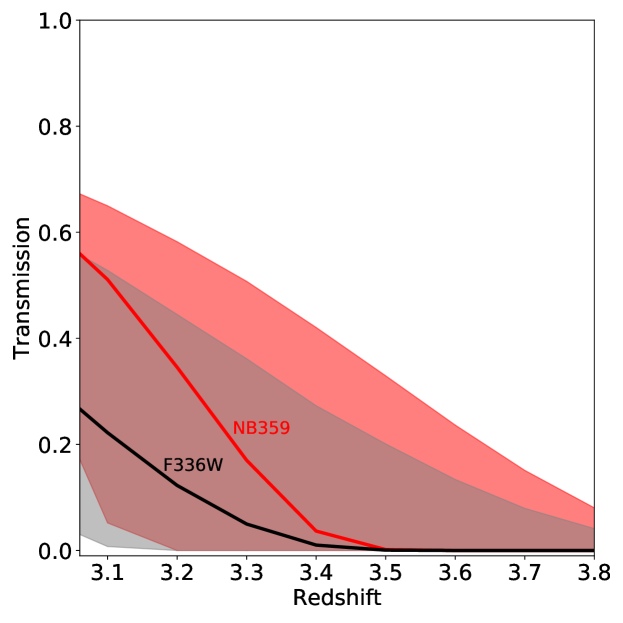
While both Suprime-Cam/NB359 and HST/F336W trace LyC for sources at , NB359 has a narrower filter bandpass, and it preferentially captures ionizing photons closer to the Lyman limit (see Fig. 1). Because IGM attenuation varies as a function of wavelength, expected transmissions of photons through the IGM (here we denote the ratio of flux density with and without IGM attenuation as ‘IGM transmission’) are different for different filters. In Fig. 2 we show the median and 68%-ile IGM transmission values of NB359 and F336W for a source at a redshift range of . These IGM transmissions are estimated from Monte Carlo simulations (Inoue & Iwata, 2008) which generate 10,000 sightlines for redshifts consistent with the Hi cloud distribution defined analytically by Inoue et al. (2014). For each sightline we calculate IGM transmission through NB359 or F336W for an object with a flat SED in (i.e., =constant) and obtain median and 68%-ile values from the 10,000 instances. These calculations are repeated from to 3.8 with a redshift step of 0.1. The median values of IGM transmission for NB359 are higher than those for F336W, especially at the lower redshift range. This is because NB359 traces a rest-frame wavelength range close to the Lyman limit where IGM transmission is higher than that for photons with shorter wavelengths. If the same limiting magnitude is achieved, NB359 is more sensitive for detecting LyC photons from galaxies than F336W. Median values of IGM transmission for both NB359 and F336W rapidly decrease as the source redshift increases, which indicates that the detection of LyC photons becomes increasingly difficult due to increasing IGM opacity. However, higher-side 68%-ile IGM transmission values at are 0.33 for NB359 and 0.20 for F336W, respectively. The fluctuation of IGM transmission among different sightlines is large, and there is still a reasonable number of sightlines with significant IGM transparency for LyC in the redshift range studied in this paper.
Rudie et al. (2013) used a correlation of the Ly forest in spectra of high- QSOs and galaxies in projected surrounding areas of the QSOs and found higher frequency of Hi clouds with column densities log(/cm in the CGM (300 pkpc) of galaxies compared to the IGM. Rudie et al. (2013) and Steidel et al. (2018) showed that the average LyC transmission is reduced when attenuation by the CGM in addition to the IGM is considered. Thus, the expected transmission of LyC shown in Fig. 2 could be overestimated if the galaxies in question are accompanied by the CGM, which contains Hi clouds with higher number density than the IGM. We will discuss such an effect of the CGM when we examine the escape fraction and emissivity of LyC for our sample galaxies in Section 5.3.
2.5 Sample selection
The LAE sample comes from the Subaru / Suprime-Cam NB497 imaging observations (Yamada et al., 2012). The selection was made based on the excess of NB497 flux densities over those in broad-band filters, which corresponds to the observed Ly equivalent widths higher than 190Å (see Yamada et al. (2012) for details). The number of LAE candidates in the field with the NB359 image is 158. These LAE candidates in the GOODS-N field have not been spectroscopically followed-up, other than a small subsample observed with Subaru / MOIRCS in the present study (described in Section 2.6). There was only one object with a spectroscopically confirmed redshift, a known quasar SDSS J123557.63+621024.4 at (Wirth et al., 2004) which is included in our ‘AGN’ sample and is removed from the ‘LAE’ sample.
We compiled a sample of galaxies with spectroscopic redshifts from literature. The lower limit of the redshift range was set to be 3.06, above which the NB359 filter transmission is free from contamination by non-ionizing photons. We set the upper limit of our primary sample to be , at which redshift the central wavelength of the NB359 filter corresponds to Å, and flux from an object at a redshift higher than that through NB359 will frequently suffer heavy IGM attenuation (see Fig. 2). Most of our sample galaxies come from Reddy et al. (2006) which provides a catalog of Lyman break galaxies (LBGs) in the GOODS-N field, and MOSDEF (MOSFIRE Deep Evolution Field; Kriek et al., 2015). We also considered Wirth et al. (2004) and Barger et al. (2008) as compilations of redshifts in the GOODS-N, as well as more recent reports of spectroscopic observations in the field. In Table 1 we summarize the sources of the sample galaxies with spectroscopic redshift between 3.06 and 3.5. Because the spectroscopic redshift information comes from different observations, the quality and precision of the redshifts may not be uniform. We excluded several objects from the literature for which the authors marked their redshifts as uncertain. For each galaxy in the list we identified a counterpart in the GOODS version 2 ACS catalog and checked the photometric redshifts and HST WFC3 grism data from 3D-HST (Skelton et al., 2014; Momcheva et al., 2016). Occasionally, a peak photometric redshift in the 3D-HST photometric catalog is lower than our redshift lower limit of 3.06. Even in such cases we adopt the spectroscopic redshift in the literature if no quality warning is given in the catalog. In the WFC3 grism data, if emission lines are significantly detected, the estimated redshift is mostly consistent with the ground-based spectroscopic redshift. However, there is one case for which the grism redshift () and the spectroscopic redshift () are largely different while the spectroscopic redshift is marked as robust in the spectroscopic catalog (Kriek et al., 2015). This object is separated from the main sample and it will be discussed in Section 3.1. In total there are 103 galaxies with known spectroscopic redshifts in the range , and all of them are within the ACS coverage of the GOODS-N field.
We also investigate LyC from AGNs in the same redshift range. In addition to four objects in the Subaru / Suprime-Cam field reported as AGNs in the literature (Hornschemeier et al., 2001; Barger et al., 2002; Reddy et al., 2006; Shen et al., 2007), we cross-checked galaxies with spectroscopic redshifts with the Chandra X-ray catalogs (Alexander et al., 2003; Xue et al., 2016) and included four galaxies with an X-ray detection. All of them are categorized as AGN in the catalog by Xue et al. (2016). Although it is not evident whether UV radiation from these relatively less luminous objects originates from AGN or star-formation, in this study these objects are included in the ‘AGN’ sample and are excluded from the sample of SFGs. The total number of objects in the AGN sample is eight. Two among them are located outside of the GOODS-N ACS coverage.
| Source | Number |
|---|---|
| Kriek et al. (2015) | 41 |
| Reddy et al. (2006) | 34 |
| Schenker et al. (2013) | 9 |
| Momcheva et al. (2016) | 7 |
| Lowenthal et al. (1997) | 3 |
| Adams et al. (2011) | 3 |
| U et al. (2015) | 2 |
| Cohen et al. (2000) | 1 |
| Shapley et al. (2001) | 1 |
| Wirth et al. (2004) | 1 |
| Pirzkal et al. (2013) | 1 |
| Total | 103 |


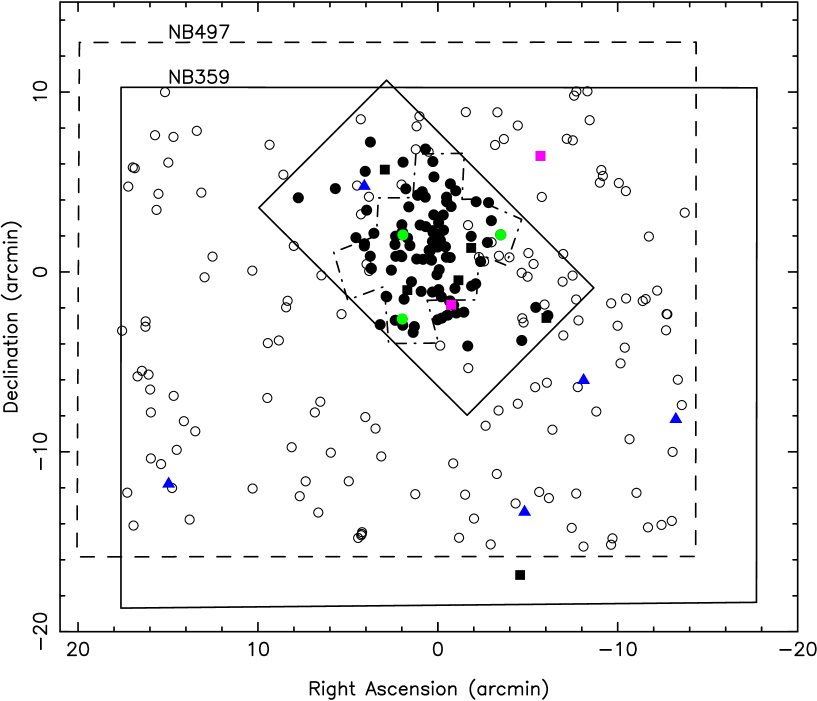
The -band magnitude distribution of the sample galaxies (including AGNs and LAEs) and the redshift distribution of the SFGs and AGNs are shown in Fig. 3. In Fig. 4 we show a spatial distribution of the sample as well as the field coverage of the HST and Suprime-Cam images.
2.6 MOIRCS spectroscopy
We conducted follow-up near-infrared multi-object spectroscopy observations for some of the LyC emitting galaxy candidates using the Multi-Object Infrared Camera and Spectrograph (MOIRCS; Suzuki et al., 2008) at the Subaru Telescope which has recently received a detector upgrade with two Teledyne H2RGs (Walawender et al., 2016; Fabricius et al., 2016). The observations were on March 2, May 21, and June 17, 2018 (UT) with clear sky and moderately good seeing condition. In total, three fields in the GOODS-N area have been observed. Details of the observations are given in Table 2. For all these observations we used the HK500 grism which covers 1.3–2.3 in a single exposure and delivers a spectral resolution of with 09 slits.
The data reduction was made using NOAO/IRAF, with some commands from MCSMDP111MCSMDP is distributed in the MOIRCS web site at https://www.subarutelescope.org/Observing/Instruments/MOIRCS/, the multi-object spectroscopy data reduction package for MOIRCS (Yoshikawa et al., 2010).
| Pointing centre (J2000) | Slit width() | Exposure Time | Observing date (UT) |
|---|---|---|---|
| 12:36:53.179 +62:12:44.25 | 0.9 | 10440 sec | March 2, 2018 |
| 0.7 | 8640 sec | May 21, 2018 | |
| 12:35:35.960 +62:09:26.04 | 0.9 | 7200 sec | March 2, 2018 |
| 12:36:41.080 +62:14:56.10 | 0.7 | 4680 sec | June 17, 2018 |
3 Selection of LyC candidates
3.1 Narrow-band image photometry and selection of LyC candidates
We applied aperture photometry to the NB359 image at the centroid positions of the sample objects obtained from the z-band (F850LP for ACS) for the SFGs and from NB497 for the LAEs. For SFGs within the ACS GOODS-N coverage, the positions were taken from the v2.0 of the GOODS ACS catalogue 222For one object in the SFG sample (MOSDEF 19947) the GOODS catalog does not separate it from a nearby bright source and the object is not recorded in the catalog. For this object we applied the aperture photometry at its peak position in F850LP image.. We used a diameter aperture to find candidates of LyC emission. We should note that this procedure is different from the way LyC emitter candidates are identified in Iwata et al. (2009) and Micheva et al. (2017b), where sources with 3 detection in NB359 with a diameter aperture within a (in Iwata et al. (2009)) or (in Micheva et al. (2017b)) radius of the R-band position are selected. As discussed in Micheva et al. (2017b), the procedure in the previous studies allows a detection of LyC emission with a spatial offset from the rest-frame non-ionizing UV radiation, which may happen in highly active, morphologically disturbed galaxies or with star formation taking place in the outskirts of the galaxies. However, because half-light radii or effective radii of star-forming galaxies are typically less than 2 kpc (e.g., Bouwens et al., 2004; Shibuya et al., 2015), or (which corresponds to and 11 kpc, respectively) may be too large to be a threshold of physical association. Moreover, it also increases the chances of mis-identification of sources with overlapping foreground objects, which have been recognized as a major obstacle in finding genuine LyC emitters (e.g., Vanzella et al., 2010a; Siana et al., 2015). In the present study, in order to reduce the probability of chance overlap with foreground sources, we choose galaxies with 3 signal in NB359 at the centroid position in the rest-frame UV wavelength.
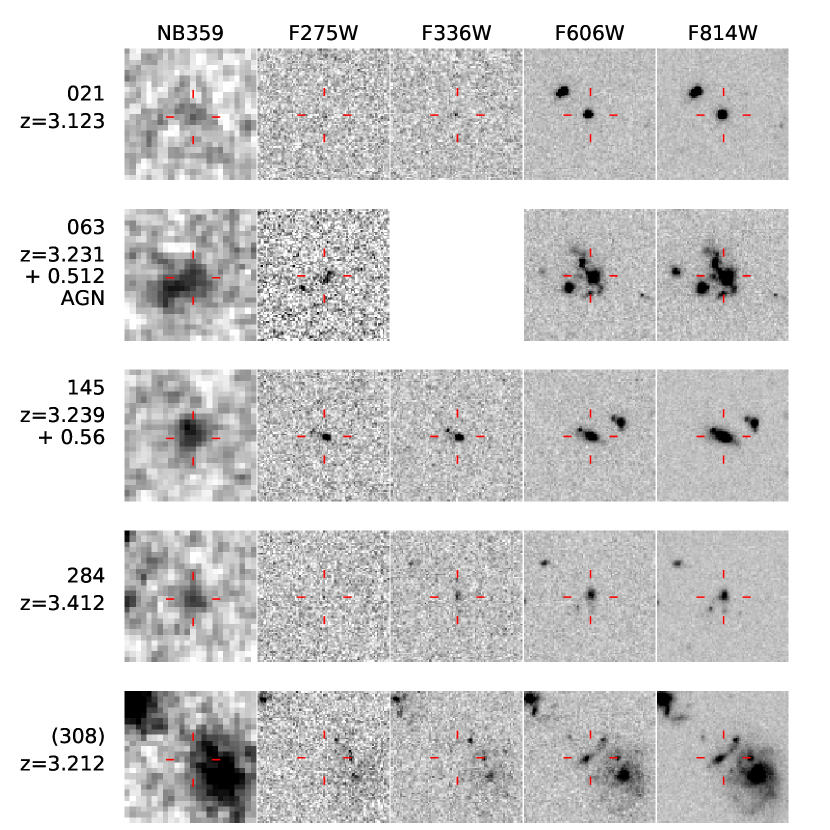
In the SFG sample, four among 103 sample galaxies have 3 signal at the centroid position in the z-band image. In Fig. 5 we show the postage stamp images of the four SFGs in Subaru / Suprime-Cam NB359, HST WFC3/UVIS F275W and F336W from HDUV, and HST ACS F606W and F814W from CANDELS. For object 308 (MOSDEF 19947) the NB359 image is contaminated by a nearby bright galaxy. We treat this as a false detection and the object is removed from the LyC candidates.
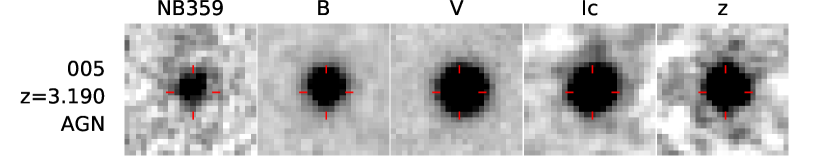
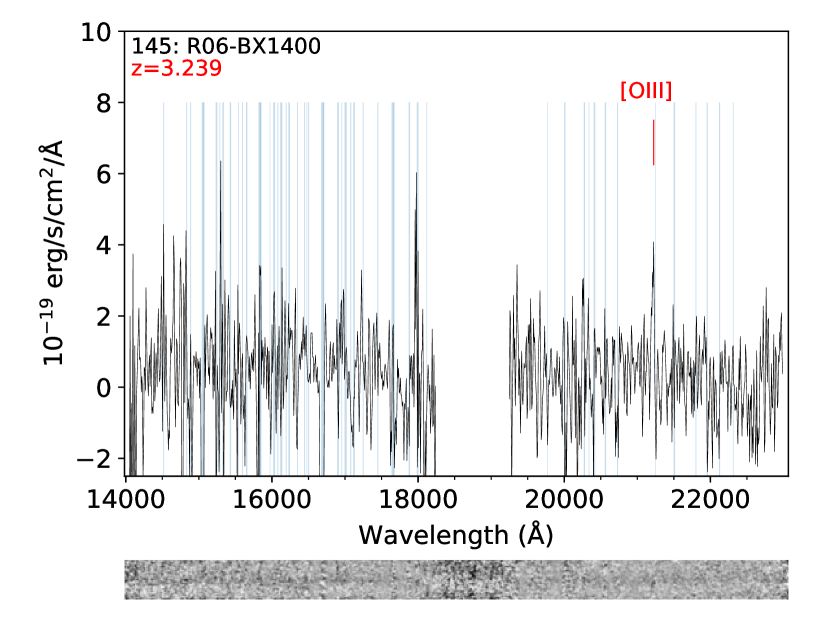
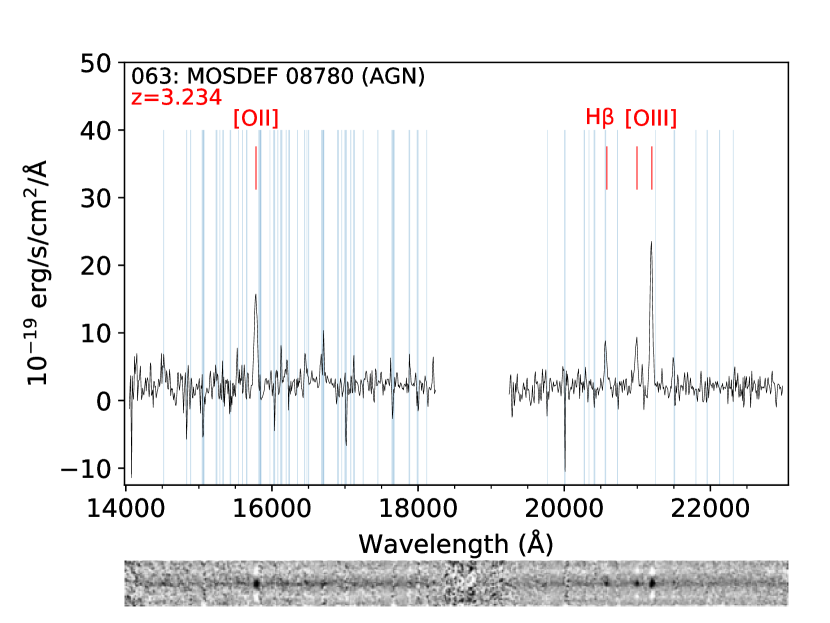
Among the eight objects in the AGN sample, six are within the GOODS-N field. One object with running number 063 has 3 signal. The postage stamp image of the object is shown in Fig. 5. Another object with 3 NB359 signal among the AGN sample is B02-049, shown in Fig. 6. This object is outside of the GOODS-N ACS coverage. Table 3 summarizes some basic information on the SFG/AGN objects with NB359 signal detection. Among these five objects, Jones et al. (2018) obtained Keck / DEIMOS optical spectroscopy of object 145: R06-BX1400 (their GN-UVC-3) and object 063: MOSDEF 08780 (their GN-UVC-2), and found emission lines indicating contamination by lower redshift sources at and , respectively. We will further discuss the possibility of foreground contamination of the SFG LyC candidates in Section 4.2.
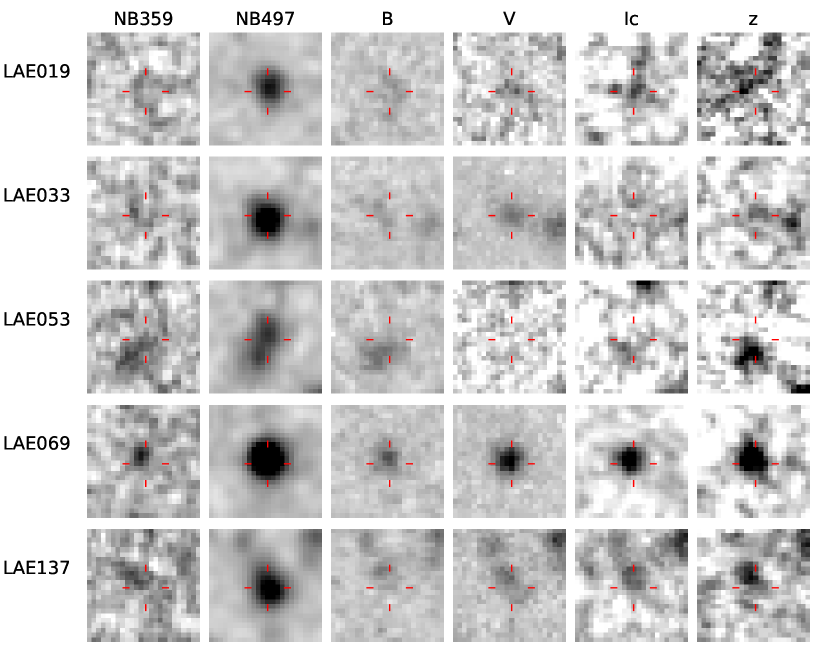
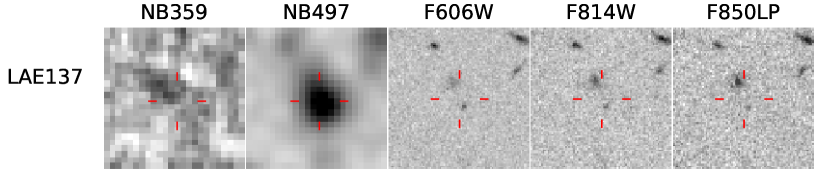
Among 157 objects in the LAE sample (with the one known quasar eliminated from the sample), five objects have 3 signal in the NB359 filter at the peak positions in the NB497 filter with a diameter aperture. Postage stamp images of these objects are shown in Fig. 7, and Table 3 provides their basic information. As shown in the spatial distribution (Fig. 4), our LAE sample distributes over the entire Suprime-Cam image, and among these six objects only one object, LAE 137 is located within the HST / ACS coverage. The ACS image of the object (Fig. 8) shows that there are in fact two objects, one associated with the NB359 and the other with the NB497 signals. Therefore, the high spatial resolution ACS image suggests that this NB359 detection may be due to foreground contamination. Similarly, for LAE 053 in the seeing-limited Suprime-Cam images in Fig. 7 there are two knots in its NB497 image, and the NB359 emission is associated only with one of the NB497 knots which is seen in broad-band images but is not associated with the other knot only visible in NB497. This geometry suggests that this is another instance of foreground contamination. The spatial offsets between the centroid in NB359 and that in NB497 for these two objects are which are larger than the offset values for the other candidates (Table 3). We also treat another object, LAE 033 as another LAE possibly being contaminated by a foreground object, based on the large value (1.30). We will make more discussion in Section 4.2.3 on possibilities of foreground contamination.
| Designation | R.A. | Decl. | Redshift | Sep.c | Ref.d | ||||
| (J2000) | (′′) | ||||||||
| Star-forming galaxies | |||||||||
| 021 | R06-D23 | 189.08048 | 62.25039 | 3.123 | 1 | ||||
| 145 | R06-BX1400e | 189.27555 | 62.25037 | 3.239 + 0.560 | 1 | ||||
| 284 | MOSDEF 06336 | 189.27660 | 62.17246 | 3.412 | 2 | ||||
| AGNs | |||||||||
| 005 | B02-049 | 189.00165 | 62.32369 | 3.190 | 3 | ||||
| 063 | MOSDEF 08780f | 189.17954 | 62.18572 | 3.2306 + 0.512 | 2 | ||||
| LAEs | |||||||||
| LAE 019 | 189.03346 | 61.99364 | – | ||||||
| LAE 033g | 189.74088 | 62.01967 | – | ||||||
| LAE 053g | 188.73271 | 62.07962 | – | ||||||
| LAE 069 | 188.91621 | 62.11565 | – | ||||||
| LAE 137g | 189.35200 | 62.29561 | – | ||||||
Notes. a: Magnitudes are measured with a diameter aperture. b: is the flux density in NB359 , and is the flux density at rest-frame 1500Å (see text for details.) c: Spatial offsets between the centroid in NB359 and that in the -band (for SFGs and AGNs) or in NB497 (for LAEs). d: Redshift references: (1) Reddy et al. (2006), (2) Kriek et al. (2015), (3) Barger et al. (2002). e: GN-UVC-3 with a spectroscopic interloper at in Jones et al. (2018). f: GN-UVC-2 with a spectroscopic interloper at in Jones et al. (2018). g: possibly contaminated by a foreground source (see text).
In Table 3 we list the AB magnitudes in NB359 and of the NB359 detected sources. Although during the selection of NB359 detected objects we use a diameter aperture, for the photometry data shown in the table we use a diameter aperture, which gives on average about 40% larger flux densities with Suprime-Cam broad-band filters than the diameter aperture, so that these flux densities and flux ratios represent values closer to the ‘total’ values. We also show the flux ratios between LyC and non-ionizing UV photons at rest-frame 1500 Å (labeled as ‘’). The NB359 flux density is used for . For SFGs and AGNs, we calculate rest-frame 1500 Å flux densities from the flux densities in -band and z-band, with a simple linear extrapolation:
| (1) |
where and are the flux densities in -band and -band, respectively, is the redshift of the object, and and are the effective wavelengths of the filters (7979Å and 9067Å, respectively). Here we do not use the flux density in the -band to estimate the rest-frame UV slope, because Ly photons could be contained within the -band filter for an object in the redshift range considered in the present study. Since the /z flux ratios of the SFGs and AGNs are close to unity, the changes in flux ratios when simply using flux densities are small and they are within the errors given in the table. Since the continuum flux densities of LAEs are low, and their rest-frame UV slopes are not well constrained, we use their flux densities in which correspond to Å in rest-frame.
In the compilation of galaxies with spectroscopic redshifts, there are several redshifts flagged as uncertain in the original catalog and with no additional spectroscopic observation to confirm these redshifts, or objects with conflicting redshift inferences by different authors. There are seven such sources in the redshift range , and three objects among them have 3 detection in NB359. In Fig. 9 their postage stamp images are shown, and Table 4 provides a list of these objects. Although object 261 (MOSDEF 13286) is listed with a redshift quality flag 7 (based on multiple emission lines or robust absorption-line redshift) in the MOSDEF catalog, 3D-HST grism spectrum in (Pirzkal et al., 2013) shows multiple emission lines such as H, [Oii] and [Oiii] with a best estimate redshift of 2.01. In Fig. 9 there are two separated components in the HST images and they might be two independent objects at and , although in the F336W image both components appear to be detected. Without further spectroscopy we cannot conclude whether the NB359 signal comes from the object at , and we treat this object as an object with uncertain redshift. For the other two objects in Table 4, Lowenthal et al. (1997) and Dawson et al. (2001) noted that the quality of their optical spectra is too low to conclude their redshifts confidently. Deeper spectroscopy would be necessary to determine whether they are LyC emitters or not. In the following analyses we exclude all of these objects with uncertain redshifts.
Grazian et al. (2017) used LBT / LBC U-band imaging data to search for LyC leakage from galaxies in redshift range in multiple fields, including the GOODS-N. They reported a detection of one galaxy in the GOODS-N at with a careful note of possible contamination by a nearby source. In our NB359 image the signal from this object is with a diameter aperture, and the object is not included in our list of LyC candidates.
| Designation | R.A.(J2000) | Decl.(J2000) | Redshift | Ref.b | Note | ||
|---|---|---|---|---|---|---|---|
| 261 | MOSDEF 13286 | 189.21385 | 62.20760 | 3.226? | 2 | in Pirzkal et al. (2013) | |
| 078 | hd2_0853_0319 | 189.19540 | 62.22436 | 3.35? | 4 | ||
| 126 | F36568-1353 | 189.23692 | 62.23152 | 3.43? | 5 |
3.2 Near-infrared spectroscopy
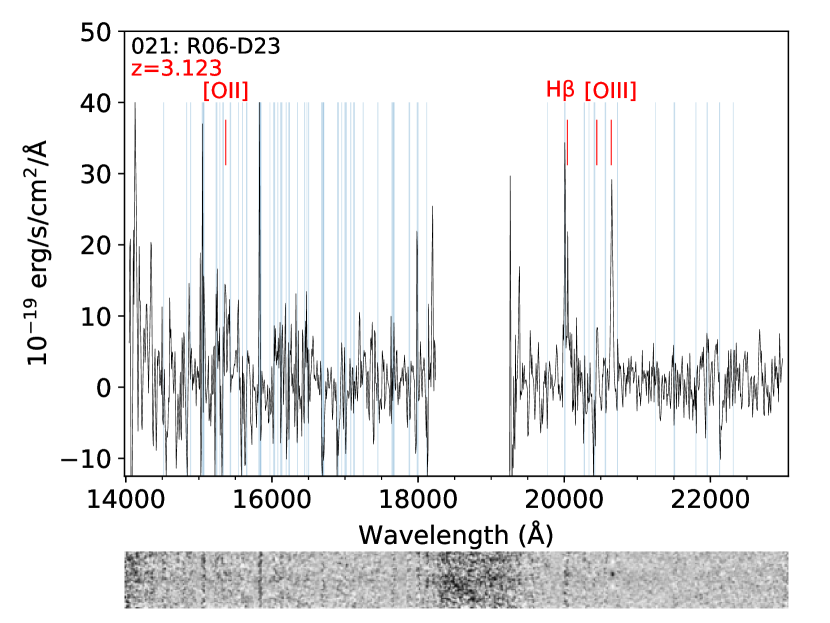
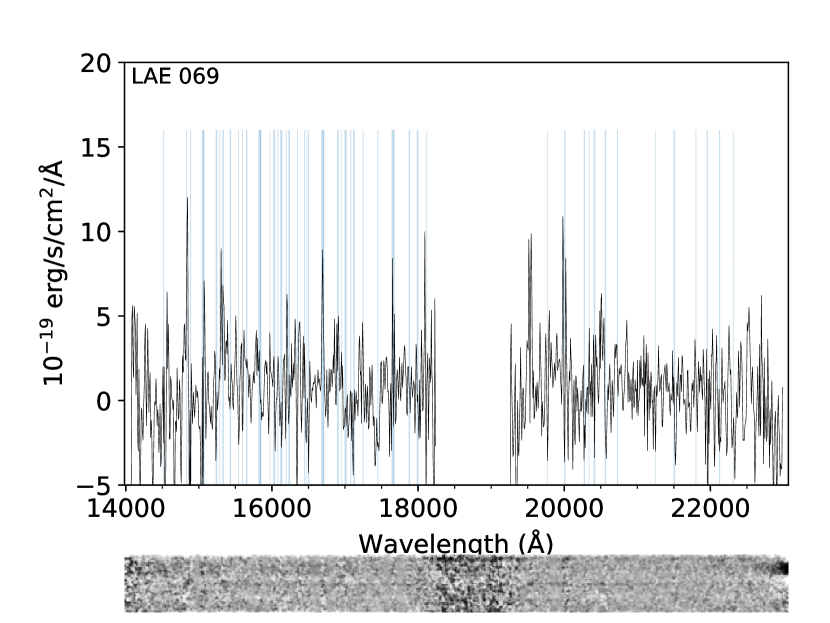
In our MOIRCS spectroscopy, among the objects detected in the NB359 image, two objects in the SFG sample, one object in the AGN sample, and one object in the LAE sample are observed. Fig. 10 shows their H and K-band spectra. For object 021 (R06-D23) our near-infrared spectrum confirms the reported redshift by Reddy et al. (2006). Jones et al. (2018) reported contamination by a foreground source at for both object 145 (R06-BX1400) and object 063 (MOSDEF 08780) through their optical spectroscopy. In the H and K-band wavelength range there is no strong feature expected from an object at such redshift, and we do not identify any sign of foreground sources for these two objects. The spectrum of LAE 069, which is among the sample selected with an excess in the NB497 image, does not show any feature other than weak continuum, and we could not confirm its redshift.
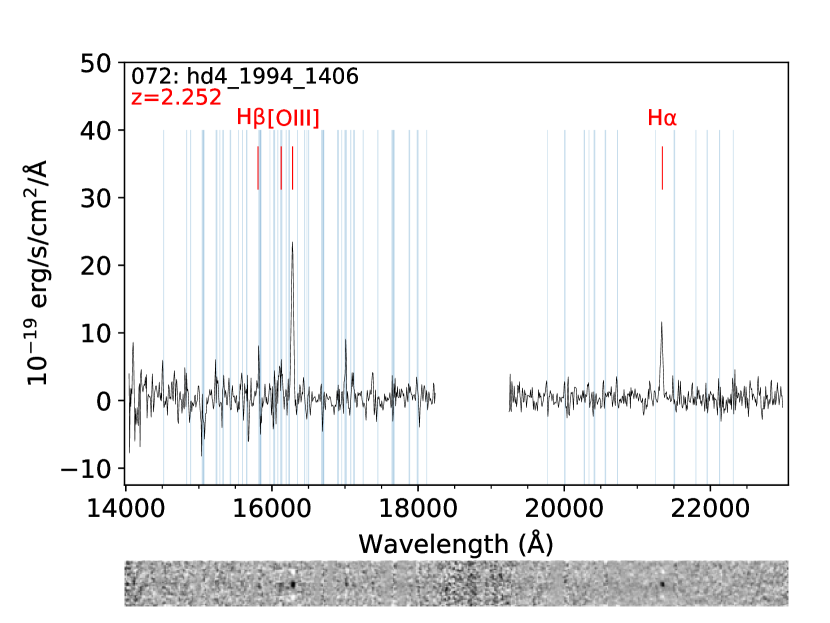
In Table 5 we summarize the redshifts of observed targets for which multiple and conflicting redshift estimates were available in the literature or our redshift determinations are new. Object 072 (hd4_1994_1406 in Lowenthal et al. (1997)) has a redshift estimate with uncertainty, and our near-infrared spectroscopy determined its redshift as with identification of H, [Oiii] and H emission lines. Fig. 11 shows the MOIRCS spectrum of the object. Although this object is detected in NB359, with this lower redshift NB359 does not trace ionizing radiation. Also, with our spectroscopy we confirmed redshifts of three objects in the MOSDEF survey, namely MOSDEF 17204, MOSDEF 18436 and MOSDEF 12302, which have conflicting redshift entries in the literature. The lower redshifts in MOSDEF are confirmed, and therefore for these objects NB359 does not trace ionizing radiation. Among NB497-selected LAE candidates not detected in NB359, we list three redshift identifications with the [Oiii]5007 line, although for two of them the line detections are marginal.
| Designation | R.A.(J2000) | Decl.(J2000) | Redshift | Lines | Notes |
|---|---|---|---|---|---|
| MOSDEF 17204 | 189.16877 | 62.22633 | 1.490 | H | F364051334: in Dawson et al. (2001), |
| in Kriek et al. (2015) | |||||
| MOSDEF 18436 | 189.17022 | 62.23287 | 2.993 | [OIII]4959,5007 | R06-MD43: in Reddy et al. (2006), |
| in Kriek et al. (2015) | |||||
| hd4_1994_1406 | 189.18885 | 62.19403 | 2.252 | H,[OIII]5007,H | in Lowenthal et al. (1997) |
| MOSDEF 12302 | 189.30953 | 62.20236 | 2.275 | H,[OIII]5007,H | AGN; in Barger et al. (2008), |
| in Kriek et al. (2015) | |||||
| LAE082 | 188.84854 | 62.16625 | 3.083 | [OIII]5007 | |
| LAE097 | 188.86138 | 62.18704 | 3.091? | [OIII]5007? | |
| LAE091 | 189.18979 | 62.17562 | 3.085? | [OIII]5007? |
4 Properties of LyC Candidates
Among 103 SFGs with secure spectroscopic redshifts within a range , three galaxies are detected with NB359 at 3 level. One object among them (running number 145, R06-BX1400) is found to be contaminated by a foreground object by Jones et al. (2018), and thus there are two SFGs with possibly genuine LyC emission. Among 157 LAE candidates, there are five objects detected with NB359. None of these LAE candidates has a spectroscopically confirmed redshift, although by spectroscopic observations of the LAE candidates in the SSA22 field selected with the same NB497 filter it has been reported that the contamination rate is as small as 1% (Yamada et al., 2012). Here we examine the properties of the remaining two star-forming LyC emitter candidates, as well as those of the NB359 detected LAE candidates.
4.1 Spectral energy distribution
First we examine the SEDs of the two LyC emitting SFG candidates. Fig. 12 shows their flux densities in HST/ACS F435W, F606W, F850LP, WFC3/IR F125W, F140W, F160W, normalized by the flux density in F775W. These flux densities are taken from the 3D-HST photometric catalog (Skelton et al., 2014). The flux density distribution in each filter for the entire SFG sample (excluding one object which does not have any entry in the catalog by Skelton et al. (2014)) is indicated by the shaded areas which contain 68% and 95% of the sample galaxies. The redshift range of the sample galaxies spans from to 3.5, and the corresponding rest-frame wavelength range shown in this figure is from 1000Å to 4000Å. Although the SED of object 021 (R06-D23) is within a 68%-ile area for the entire SFG sample, the SED of object 284 (MOSDEF 06336) is peculiar; its rest-frame far-UV SED (traced with F435W, F606W, and F775W) is very flat, while there is a spectral break between F850LP and F125W. Because this object is reported to be at , F435W traces rest-frame wavelength shorter than Ly, and such a flat SED at far-UV needs optically thin IGM or an extremely blue SED. However, the red SED at longer wavelengths seems to be in conflict with the latter option.
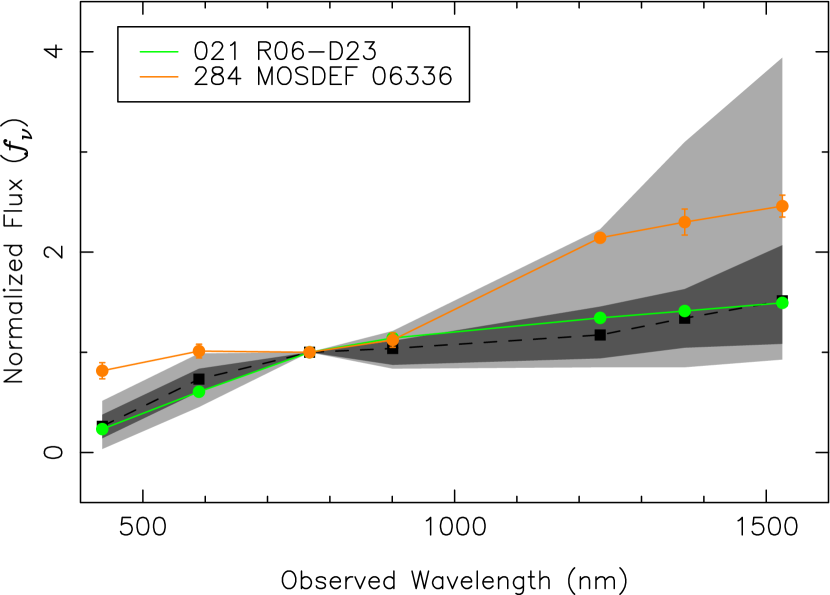
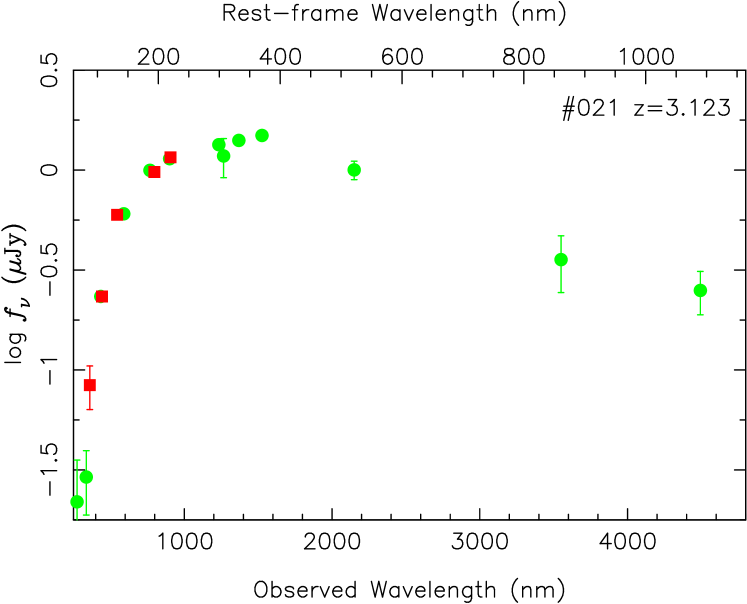
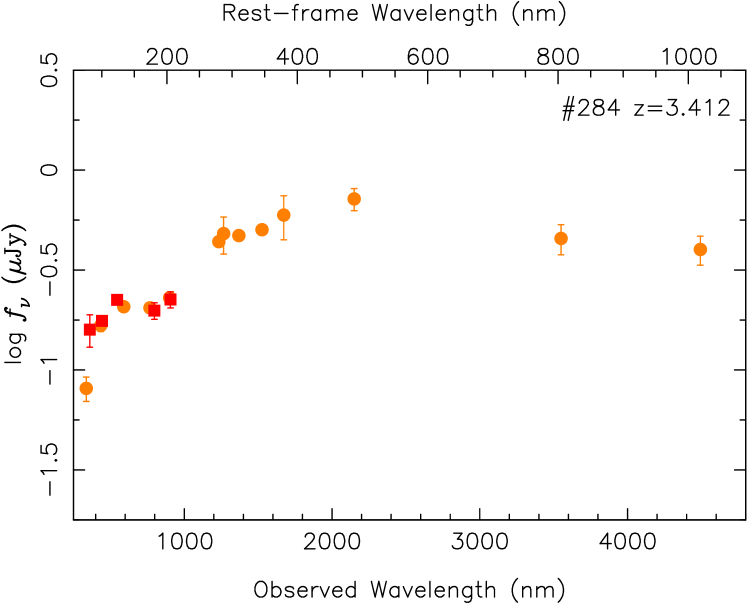
Fig. 13 shows the SEDs of the two LyC emitting SFG candidates in broader wavelength range. Data points for near-IR photometry from MOIRCS Deep Survey (Kajisawa et al., 2011) and Spitzer IRAC Channel 1 and 2 photometry from SEDS (Ashby et al., 2013), taken from the photometric catalog by Skelton et al. (2014), as well as Suprime-Cam photometric data points are plotted. In Suprime-Cam photometry a diameter aperture is used, and the factor to scale the aperture flux to the 3D-HST total flux is calculated by averaging the flux ratios between the 3D-HST total flux and the Suprime-Cam aperture flux in B, , and z-band, and the factor is applied to the flux densities in all Suprime-Cam bands.
Again, the SED of object 284 is puzzling. In addition to the spectral break around 1m observed wavelength, the flux ratio between NB359 and is 0.80. This means that if this object is at , the observed without correction for IGM attenuation is close to unity. If we correct the flux ratio assuming the average IGM attenuation at the redshift ( for NB359), the LyC/UV flux ratio exceeds 6. However, as shown in Fig. 2, a significant fraction of sightlines toward objects at has IGM transmission as high as 0.5 (according to the Monte Carlo simulation described in Section 2.4, 18% of sightlines have an IGM transmission higher than 0.4 for NB359 ). If the IGM toward object 284 has such a low opacity, the IGM-corrected LyC/UV flux ratio would be . Population synthesis models of metal-poor, young stellar populations predict relatively high values. For example, BPASS version 2.1 (Eldridge et al., 2017) with a constant star formation rate, metallicity or lower, an IMF slope from 0.5 to 300 , without dust attenuation gives for a galaxy with age 1 to 100 Myrs. Although even with such metal-poor stellar populations larger than unity is difficult to be explained, Inoue (2010) showed that an SED with escaping nebular bound-free LyC could make a LyC ‘bump’ just below the Lyman limit and intrinsic 1 (see also detailed discussions in Inoue et al., 2011). Therefore, although the SED of object 284 appears to be peculiar, we cannot rule out the possibility that this object is a genuine LyC emitter at . We further discuss the reality of the LyC detection of these two SFGs in the next subsection.
4.2 Reality of LyC detections
4.2.1 Object 021: R06-D23
Object 021 (R06-D23) is unresolved in the HST/ACS images, which means that the FWHM is less than kpc at . We confirmed its redshift with near-infrared spectroscopy (Section 3.2). The optical spectrum of the object taken with Keck/LRIS (C. Steidel, private communication) shows Ly emission with line width of 700 km s-1 and rest-frame UV absorption lines such as Oi, Cii which give its redshift , and there is no sign of broad-line AGN. No counterpart is found in the Chandra 2Ms X-ray catalogs (Alexander et al., 2003; Xue et al., 2016). There is no indication of a foreground source in the HST images and spectra. Although weak AGN may contribute to its LyC emission, based on these observations we consider that this object is a real LyC emitting SFG at . This object is also identified as a star-forming LAE GN-NB5-5878 with Ly redshift of 3.129 in Sobral et al. (2018).
4.2.2 Object 284: MOSDEF 06336
The situation for object 284 (MOSDEF 06336) is more complicated. Its HST/ACS images show faint nearby sources (see Fig. 5), which may be physically associated with the object or sources in the background / foreground. The position of NB359 and F336W images align with the brightest component. As discussed in Section 4.1, the SED of the brightest component is difficult to be explained with a source redshift of . A quick photometric redshift estimate using EAZY (Brammer et al., 2008) with default templates returns as the maximum probability photometric redshift. On the other hand, MOSDEF -band spectrum of the object (N. Reddy, private communication) shows [Oiii] 4959, 5007 and H which give its systemic redshift at . The slit configuration of the MOSDEF spectra is such that a fainter nearby source to the south east may partially be falling in the slit, merging with the spectrum of object 284. The spectroscopic redshift of this nearby source is unknown but it has ID 6381 with a photometric redshift of in the 3D-HST v4.1 photometric catalog (Skelton et al., 2014). No major emission line is expected to be observed for a galaxy at in the near-infrared wavelengths. The -band flux density of the object from the MOIRCS Deep Survey (Kajisawa et al., 2011) is 0.29 Jy. On the other hand, the total flux of [Oiii]+H is erg s-1 cm-2, and it corresponds to 0.23 Jy when diluted to -band. Because the fainter nearby source only partially falls into the slit, it is unlikely that it can fully account for the [Oiii] and H emissions. Therefore, we conclude that these emission lines at originate from the brightest object where NB359 and F336W images are aligned. Although the SED of the object is difficult to interpret, without any strong evidence for foreground contamination we retain the object as a candidate LyC emitting galaxy, but we keep in mind that this object is not a highly reliable LyC candidate333Flux density measured with NB359 for object 284 is about a factor of 2 higher than in F336W. This may be explained by the difference in band widths of these filters and a variation of the IGM attenuation by Hi clouds at different redshifts (see Fig. 2)..
4.2.3 NB359 -detected LAEs
Among the five LAE candidates with a 3 detection in NB359 , flux densities in NB359 of both LAE019 and LAE033 are 3.2, which is smaller than the values for the other LAEs (), and their postage stamp images shown in Fig. 7 are less convincing. In order to test the significance of the flux signal in NB359 for these objects, we split the reduced individual observed frames into two groups, stacked them separately to produce two independent mosaiced images with half the total integration time, and measured flux densities of the five objects with a diameter aperture. While the measured flux densities of the other three objects are in both mosaiced images of half the total integration time, the flux densities are 1.0 and 2.2 for LAE019, and 1.5 and 1.4 for LAE033. The flux measurements in the mosaiced images are consistent with each other within errors estimated from the measured background fluctuation of the images, and this test excludes a possibility that these detections are based on a spike noise in a single frame. We thus retain LAE019 and LAE033 as candidates of LyC detection, although the significance of the signals for these objects is smaller than for the rest.
As described in Section 3.1, in two among the five candidates the NB359 signal appears to be associated with an object spatially separated from the NB497 detection, and we consider that these two objects are likely to be contaminated by foreground sources.
The flux ratios of three LAEs exceed unity (Table 3). Although such high is possible as discussed in Section 4.1, an overlap of a foreground source can also explain such flux ratios. Indeed, two among the three are LAE053 and LAE137 which have large spatial offsets between NB359 and NB497 (081 and 059, respectively; see Table 3). Although the spatial offset for the other object LAE033 is smaller (031) than these two objects, we also treat the object as one possibly contaminated by a foreground object based on its high (1.30). Thus among the five LAEs with NB359 signal, three are considered to be possibly contaminated by foreground objects. In Section 5.1 we examine statistical probabilities of foreground contamination, and there is a non-negligible likelihood that all of these NB359 detected LAE candidates are contaminated by foreground sources. Deep optical / near-infrared spectroscopy and / or sensitive imaging with high spatial resolution are required to further assess the reality of these LyC emitting LAE candidates.
There must be a selection bias that we preferentially select objects with high for objects with faint rest-frame UV continuum, due to the sensitivity limit of our NB359 imaging observations. However, as we will see in Section 5.2, we have not detected sources with high in UV-bright sources, and there would be a correlation between UV luminosity and (and hence the escape fraction of LyC; see Fletcher et al. (2018)).
4.3 Ly equivalent widths and LyC escape
For galaxies at redshifts between 3.06 and 3.126 NB497 can be used to measure the Ly flux density. In addition to the LAE sample, there are seven galaxies in the SFG sample which are within this redshift range. Among them, one object (021 R06-D23; see Table 3) is detected in NB359. In Fig. 14 the observed Ly equivalent widths (EWs) of LAEs and these SFGs are plotted against LyC to rest-frame non-ionizing UV flux ratios. Ly EWs are calculated following Matsuda et al. (2009); Micheva et al. (2017b), using a ‘BV’ image, BV=((2B+V)/3):
where Å, Å, and Å are the FWHMs of the B, V and NB497, respectively, and BV and NB497 represent magnitudes in these bands. In Fig. 14 objects with a NB359 signal smaller than are plotted with downward arrows.
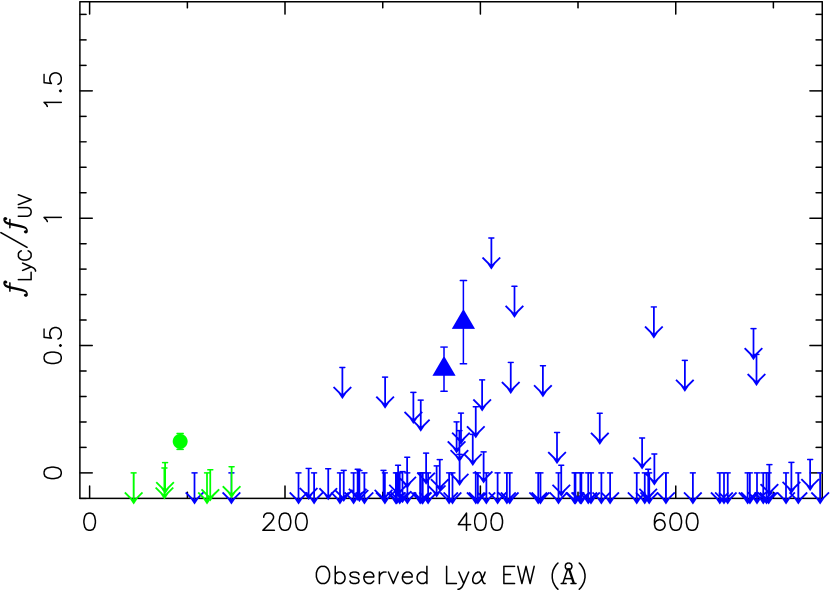
In Micheva et al. (2017b), a possible correlation between the Ly EW and the LyC-to-UV flux ratio for LAEs and LBGs in the SSA22 field has been pointed out. The trend seen in the GOODS-N is qualitatively similar, although the number of NB359 detections in the present sample is smaller. Fletcher et al. (2018) also found a positive correlation between the Ly EW and the LyC escape fraction for their SSA22 sample. As noted by these authors, this correlation may be a secondary relation since both LyC-to-UV flux ratio (and LyC escape fraction which is derived from LyC-to-UV flux ratio with corrections for IGM/CGM attenuation and intrinsic flux ratio) and Ly EW depend on the non-ionizing UV flux density. Steidel et al. (2018) argued that there is a tight correlation between the covering fraction of the interstellar medium (ISM) and the Ly EW. The covering fraction and Hi column density of the ISM were estimated through fitting spectral synthesis models with simple geometries of the ISM by damping wings of Ly and absorption lines, the depth of higher order Lyman series, and the residual LyC flux of the composite spectra of their LBG sample galaxies. They suggested that the ISM geometry with ‘holes’, through which both LyC and a fraction of Ly could escape, would explain the tight correlation between the estimated covering fraction, the Ly EW, and the LyC escape fraction.
Such a correlation between Ly EWs and the LyC escape fraction is also reported for LyC emitting galaxies at lower redshifts (Verhamme et al., 2017). Verhamme et al. (2015) argued that in star-forming regions with a covering fraction less than unity or density-bounded nebulae, optically thin to LyC, there will be significant LyC leakage (Zackrisson et al., 2013), and Ly emission will have prominent spectral shapes such as a small offset from systemic redshift and/or a double peak. Examining the Ly spectral profiles of LyC emitting LAEs will be an interesting future endeavour.
4.4 Rest-frame optical line ratios
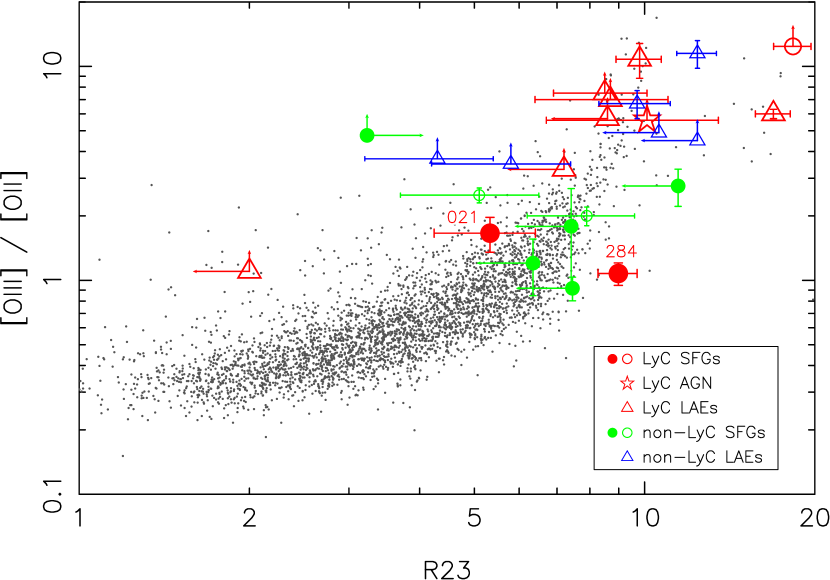
There has been accumulating observational evidence that there is a correlation between the [Oiii] emission line strength and LyC leakage. Nakajima & Ouchi (2014) and Nakajima et al. (2016) found that star-forming galaxies at , especially LAEs, have higher [Oiii]/[Oii] line ratios than star-forming galaxies at lower redshifts, and LyC emitting galaxies show even higher [Oiii]/[Oii] ratios, O32=[Oiii]4959,5007/[Oii]3727 as high as . Nakajima et al. (2016) argued that these high [Oiii]/[Oii] ratios are not only due to lower metallicities but are caused by harder ionizing radiation and/or density bounded nebulae, all of which are properties that could lead to strong LyC radiation. Fletcher et al. (2018) found a high LyC detection rate (30%) for LAEs with intense [Oiii] emission (see, however, Naidu et al. (2018) who found no LyC emitting galaxy among photometrically selected strong [Oiii] emitters at ). In the lower redshift, Izotov et al. (2016a); Izotov et al. (2016b); Izotov et al. (2018a); Izotov et al. (2018b) found LyC emitting galaxies at by selecting compact star-forming galaxies with a high O32 ratio. The LyC escape fraction of these galaxies are estimated to be as high as 70%.
Table 6 gives a summary of the optical emission line measurements for a subset of the SFG sample galaxies. In Fig. 15 we show R23 = ([Oiii]4959,5007+[Oii]3727)/H and O32 for two LyC emitting candidate SFGs and five other SFGs in our sample with [Oiii] and [Oii] measurements, along with values of LBGs and LAEs in the literature. The dust attenuation of our sample galaxies is estimated by fitting their photometric data from UV to IR compiled by Skelton et al. (2014) with model SEDs generated using the population synthesis code PÉGASE (Fioc & Rocca-Volmerange, 1997) version 2 with Salpeter IMF, various metallicities and star-formation histories. Dust attenuation has been applied to the model SEDs assuming the attenuation curve determined by Reddy et al. (2015). After finding the best-fit value for stellar populations, attenuation for the ISM emission lines has been estimated using an empirical relation between the specific star-formation rates and the difference between the gas and continuum colour excesses proposed by Reddy et al. (2015). Then the optical line fluxes are corrected for dust attenuation using the attenuation curve by Cardelli et al. (1989) to derive O32 and R23. For comparison, we also show the distribution of SDSS star-forming galaxies in the plot. The locations of the two LyC candidate SFGs in this study are within the range of the SFGs without LyC detection. This is in contrast with the high O32 value (12.4) of Ion2 (de Barros et al., 2016) which is similar to the values of (LyC and non-LyC) LAEs.
| Designationb | R.A. | Decl. | Redshift | [Oii]c | H | [Oiii]c | O32e | R23e | |||
|---|---|---|---|---|---|---|---|---|---|---|---|
| (J2000) | 3727 | 4959 | 5007 | ||||||||
| 021 | R06-D23 | 189.08048 | 62.25039 | 3.123 | 0.24 | ||||||
| 071 | S03-M35 | 189.18839 | 62.28120 | 3.235 | 1.87 | 0.27 | 7.42 | ||||
| 100 | S03-M25 | 189.21167 | 62.24569 | 3.112 | 1.56 | 0.03 | 11.46 | ||||
| 130 | HPS447 | 189.24792 | 62.22806 | 3.129 | 1.04 | 0.08 | 4.76 | 3.23 | |||
| 136 | S03-M23 | 189.26126 | 62.24054 | 3.217 | 1.93 | 0.46 | 6.35 | ||||
| 146 | R06-C40 | 189.27579 | 62.25272 | 3.240 | 0.83 | 0.18 | 7.46 | ||||
| 284 | MOSDEF 06336 | 189.27660 | 62.17246 | 3.412 | 0.24 | ||||||
Notes. a: Measurements for object 284 (MOSDEF 06336) are done using spectra taken by MOSDEF. The other values are from our MOIRCS spectroscopy. b: Origin of the sample galaxies: 021,071,100,136,146: Reddy et al. (2006), 130: Adams et al. (2011), 284: Kriek et al. (2015). c: Line fluxes are in units of 10-17 erg s-1 cm-2. Dust attenuation is not corrected. For undetected emission lines, upper limits are given. d: Dust attenuation estimated by SED fitting (see text for details). e: O32 and R23 indices are corrected for dust attenuation using the value from the SED fitting.
4.5 LyC emitting AGNs
Among the 8 AGNs in our sample, two objects are detected in NB359 , namely, object 063 (MOSDEF 08780) and object 005 (B02-049) (see Figs. 5 and 6). Object 063 has a complex morphology, and with detailed optical spectroscopic observations reported by Jones et al. (2018) it was found that there is a foreground galaxy at (their GN-UVC-2). Among the remaining seven AGNs, while the absolute UV magnitude of one object is relatively bright (), the others have . The small frequency of NB359 detection (only one among six faint AGNs) is similar to the case in the SSA22 field reported in Micheva et al. (2017a), and the escape fraction of AGN is likely not to be unity (see also Grazian et al., 2018).
5 Discussion
5.1 Probabilities of foreground contamination
We estimate the number of possible contamination by chance overlap of foreground sources in a similar way to one of the methods tested in Micheva et al. (2017b). We randomly place N number of diameter apertures on the NB359 image. For SFGs N is 103, and the locations of the random apertures are confined to the HST ACS GOODS-N region, reflecting the distribution of actual SFG sample galaxies. For LAEs N is 157, and the entire Suprime-Cam image area (where both NB359 and NB497 images are available) is used. We count the number of apertures with 3 values in the NB359 image. We repeat this procedure 10,000 times. In Fig. 16 the distribution of the number of apertures with 3 flux densities, as well as its cumulative distribution, is plotted for SFGs and LAEs. When placing random apertures, we do not avoid the positions of objects detected in other bands, and therefore these numbers would give conservative estimates of the number of foreground contaminations in our sample, likely to be an upper limit of the number of possible contaminations.
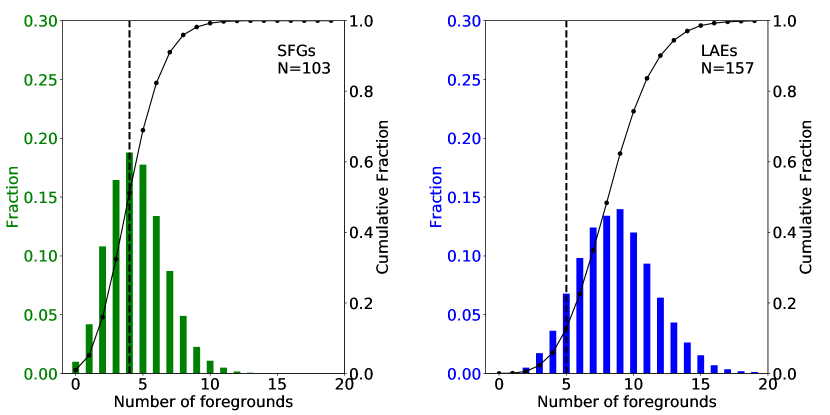
Among the 103 sample SFGs, there are four objects with 3 signal in NB359 in a diameter aperture. One is affected by a nearby bright source and another is shown to be contaminated by a foreground source via the examination of its spectrum (Section 3.1). In our contamination simulation, the probability of having 3 foreground contaminations is 32.4%, and the probability of 4 foreground contaminations is 67.6%. Therefore, statistically there is reasonable probability that the remaining two LyC candidates in our SFG sample are also affected by foreground sources. Similarly, for LAEs there are 5 objects with 3 signal in a diameter aperture, and the simulation shows that the probability of having 4 foreground contaminations among 157 sample galaxies is 6.0% (i.e., the probability of having 5 or more foreground contamination is 94%).
Another way to estimate probabilities of foreground contamination is to use -band number counts (Vanzella et al., 2010a; Micheva et al., 2017b). Using the -band number counts based on the results by Nonino et al. (2009) given in Table 1 of Vanzella et al. (2010a), the number density of objects in the magnitude range of our NB359 detected sources (between 25.5 and 27.1 AB magnitudes) is 190,800 deg-2. If we use aperture radius as a threshold for a chance overlap, and assume a random distribution of objects, the probability to have an overlap for an individual object is 4.6%. For SFGs, the probability to have four or more cases of foreground contamination among 103 sample galaxies is 70.7%. For LAEs, the probability to have five or more cases of foreground contamination among 157 sample galaxies is 85.6%. However, if we choose as a threshold for a chance overlap, which may be more appropriate considering the small spatial offsets for most of our candidates between the positions in NB359 and those in rest-frame non-ionizing UV images (Table 3), the probability of four or more cases of foreground contamination among 103 SFGs is reduced to 3.2% and the probability of five or more cases of foreground contamination among 157 LAE candidates is 3.7%. The probabilities in these simulations are sensitive to settings such as the aperture size and the assumed number density, and our estimates of the probability that all of our NB359 detected sources are contaminated by foreground sources are different for the different types of simulations. However, with these simulations, statistically we cannot rule out the possibility that all detections in NB359 in the GOODS-N are affected by foreground sources and there is no genuine LyC emitting galaxy in the sample.
In Micheva et al. (2017b) it was argued that based on a similar simulation using the actual NB359 image in the SSA22 field, the number of detections (21 among 159 LAEs) is difficult to explain solely by foreground contamination. Such a different argument comes from the fact that there appears to be a larger frequency of NB359 detections in the SSA22 field. We discuss the differences in LyC emission between the GOODS-N and SSA22 galaxies in the next section.
5.2 Comparison with the SSA22 field
Because we have obtained Suprime-Cam images for the SSA22 field using the same NB359 filter, it is possible to compare LyC emitting properties of galaxies of the field with those in the GOODS-N field, to examine if there are any differences in such properties depending on the environment. In the SSA22 field we have two types of sample galaxies. One is LAEs selected with Suprime-Cam NB497 imaging and the other is LBGs with the drop-out selection using broad-band filter colours. Because the selection methods of galaxies categorized as the star-forming galaxies (SFGs) in the GOODS-N are not necessarily restricted to the drop-out method, we have referred to this sample as SFGs. However, the SFGs in the GOODS-N studied in this paper are broadly similar to LBGs. While the -band magnitude range of the GOODS-N SFGs is fainter than that of the SSA22 LBGs (Fig. 18), their rest-frame UV colour distributions are almost identical.
As explained in Section 3.1, the selection procedure we adopted in this paper is different from those in Iwata et al. (2009) and Micheva et al. (2017b). In order to make a fair comparison, we constructed samples of LAEs and LBGs in the SSA22 field with the same procedure as for the GOODS-N sample galaxies; i.e., selecting sources with 3 detection in a diameter aperture in NB359 at the positions in R-band (for LBGs) and NB497 (for LAEs). Here we use only those galaxies in the SSA22 field that have spectroscopic redshifts. We incorporated new spectroscopic redshifts from the SSA22 field Hi Tomography Survey (Mawatari et al., in prep.), which is based on optical spectroscopy with Keck / DEIMOS and compiles spectroscopic observations in the field. The resulting numbers of sample galaxies in the SSA22 field are 121 LBGs at and 209 NB497 -selected LAEs. There are 9 LBGs and 9 LAEs with 3 NB359 signal at the position of non-ionizing UV emission detections (for LBGs) or at the position of NB497 detections (for LAEs). Among them, the number of sources known to be contaminated by foreground sources through follow-up spectroscopy are 2 for LBGs and 4 for LAEs, respectively.
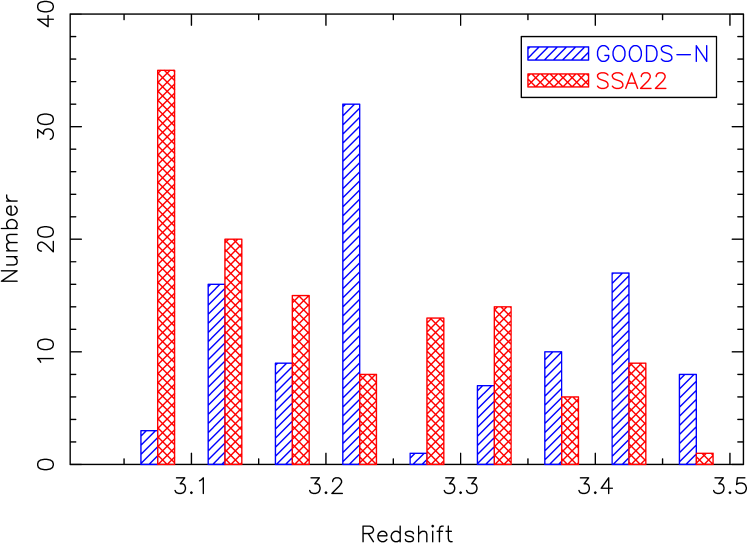
When we compare the LyC emission from SFGs/LBGs in these two fields, attention should be paid to the difference in redshift distribution. The average IGM opacity against LyC rapidly increases at (see Fig. 2), and a difference in the redshift distribution could significantly modulate the observed LyC flux density. As shown in Fig. 3 and 17, the distribution of SFGs in the GOODS-N peaks at while many LBGs in the SSA22 are around where the protocluster exists. For LAEs we use the same NB497 filter for selection of galaxies having strong emission around and they should reside within a narrow redshift range of in both fields.
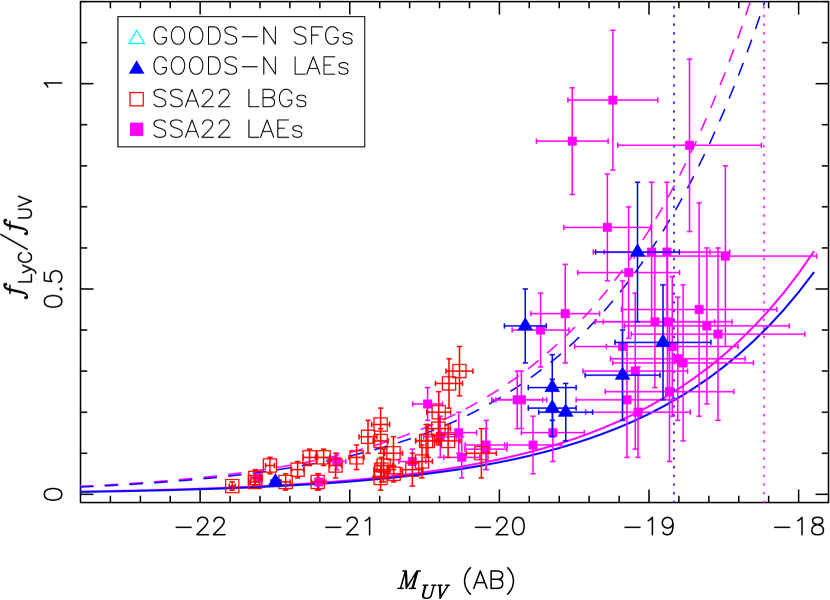
In Fig. 18 we show the absolute UV magnitudes, derived from apparent magnitudes in (for the GOODS-N) or -band (for the SSA22), and the ratios (flux ratios between NB359 and -bands)444In the GOODS-N we have an -band (effective Å) image, while in the SSA22 we have an image with -band (effective Å). Here we refer to both filters as ‘-band’ and do not distinguish them, because it is expected that for our sample of star-forming galaxies, the rest-frame UV SED is close to flat in and the flux densities in and will be comparable. for the sample galaxies in the two fields, including LAEs and LBGs / SFGs. Here we plot all galaxies with a NB359 flux density measurement having more than significance in a diameter aperture, and detected at the 3 level in the -band. The objects known to be contaminated by foreground sources, as well as two LAEs (LAE 053 and 137) in the GOODS-N likely contaminated by a foreground source (see Section 3.1), are removed from the plot.
We see that more galaxies have larger values among the objects fainter in , although the errors become larger in fainter objects. We should also note that a fainter UV magnitude boosts for objects with the same LyC flux density. With these caveats in mind, this plot would suggest that the galaxies with large are only seen in the fainter UV magnitude range, in both a protocluster region and in a general field at .
It is also seen from the figure that the number of points in this plot from the galaxies in the SSA22 are more abundant than those in the GOODS-N field. The number of sample galaxies is different: in the GOODS-N, the numbers of SFGs and LAEs are 103 and 158, respectively, while for the SSA22, the numbers of LBGs and LAEs are 121 and 209, respectively. If we consider subsamples with the same limit in (which is a limit for the GOODS-N, with the corresponding limit of 27.35 in the SSA22 -band), the number of sample galaxies are 91 SFGs and 46 LAEs in the GOODS-N, and 116 LBGs and 112 LAEs in the SSA22. The numbers of 3 detections with a diameter aperture in NB359 are 2 SFGs (2.2%) and 1 LAE (2.2%) in the GOODS-N, while in the SSA22 they are 7 LBGs (6.0%) and 5 LAEs (4.5%). In Table 7 we summarize these numbers, as well as the numbers of 2 detections. The frequencies in the SSA22 field are always higher than those in the GOODS-N field, although the number of significant LyC signal detections are small for both fields. Also, although the objects known to be contaminated by foreground objects are eliminated, from statistics discussed in Section 5.1, we expect that there are still objects contaminated by foreground objects (i.e., cases where NB359 flux measurement does not represent LyC at ) in the plot.
| GOODS-N | SSA22 | ||||
| SFGs | LAEs | LBGs | LAEs | ||
| 91 | 45 | 116 | 112 | ||
| 2 (2.2%) | 1 (2.2%) | 7 (6.0%) | 5 (4.5%) | ||
| 5 (5.5%) | 3 (6.5%) | 13 (11.2%) | 12 (10.7%) | ||
Note: a: Thresholds in -band and NB359 are common to the both fields; i.e., for -band a shallower limiting magnitude for the GOODS is used, and for NB359 the adopted value comes from that for the SSA22 which is shallower than the image in the GOODS-N. b: The numbers of 3 or 2 detections in the sample galaxies.
To further illustrate a possible difference between the frequency of LyC emitting galaxies in the GOODS-N and the SSA22 fields, in Fig. 19 the cumulative distributions of LyC flux densities and LyC-to-UV flux ratios for LAEs (with -band magnitudes brighter than 26.74) are presented. In this Figure, the fractions among the sample LAEs with (left) or (right) smaller than a specific value are plotted for both the GOODS-N and the SSA22 fields. Here we restrict the sample to LAEs only, because for SFGs/LBGs it is difficult to evaluate the effect of the IGM attenuation due to differences in the redshift distribution of the samples. With both and diameter aperture measurements, the frequency of LyC emitting LAEs appears to be higher in the SSA22 than in the GOODS-N. Note, however, that although the objects with spectroscopically confirmed and likely foreground contamination have been removed, unknown instances of foreground contamination still remaining among the sample galaxies could affect these plots.
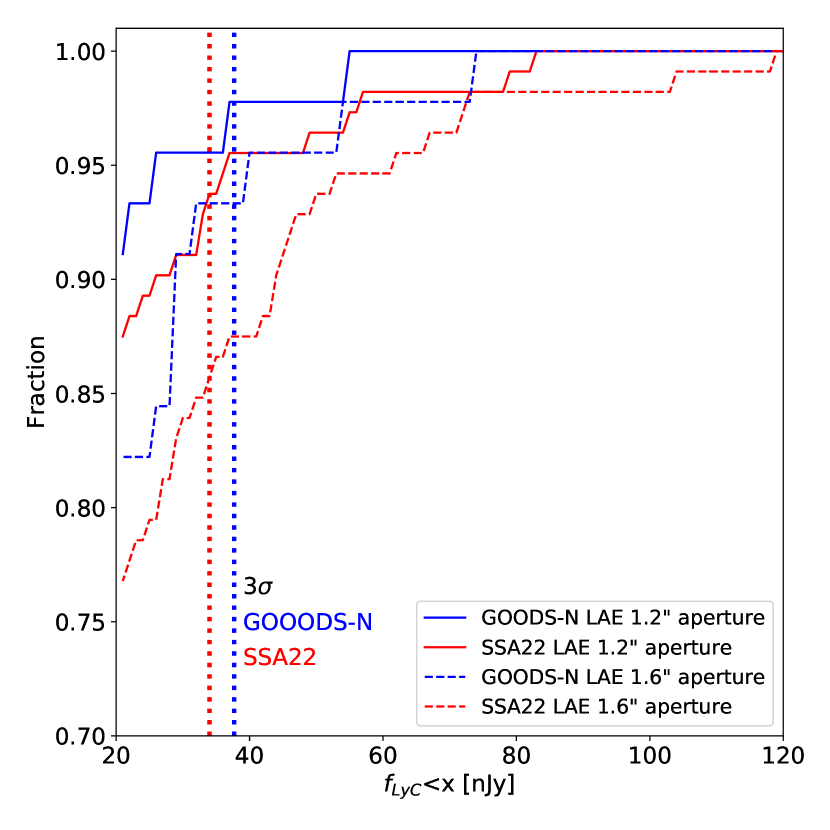
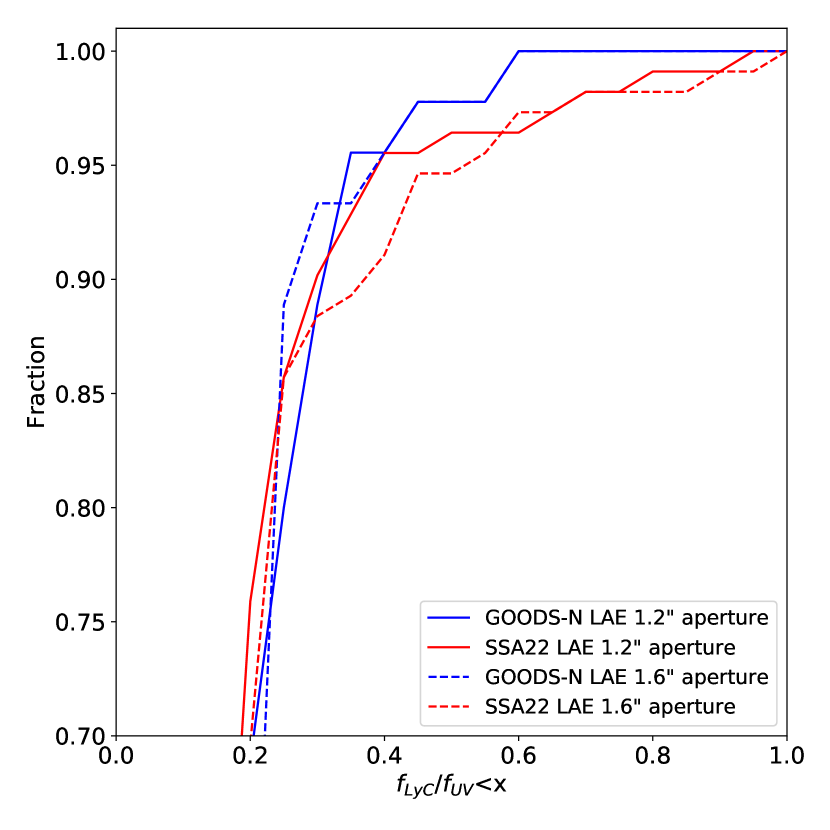
Because of the limited sensitivities in the LyC measurement and the small number of detections with significant LyC emission, any further argument on the reality of a difference in frequency of strong LyC emitting galaxies with these data cannot be made. However, these comparisons suggest an interesting trend that the protocluster field (SSA22) may contain a larger fraction of galaxies with LyC escape. At least we can say that with the current data there is no indication that the fraction of strong LyC emitting galaxies in a general field (GOODS-N) is larger than in a protocluster field (SSA22). This is counter-intuitive, because there is some observational evidence that the amount of neutral gas in the SSA22 inter-galactic space is enhanced compared to the cosmic average (e.g., Mawatari et al., 2017), and one may expect that the frequency of LyC detections would therefore be suppressed in protocluster fields. To examine the significance of the difference in frequency of strong LyC emission between galaxies in protocluster fields and those in general fields, we require better sensitivity for LyC toward multiple protoclusters around –4, as well as a larger survey area for general fields.
5.3 Constraints on LyC escape fraction and LyC emissivity
5.3.1 LyC escape fraction
We can put constraints on the average LyC emissivity by a stacking analysis. First we did analyses with SFGs and LAEs in the GOODS-N field. Because there is a statistically non-negligible possibility that all of our sample galaxies detected in NB359 are contaminated by foreground objects (Section 5.1), in order to obtain conservative constraints on we eliminated from the stacking all objects with 3 detection in NB359 , as well as objects affected by nearby bright sources. The remaining galaxies are 99 SFGs and 151 LAEs. We generated a calibrated NB359 image, masking all objects detected in -band other than the sample galaxies. From this image, 1010 areas centred at each object’s position in the -band (for SFGs) or in NB497 (for LAEs) are extracted. Then we normalized each cutout by the diameter flux density of the object in the -band555The 3 upper limit value is used when the object’s aperture flux density is less than the value. There is no SFG with an -band flux density lower than the limit, and the upper-limit was adopted for 65 LAEs (43%)., and stacked the images to get the average value of each pixel. The diameter aperture value of this stacked image gives the averaged of the sample. The errors in the stacking analysis are estimated by doing the same procedure with random “sky” positions in the NB359 image. In order to take the effect of foreground source contamination into account, the number of extracted positions is set to be the size of the entire sample including foreground contaminations (i.e., for SFGs and for LAEs). Images with 3 signal in NB359 are excluded from stacking. This stacking with random positions is repeated 1000 times to get the standard deviation as the 1 error of . The measured values for the stacked images of the 99 SFGs and the 151 LAEs both have less than errors, which means that the errors in give the upper limits for the sample galaxies in the GOODS-N field. We also tried stacking analyses using sub-samples, such as galaxies with high / low non-ionizing UV luminosities and LAEs with large Ly EWs. None of the stacked images of such sub-samples showed a significant signal in .
Although the frequency of galaxies with high LyC escape could be different by environment as discussed in the previous section, the number of sample galaxies can be increased by adding the sample galaxies from the SSA22 field. We selected the galaxies (SFGs/LBGs and LAEs) with redshift from the sample in the GOODS-N and SSA22 fields. By narrowing the redshift range, we can apply the average value of IGM attenuation at the redshift for the ensemble of the galaxies. There are 9 SFGs in the GOODS-N and 51 LBGs in the SSA22 with in addition to 151 (200) LAEs in the GOODS-N (SSA22). By combining all of these galaxies, we obtain the stacked image of 411 galaxies. Measurement with a diameter aperture gives which is times the error estimated by placing random apertures on the images. If we restrict the sample to those with 3 detection in the -band (using the same limiting magnitude with diameter aperture for both fields), the number of the sample galaxies is 215. The stacking of these galaxies does not give significant signal (), and from the random aperture sampling we estimate that the upper limit is . In Table 8 the constraints on are summarized.
The relative and absolute escape fractions of LyC are defined as (Inoue et al., 2005):
| (2) |
and
| (3) |
where and are the intrinsic luminosity densities of LyC and non-ionizing UV photons generated in the star-forming regions of a galaxy, respectively, and and are the LyC and UV luminosity densities escaping out from the galaxy. The ratio of observed flux densities is modulated from by absorption of LyC photons by intervening Hi clouds in the (circum and) inter-galactic space. Determining directly from observation is practically impossible for distant galaxies, and we need to use an estimated value from e.g., population synthesis models. Predicted values could greatly vary, depending on various factors such as the stellar evolution models, initial mass function, and age of the stellar populations. Here we use as a fiducial value, which is close to that adopted by previous studies on galaxies (e.g., Iwata et al., 2009; Steidel et al., 2018). For the dust attenuation of non-ionizing UV photons within galaxies, we adopt an average value of , which is derived by Micheva et al. (2017b) for LAEs in the SSA22 from the observed colours. The distribution of colours of the galaxies in the GOODS-N field are very similar to that of the galaxies in the SSA22 field.
The mean IGM transmission from the analytic formula by Inoue et al. (2014) is at with the NB359 filter. If we use the IGM+CGM transmission model for the wavelength range Å by Steidel et al. (2018), it is 0.352. Table 8 summarizes the constraints on and using the mean IGM value at with the Inoue et al. (2014) model and those on using the IGM+CGM model by Steidel et al. (2018). Note that the NB359 filter traces the wavelength range Å for a source at , and the IGM+CGM model by Steidel et al. (2018) would actually predict slightly smaller value for the NB359 filter than 0.352 which is used in Table 8. The IGM-only model in Steidel et al. (2018), which should be similar to the analytic model by Inoue et al. (2014), gives the IGM transmission for the wavelength range Å to be 0.435, which is slightly larger than the value 0.406 for the NB359 filter with the Inoue et al. (2014) model.
| Sample populations | Number | () | () | () | () |
|---|---|---|---|---|---|
| GOODS-N SFGs () | 99 | – | – | – | |
| GOODS-N LAEs | 151 | ||||
| SSA22+GOODS-N | 411 | ||||
| SSA22+GOODS-N , | 215 |
These constraints based on the large sample of galaxies in the two independent fields with the same narrow-band filter give a stringent upper limit on the average LyC escape fraction of galaxies. The average escape fraction of star-forming galaxies at with ( 0.1, where of LBGs is (e.g., Sawicki & Thompson, 2006; Reddy & Steidel, 2009)) is less than 8% with a correction for attenuation by intervening Hi clouds using both the IGM model by Inoue et al. (2014) and the IGM+CGM model by Steidel et al. (2018) (bottom line of Table 8).
5.3.2 Comparison with previous studies
Although the distribution of versus the absolute UV magnitude for individual sources (Fig. 18) suggests a higher frequency of LyC escape in galaxies faint in UV magnitudes, the average escape fraction of UV-faint star-forming galaxies does not show a rise from the value for the brighter galaxies in the same redshift range; in Steidel et al. (2018) was obtained from 124 LBGs at through fitting their composite spectrum. Although the UV absolute magnitude range of their sample is , the majority of the sample has absolute magnitude , about 2 magnitudes brighter than the UV magnitude limit of the present sample.
Grazian et al. (2017) used deep -band imaging data in multiple fields to search for LyC emitting galaxies at . They stacked 69 SFGs in order to constrain the LyC escape fraction, and obtained (1). While their sample contains some UV-faint SFGs down to , most of their sample galaxies have UV luminosities similar to the brighter part of the sample galaxies in the present study, and the median absolute UV magnitude of their sample galaxies is , one magnitude brighter than the median of our sample galaxies (). Our constraints on the LyC escape fraction in fainter galaxies are broadly consistent with the results by Grazian et al. (2017). These authors discussed the UV luminosity dependence of the LyC escape fraction, but could not draw a firm conclusion due to a weaker constraint on the LyC escape fraction for UV faint galaxies compared to bright ones. The situation is the same in the present study.
Nestor et al. (2013) and Mostardi et al. (2013) used Keck / LRIS narrow-band imaging to select UV-faint LAEs in the protocluster regions at (the SSA22 field) and at , respectively, and used different narrow-band filters to examine LyC from their sample galaxies. Although their search field areas are smaller than ours, both their methods and the UV luminosity distribution of their LAE samples are similar to ours. The constraints on the LyC escape fraction are 10%–30% in Nestor et al. (2013), based on 91 LAEs, and 5%–15% in Mostardi et al. (2013), based on 91 LAEs. Our results are consistent with their upper limits.
5.3.3 A constraint on the LyC emissivity
We can calculate an upper limit of the contribution of SFGs to the volume-averaged ionizing radiation emissivity, by integrating the LyC luminosity over a range of UV luminosities:
| (4) |
where is the non-ionizing UV luminosity and is the number density of the galaxies in the luminosity range (luminosity function). From the stacking analysis of the sample galaxies with and (Table 8) and the mean IGM transmission at (0.406 from Inoue et al. (2014)), we adopt the 3 upper limit of . (If we use the IGM+CGM model by Steidel et al. (2018) instead of the IGM model by Inoue et al. (2014) the upper limit is 0.10, a factor of 1.15 higher.) Using the UV luminosity function of LBGs by Reddy & Steidel (2009), from Equation 4 we obtain erg s-1 Hz-1 Mpc-3 as the 3 upper limit on the ionizing emissivity from galaxies with . For comparison, Becker & Bolton (2013) inferred at from QSO Ly forest observations, and their estimate is erg s-1 Hz-1 Mpc-3 at . Our upper limit on the contribution to the ionizing radiation emissivity by SFGs (including UV-faint LAEs) does not exclude the possibility that SFGs are the dominant source of the volume-averaged ionizing radiation at , and is consistent with previous studies (e.g., Nestor et al., 2013; Steidel et al., 2018).
Current constraints from the UV luminosity function of SFGs at require that 10% (e.g., Bouwens et al., 2016). If star-forming galaxies at have similar low LyC escape fraction, it may be difficult to attribute to star-forming galaxies all the ionizing photons responsible for cosmic reionization. We may need either a change in the physical properties of typical star-forming regions in galaxies to enhance LyC escape from to (e.g., Nakajima et al., 2016) or a major contribution from other sources of ionizing radiation such as AGNs or populations not yet observed at .
6 Conclusions
We conducted a narrow-band imaging search for LyC emission among GOODS-N field galaxies at . Our main findings are summarized as follows:
-
•
Among 103 star-forming galaxies (SFGs) at we found two candidates of LyC emitting galaxies. One of them has a peculiar spectral energy distribution, and there is a possibility of contamination by an unresolved foreground source. Near-infrared spectroscopy of the other candidate indicates a moderately elevated [Oiii]/[Oii] ratio, which is within the range of other LyC emitting galaxies.
-
•
Among 157 LAE candidates, there are five detections in NB359 , and three among them are possibly contaminated by foreground sources.
-
•
Statistically we cannot rule out a possibility that all of the galaxies detection in NB359 are contaminated by foreground sources.
-
•
A comparison between the frequency of LyC flux and LyC-to-UV flux ratios in the GOODS-N and the SSA22 field sample galaxies suggests that there is no enhancement of LyC escape in the general field compared to the protocluster field at .
-
•
By combining the sample galaxies in the GOODS-N and the SSA22 fields, we put a stringent upper limit 8% (3) on the LyC escape fraction of the galaxies.
In order to further explore LyC from high-redshift galaxies via direct observations, more sensitive observations with wider survey areas are needed, which would yield larger number of individual LyC emitting galaxy candidates, put more stringent constraints on the average LyC escape fraction, and enable us to investigate any differences depending on the galaxy environments. The on-going strategic survey with Subaru / Hyper Suprime-Cam (Aihara et al., 2018), the associated narrow-band survey CHORUS (Inoue et al. in prep.) and the -band survey with CFHT CLAUDS (Sawicki et al. in prep.) will provide such opportunities.
Acknowledgments
The authors thank staff members of the Subaru Telescope and the Subaru Mitaka Office for their support, and the anonymous referee for careful reading of the manuscript and constructive suggestions. II acknowledges Dr. Naveen Reddy and the MOSDEF team for providing near-infrared spectra of an object used in this study. He also thanks Dr. Chuck Steidel for providing us with a Keck/LRIS spectrum of a galaxy, and Dr. Marcin Sawicki for arranging a comfortable work environment for him during the analyses of the present research.
This work was supported by JSPS KAKENHI Grant Numbers 18740114, 24244018, and 17H0114.
Some of the archived data collected at the Subaru Telescope are obtained from SMOKA, which is operated by the Astronomy Data Center, National Astronomical Observatory of Japan, and STARS (Subaru Telescope Archive System) operated by the Subaru Telescope. Some of the data presented in this paper were obtained from the Mikulski Archive for Space Telescopes (MAST). STScI is operated by the Association of Universities for Research in Astronomy, Inc., under NASA contract NAS5-26555. This research partly uses the database of the Sloan Digital Sky Survey (SDSS). Funding for the SDSS and SDSS-II has been provided by the Alfred P. Sloan Foundation, the Participating Institutions, the National Science Foundation, the U.S. Department of Energy, the National Aeronautics and Space Administration, the Japanese Monbukagakusho, the Max Planck Society, and the Higher Education Funding Council for England. The SDSS Web Site is http://www.sdss.org/.
IRAF is distributed by the National Optical Astronomy Observatories, which are operated by the Association of Universities for Research in Astronomy, Inc., under cooperative agreement with the National Science Foundation. This research made use of Astropy, a community-developed core Python package for Astronomy.
We wish to express our gratitude to the indigenous Hawaiian community for their understanding of the significant role of the summit of Maunakea in astronomical research.
References
- Adams et al. (2011) Adams J. J., et al., 2011, ApJS, 192, 5
- Aihara et al. (2018) Aihara H., et al., 2018, PASJ, 70, S4
- Alexander et al. (2003) Alexander D. M., et al., 2003, AJ, 126, 539
- Ashby et al. (2013) Ashby M. L. N., et al., 2013, ApJ, 769, 80
- Barger et al. (2002) Barger A. J., Cowie L. L., Brandt W. N., Capak P., Garmire G. P., Hornschemeier A. E., Steffen A. T., Wehner E. H., 2002, AJ, 124, 1839
- Barger et al. (2008) Barger A. J., Cowie L. L., Wang W.-H., 2008, ApJ, 689, 687
- Becker & Bolton (2013) Becker G. D., Bolton J. S., 2013, MNRAS, 436, 1023
- Bouwens et al. (2004) Bouwens R. J., Illingworth G. D., Blakeslee J. P., Broadhurst T. J., Franx M., 2004, ApJ, 611, L1
- Bouwens et al. (2016) Bouwens R. J., Smit R., Labbé I., Franx M., Caruana J., Oesch P., Stefanon M., Rasappu N., 2016, ApJ, 831, 176
- Brammer et al. (2008) Brammer G. B., van Dokkum P. G., Coppi P., 2008, ApJ, 686, 1503
- Cardelli et al. (1989) Cardelli J. A., Clayton G. C., Mathis J. S., 1989, ApJ, 345, 245
- Chen et al. (2007) Chen H.-W., Prochaska J. X., Gnedin N. Y., 2007, ApJ, 667, L125
- Cohen et al. (2000) Cohen J. G., Hogg D. W., Blandford R., Cowie L. L., Hu E., Songaila A., Shopbell P., Richberg K., 2000, ApJ, 538, 29
- Dawson et al. (2001) Dawson S., Stern D., Bunker A. J., Spinrad H., Dey A., 2001, AJ, 122, 598
- Eldridge et al. (2017) Eldridge J. J., Stanway E. R., Xiao L., McClelland L. A. S., Taylor G., Ng M., Greis S. M. L., Bray J. C., 2017, Publ. Astron. Soc. Australia, 34, e058
- Fabricius et al. (2016) Fabricius M., et al., 2016, in Proceedings of the SPIE, Volume 9908, Ground-based and Airborne Instrumentation for Astronomy VI. p. 990828, doi:10.1117/12.2231417
- Fioc & Rocca-Volmerange (1997) Fioc M., Rocca-Volmerange B., 1997, A&A, 326, 950
- Fletcher et al. (2018) Fletcher T. J., Robertson B. E., Nakajima K., Ellis R. S., Stark D. P., Inoue A., 2018, preprint, (arXiv:1806.01741)
- Fynbo et al. (2009) Fynbo J. P. U., et al., 2009, ApJS, 185, 526
- Giallongo et al. (2015) Giallongo E., et al., 2015, A&A, 578, A83
- Giavalisco et al. (2004) Giavalisco M., et al., 2004, ApJ, 600, L93
- Grazian et al. (2017) Grazian A., et al., 2017, A&A, 602, A18
- Grazian et al. (2018) Grazian A., et al., 2018, A&A, 613, A44
- Grogin et al. (2011) Grogin N. A., et al., 2011, ApJS, 197, 35
- Hornschemeier et al. (2001) Hornschemeier A. E., et al., 2001, ApJ, 554, 742
- Inoue (2010) Inoue A. K., 2010, MNRAS, 401, 1325
- Inoue & Iwata (2008) Inoue A. K., Iwata I., 2008, MNRAS, 387, 1681
- Inoue et al. (2005) Inoue A. K., Iwata I., Deharveng J.-M., Buat V., Burgarella D., 2005, A&A, 435, 471
- Inoue et al. (2011) Inoue A. K., et al., 2011, MNRAS, 411, 2336
- Inoue et al. (2014) Inoue A. K., Shimizu I., Iwata I., Tanaka M., 2014, MNRAS, 442, 1805
- Iwata et al. (2007) Iwata I., Ohta K., Tamura N., Akiyama M., Aoki K., Ando M., Kiuchi G., Sawicki M., 2007, MNRAS, 376, 1557
- Iwata et al. (2009) Iwata I., et al., 2009, ApJ, 692, 1287
- Izotov et al. (2016a) Izotov Y. I., Schaerer D., Thuan T. X., Worseck G., Guseva N. G., Orlitová I., Verhamme A., 2016a, MNRAS, 461, 3683
- Izotov et al. (2016b) Izotov Y. I., Orlitová I., Schaerer D., Thuan T. X., Verhamme A., Guseva N. G., Worseck G., 2016b, Nature, 529, 178
- Izotov et al. (2018a) Izotov Y. I., Schaerer D., Worseck G., Guseva N. G., Thuan T. X., Verhamme A., Orlitová I., Fricke K. J., 2018a, MNRAS, 474, 4514
- Izotov et al. (2018b) Izotov Y. I., Worseck G., Schaerer D., Guseva N. G., Thuan T. X., Fricke A. V., Orlitová I., 2018b, MNRAS, 478, 4851
- Jones et al. (2018) Jones L. H., Barger A. J., Cowie L. L., Oesch P., Hu E. M., Songaila A., Naidu R. P., 2018, ApJ, 862, 142
- Kajisawa et al. (2011) Kajisawa M., et al., 2011, PASJ, 63, 379
- Koekemoer et al. (2011) Koekemoer A. M., et al., 2011, ApJS, 197, 36
- Kriek et al. (2015) Kriek M., et al., 2015, ApJS, 218, 15
- Le Fèvre et al. (2015) Le Fèvre O., et al., 2015, A&A, 576, A79
- Lowenthal et al. (1997) Lowenthal J. D., et al., 1997, ApJ, 481, 673
- Marchi et al. (2018) Marchi F., et al., 2018, A&A, 614, A11
- Matsuda et al. (2009) Matsuda Y., et al., 2009, MNRAS, 400, L66
- Mawatari et al. (2017) Mawatari K., et al., 2017, MNRAS, 467, 3951
- Micheva et al. (2017a) Micheva G., Iwata I., Inoue A. K., 2017a, MNRAS, 465, 302
- Micheva et al. (2017b) Micheva G., Iwata I., Inoue A. K., Matsuda Y., Yamada T., Hayashino T., 2017b, MNRAS, 465, 316
- Miyazaki et al. (2002) Miyazaki S., et al., 2002, PASJ, 54, 833
- Momcheva et al. (2016) Momcheva I. G., et al., 2016, ApJS, 225, 27
- Mostardi et al. (2013) Mostardi R. E., Shapley A. E., Nestor D. B., Steidel C. C., Reddy N. A., Trainor R. F., 2013, ApJ, 779, 65
- Naidu et al. (2017) Naidu R. P., et al., 2017, ApJ, 847, 12
- Naidu et al. (2018) Naidu R. P., Forrest B., Oesch P. A., Tran K.-V. H., Holden B. P., 2018, MNRAS, 478, 791
- Nakajima & Ouchi (2014) Nakajima K., Ouchi M., 2014, MNRAS, 442, 900
- Nakajima et al. (2016) Nakajima K., Ellis R. S., Iwata I., Inoue A. K., Kusakabe H., Ouchi M., Robertson B. E., 2016, ApJ, 831, L9
- Nestor et al. (2011) Nestor D. B., Shapley A. E., Steidel C. C., Siana B., 2011, ApJ, 736, 18
- Nestor et al. (2013) Nestor D. B., Shapley A. E., Kornei K. A., Steidel C. C., Siana B., 2013, ApJ, 765, 47
- Nonino et al. (2009) Nonino M., et al., 2009, ApJS, 183, 244
- Oesch et al. (2009) Oesch P. A., et al., 2009, ApJ, 690, 1350
- Oesch et al. (2018) Oesch P. A., et al., 2018, ApJS, 237, 12
- Oke & Gunn (1983) Oke J. B., Gunn J. E., 1983, ApJ, 266, 713
- Ouchi et al. (2004) Ouchi M., et al., 2004, ApJ, 611, 660
- Pirzkal et al. (2013) Pirzkal N., et al., 2013, ApJ, 772, 48
- Reddy & Steidel (2009) Reddy N. A., Steidel C. C., 2009, ApJ, 692, 778
- Reddy et al. (2006) Reddy N. A., Steidel C. C., Erb D. K., Shapley A. E., Pettini M., 2006, ApJ, 653, 1004
- Reddy et al. (2015) Reddy N. A., et al., 2015, ApJ, 806, 259
- Rudie et al. (2013) Rudie G. C., Steidel C. C., Shapley A. E., Pettini M., 2013, ApJ, 769, 146
- Sawicki & Thompson (2006) Sawicki M., Thompson D., 2006, ApJ, 642, 653
- Schenker et al. (2013) Schenker M. A., Ellis R. S., Konidaris N. P., Stark D. P., 2013, ApJ, 777, 67
- Shapley et al. (2001) Shapley A. E., Steidel C. C., Adelberger K. L., Dickinson M., Giavalisco M., Pettini M., 2001, ApJ, 562, 95
- Shapley et al. (2016) Shapley A. E., Steidel C. C., Strom A. L., Bogosavljević M., Reddy N. A., Siana B., Mostardi R. E., Rudie G. C., 2016, ApJ, 826, L24
- Shen et al. (2007) Shen Y., et al., 2007, AJ, 133, 2222
- Shibuya et al. (2015) Shibuya T., Ouchi M., Harikane Y., 2015, ApJS, 219, 15
- Siana et al. (2015) Siana B., et al., 2015, ApJ, 804, 17
- Skelton et al. (2014) Skelton R. E., et al., 2014, ApJS, 214, 24
- Sobral et al. (2018) Sobral D., et al., 2018, MNRAS, 477, 2817
- Steidel et al. (1998) Steidel C. C., Adelberger K. L., Dickinson M., Giavalisco M., Pettini M., Kellogg M., 1998, ApJ, 492, 428
- Steidel et al. (2018) Steidel C. C., Bogosavljević M., Shapley A. E., Reddy N. A., Rudie G. C., Pettini M., Trainor R. F., Strom A. L., 2018, ApJ, 869, 123
- Stiavelli et al. (2004) Stiavelli M., Fall S. M., Panagia N., 2004, ApJ, 610, L1
- Suzuki et al. (2008) Suzuki R., et al., 2008, PASJ, 60, 1347
- Tanvir et al. (2018) Tanvir N. R., et al., 2018, preprint, (arXiv:1805.07318)
- U et al. (2015) U V., et al., 2015, ApJ, 815, 57
- Vanzella et al. (2010a) Vanzella E., Siana B., Cristiani S., Nonino M., 2010a, MNRAS, 404, 1672
- Vanzella et al. (2010b) Vanzella E., et al., 2010b, ApJ, 725, 1011
- Vanzella et al. (2015) Vanzella E., et al., 2015, A&A, 576, A116
- Vanzella et al. (2018) Vanzella E., et al., 2018, MNRAS, 476, L15
- Verhamme et al. (2015) Verhamme A., Orlitová I., Schaerer D., Hayes M., 2015, A&A, 578, A7
- Verhamme et al. (2017) Verhamme A., Orlitová I., Schaerer D., Izotov Y., Worseck G., Thuan T. X., Guseva N., 2017, A&A, 597, A13
- Walawender et al. (2016) Walawender J., et al., 2016, in Proceedings of the SPIE, Volume 9908, Ground-based and Airborne Instrumentation for Astronomy VI. p. 99082G, doi:10.1117/12.2231812
- Wirth et al. (2004) Wirth G. D., et al., 2004, AJ, 127, 3121
- Xue et al. (2016) Xue Y. Q., Luo B., Brandt W. N., Alexander D. M., Bauer F. E., Lehmer B. D., Yang G., 2016, ApJS, 224, 15
- Yamada et al. (2012) Yamada T., Nakamura Y., Matsuda Y., Hayashino T., Yamauchi R., Morimoto N., Kousai K., Umemura M., 2012, AJ, 143, 79
- York et al. (2000) York D. G., et al., 2000, AJ, 120, 1579
- Yoshikawa et al. (2010) Yoshikawa T., et al., 2010, ApJ, 718, 112
- Zackrisson et al. (2013) Zackrisson E., Inoue A. K., Jensen H., 2013, ApJ, 777, 39
- de Barros et al. (2016) de Barros S., et al., 2016, A&A, 585, A51