2Kavli Institute for Cosmological Physics, University of Chicago, 5640 South Ellis Avenue, Chicago, IL, 60637, USA
3Fermi National Accelerator Laboratory, MS209, P.O. Box 500, Batavia, IL, 60510, USA
4Department of Physics, University of California, Berkeley, CA, 94720, USA
5School of Physics and Astronomy, Cardiff University, Cardiff CF24 3YB, United Kingdom
6Kavli Institute for Particle Astrophysics and Cosmology, Stanford University, 452 Lomita Mall, Stanford, CA, 94305, USA
7SLAC National Accelerator Laboratory, 2575 Sand Hill Road, Menlo Park, CA, 94025, USA
8Department of Astronomy and Astrophysics, University of Chicago, 5640 South Ellis Avenue, Chicago, IL, 60637, USA
9Enrico Fermi Institute, University of Chicago, 5640 South Ellis Avenue, Chicago, IL, 60637, USA
10Department of Physics, University of Chicago, 5640 South Ellis Avenue, Chicago, IL, 60637, USA
11Department of Physics and McGill Space Institute, McGill University, 3600 Rue University, Montreal, Quebec H3A 2T8, Canada
12NIST Quantum Devices Group, 325 Broadway Mailcode 817.03, Boulder, CO, 80305, USA
13Materials Sciences Division, Argonne National Laboratory, 9700 South Cass Avenue, Argonne, IL, 60439, USA
14Canadian Institute for Advanced Research, CIFAR Program in Gravity and the Extreme Universe, Toronto, ON, M5G 1Z8, Canada
15CASA, Department of Astrophysical and Planetary Sciences, University of Colorado, Boulder, CO, 80309, USA
16Department of Physics and Astronomy, University of California, Los Angeles, CA, 90095, USA
17Department of Physics, Center for Education and Research in Cosmology and Astrophysics, Case Western Reserve University, Cleveland, OH, 44106, USA
18Department of Astronomy, University of Illinois at Urbana-Champaign, 1002 West Green Street, Urbana, IL, 61801, USA
19Harvey Mudd College, 301 Platt Boulevard., Claremont, CA, 91711, USA
20Department of Physics, University of Colorado, Boulder, CO, 80309, USA
21University of Chicago, 5640 South Ellis Avenue, Chicago, IL, 60637, USA
22Deptartment of Physics, Stanford University, 382 Via Pueblo Mall, Stanford, CA, 94305, USA
23Physics Division, Lawrence Berkeley National Laboratory, Berkeley, CA, 94720, USA
24Dunlap Institute for Astronomy & Astrophysics, University of Toronto, 50 St. George Street, Toronto, ON, M5S 3H4, Canada
25Three-Speed Logic, Inc., Vancouver, B.C., V6A 2J8, Canada
26Harvard-Smithsonian Center for Astrophysics, 60 Garden Street, Cambridge, MA, 02138, USA
27Department of Astronomy & Astrophysics, University of Toronto, 50 St. George Street, Toronto, ON, M5S 3H4, Canada
28Department of Physics, University of Illinois Urbana-Champaign, 1110 West Green Street, Urbana, IL, 61801, USA
On-sky performance of the SPT-3G frequency-domain multiplexed readout
Abstract
Frequency-domain multiplexing (fMux) is an established technique for the readout of large arrays of transition edge sensor (TES) bolometers. Each TES in a multiplexing module has a unique AC voltage bias that is selected by a resonant filter. This scheme enables the operation and readout of multiple bolometers on a single pair of wires, reducing thermal loading onto sub-Kelvin stages. The current receiver on the South Pole Telescope, SPT-3G, uses a 68x fMux system to operate its large-format camera of 16,000 TES bolometers. We present here the successful implementation and performance of the SPT-3G readout as measured on-sky. Characterization of the noise reveals a median pair-differenced 1/f knee frequency of 33 mHz, indicating that low-frequency noise in the readout will not limit SPT-3G’s measurements of sky power on large angular scales. Measurements also show that the median readout white noise level in each of the SPT-3G observing bands is below the expectation for photon noise, demonstrating that SPT-3G is operating in the photon-noise-dominated regime.
Keywords:
frequency-domain multiplexing, transition edge sensor, cosmic microwave background1 Introduction
Multiplexing readout is an enabling technology for current and future cosmic microwave background (CMB) receivers. Large arrays of superconducting detectors require multiplexing readout to reduce the number of wires that provide electrical connections to the detectors. Fewer wires dissipate less heat on the sub-Kelvin stage and reduce the complexity of the readout, which can result in lower overall cost. Several different multiplexing schemes exist including time-division multiplexing dekorte2003 (1, 2), megahertz frequency-domain multiplexing dobbs2012 (3, 4), microwave multiplexing dober2018 (5), and code-division multiplexing stiehl2012 (6). Modern CMB receivers have or are working to implement the first three schemes, each of which brings a unique set of advantages and challenges Ade_2015 (7, 8, 9, 10, 11).
The SPT-3G receiver uses frequency-domain multiplexing (fMux) to read out its focal plane of 16,000 transition-edge sensor (TES) bolometers. Installed on the South Pole Telescope in late 2016, SPT-3G is currently making deep, high-resolution maps of the CMB temperature and polarization. These data will be used to constrain structure formation in the late universe and search for the unique signature of inflation in the early universe. The successful implementation of fMux readout in SPT-3G was a key technological advancement that has enabled this large-format array to achieve background-limited performance. In this paper we present the performance of the SPT-3G fMux readout, measured during CMB survey operations. Sec. 2 describes the specific implementation of fMux in SPT-3G. Sec. 3 discusses the performance of the readout, including crosstalk and noise measurements.
2 SPT-3G Readout Implementation
A schematic representation of the SPT-3G fMux readout is shown in Fig. 1. In fMux readout, each TES is connected in series with an inductor and capacitor, creating a unique resonant bandwidth. Segments are connected in parallel, allowing a waveform consisting of summed sinusoidal voltage biases (shown as the carrier in Fig. 1) to be input and the subsequent signals read out on a single pair of wires. The filter selects the appropriate AC sinusoid from the waveform to bias the associated TES. The ability to provide individually optimized biases to every bolometer is a unique advantageous feature of fMux readout. SPT-3G combines 66 TES bolometers and 2 calibration resistors together into a single module for a total multiplexing factor of 68.
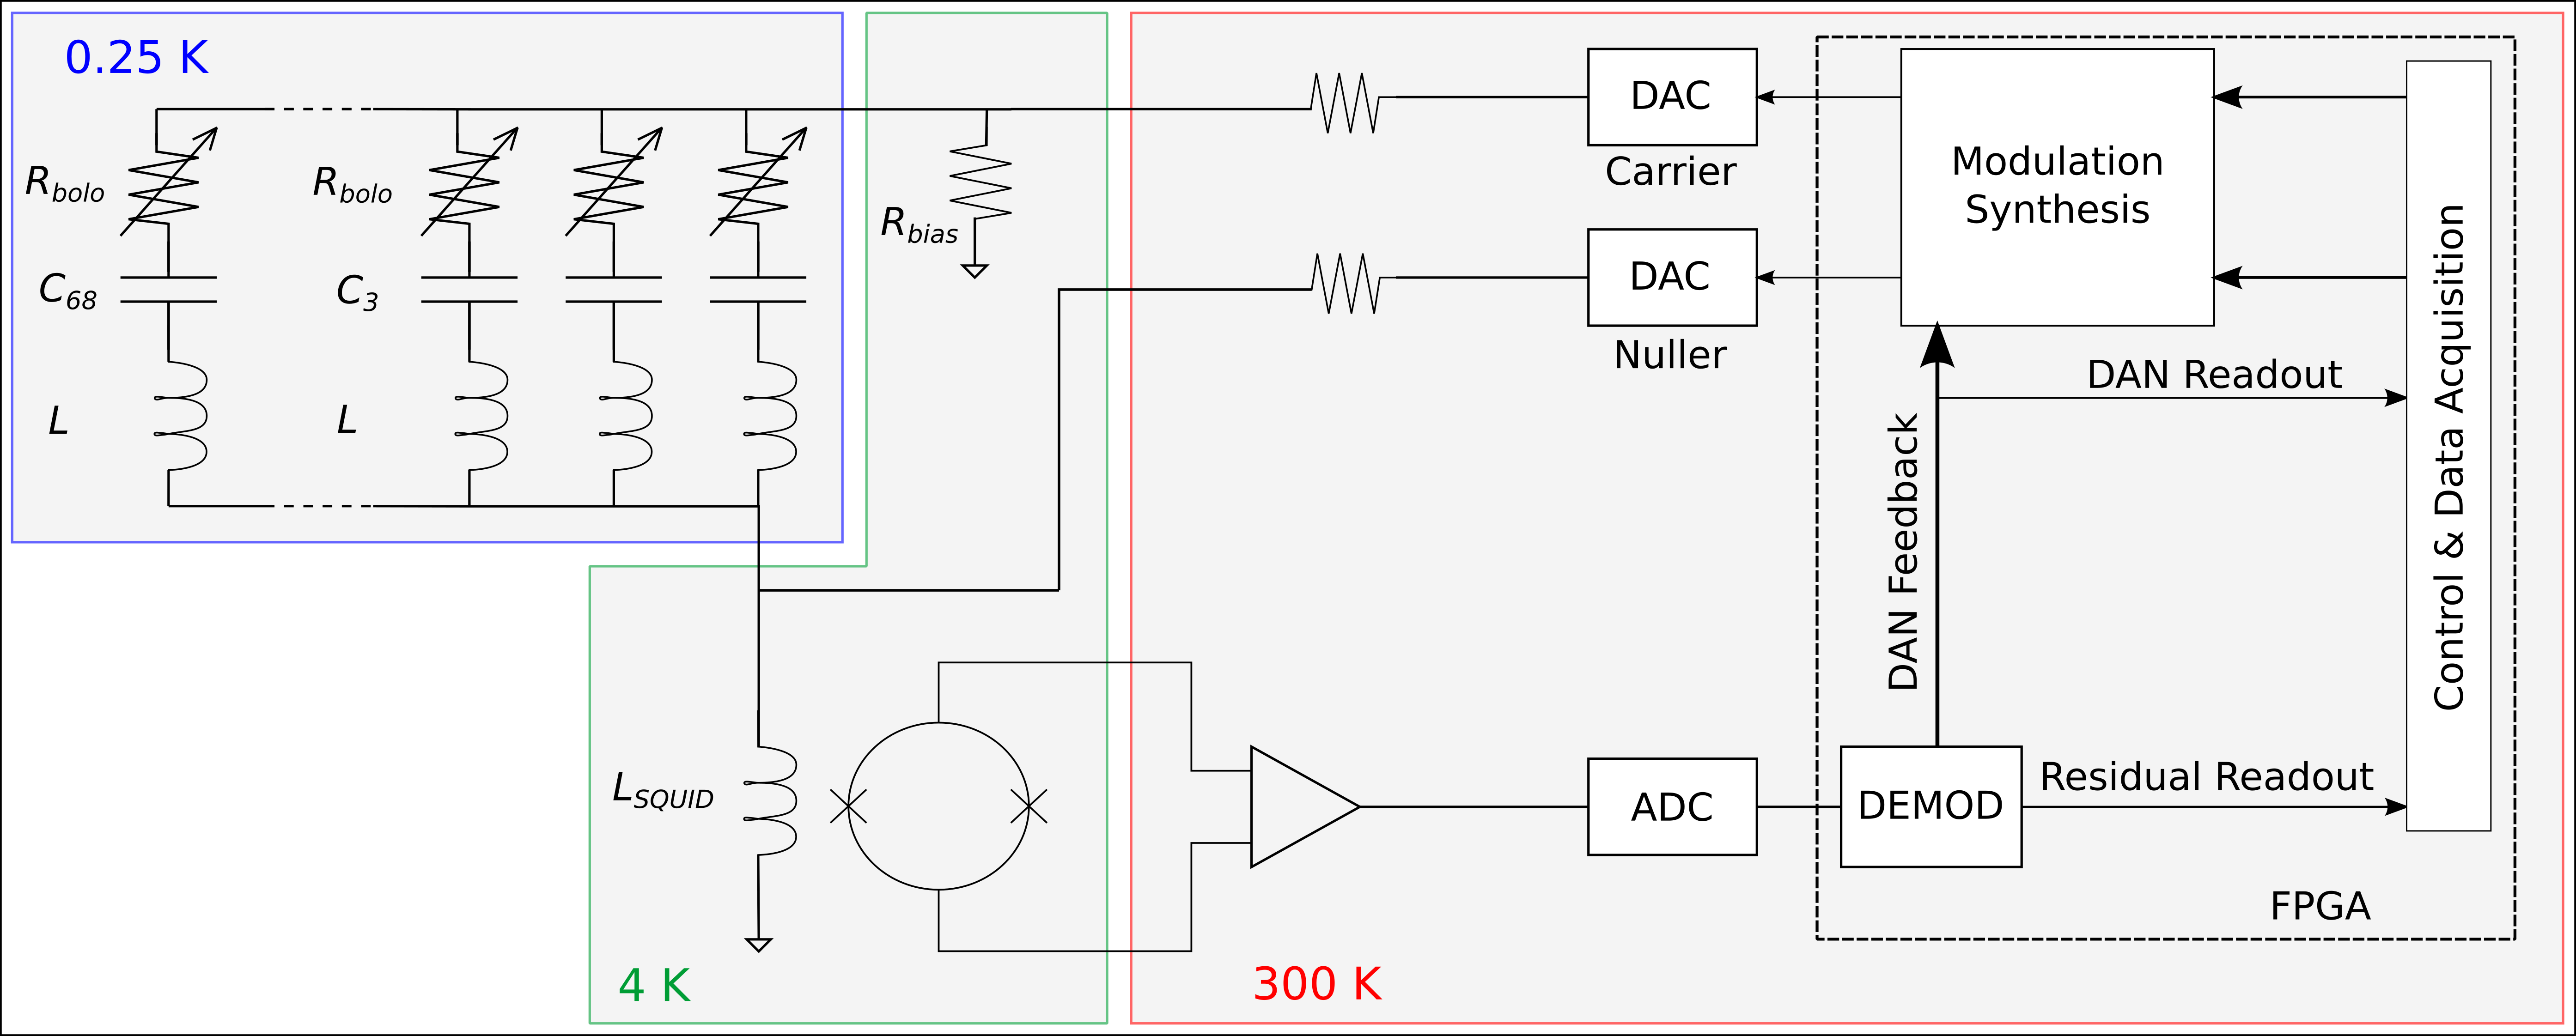
In the limit of high electro-thermal loop gain, the sum of electrical and optical power on the detector is fixed. The TES is biased with a constant amplitude voltage. Changes in optical power amplitude modulate the current flowing through the TES, encoding the signals of interest in the sidebands. The currents flowing through the TES bolometers are summed together and amplified by a superconducting quantum interference device (SQUID). After further amplification the output is digitized and demodulated.
In order to reduce the dynamic range requirement on the SQUID, a nulling current is injected into the SQUID input. The nuller removes both the AC bias waveform and provides continuously updating feedback to remove the sidebands (digital active nulling) dehaan2012 (12).
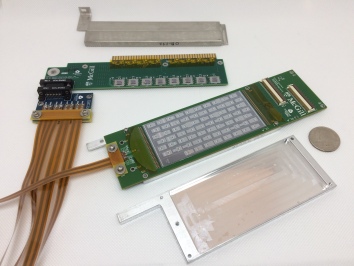
The left-hand image in Fig. 2 shows the cryogenic readout components in the SPT-3G fMux. The network for each module of 68 channels consists of a chip with pairs of superconducting inductors and capacitors that is mounted on a standard printed circuit board hattori2014 (13, 14, 15). A superconducting broadside-coupled stripline connects the assemblies to the SQUIDs, which are mounted and shielded in groups of eight on printed circuit boards avva2018 (16). The right-hand image in Fig. 2 shows the room temperature electronics. Custom FPGA boards perform the required digital signal processing (modulation, demodulation, and feedback). A second custom board operates the SQUIDs bender2014 (17, 18).
3 On-Sky Performance
3.1 Yield
The overall sensitivity of a CMB receiver scales directly with the number of optically sensitive detectors. Any readout components that are inoperable reduce the total number of useable detectors. The total number of resonant filters identified in the characterization of the SPT-3G readout combines detector and readout yield together. The detector wafers are electrically probed at room temperature prior to assembly, providing an independent estimate of detector yield. The table below presents a summary of this yield accounting. The readout yield is estimated from the number of identified resonances, accounting for detectors that measured disconnected in a room temperature probing. Loss in the readout occurs in the cryogenic components in two main ways. First, an entire module is disconnected either at the stripline connections or the chip. Current data suggests this has occurred for 2-3 out of the 240 modules within SPT-3G. Second, individual pairs are non-functional, accounting for the remainder of missing resonances.
| Wired Readout Channels | Calibration Resistors | TES with T=300K connectivity | Expected Resonances | Identified Resonances | Estimated Readout Yield |
| 16,200 | 480 | 14,712 | 15,192 | 14,260 | 94% |
3.2 Crosstalk
Electrical crosstalk from the fMux system copies sky signals from one detector into the data of another. The resulting bias on the measured CMB polarization is either a leakage of temperature signal into polarization or an incorrect polarized beam Crites_2015 (19, 20). There are three expected types of crosstalk within an fMux module dobbs2012 (3). First, there is crosstalk due to overlapping bandwidth between filters closely spaced in frequency. Second, the inductors within a module can couple via mutual inductance. Finally, the stripline wiring that connects the filter and TES network to the SQUID has an impedance. This impedance acts as a voltage divider, creating a mechanism to modulate the AC biases slightly as TES resistance responds to sky signal.
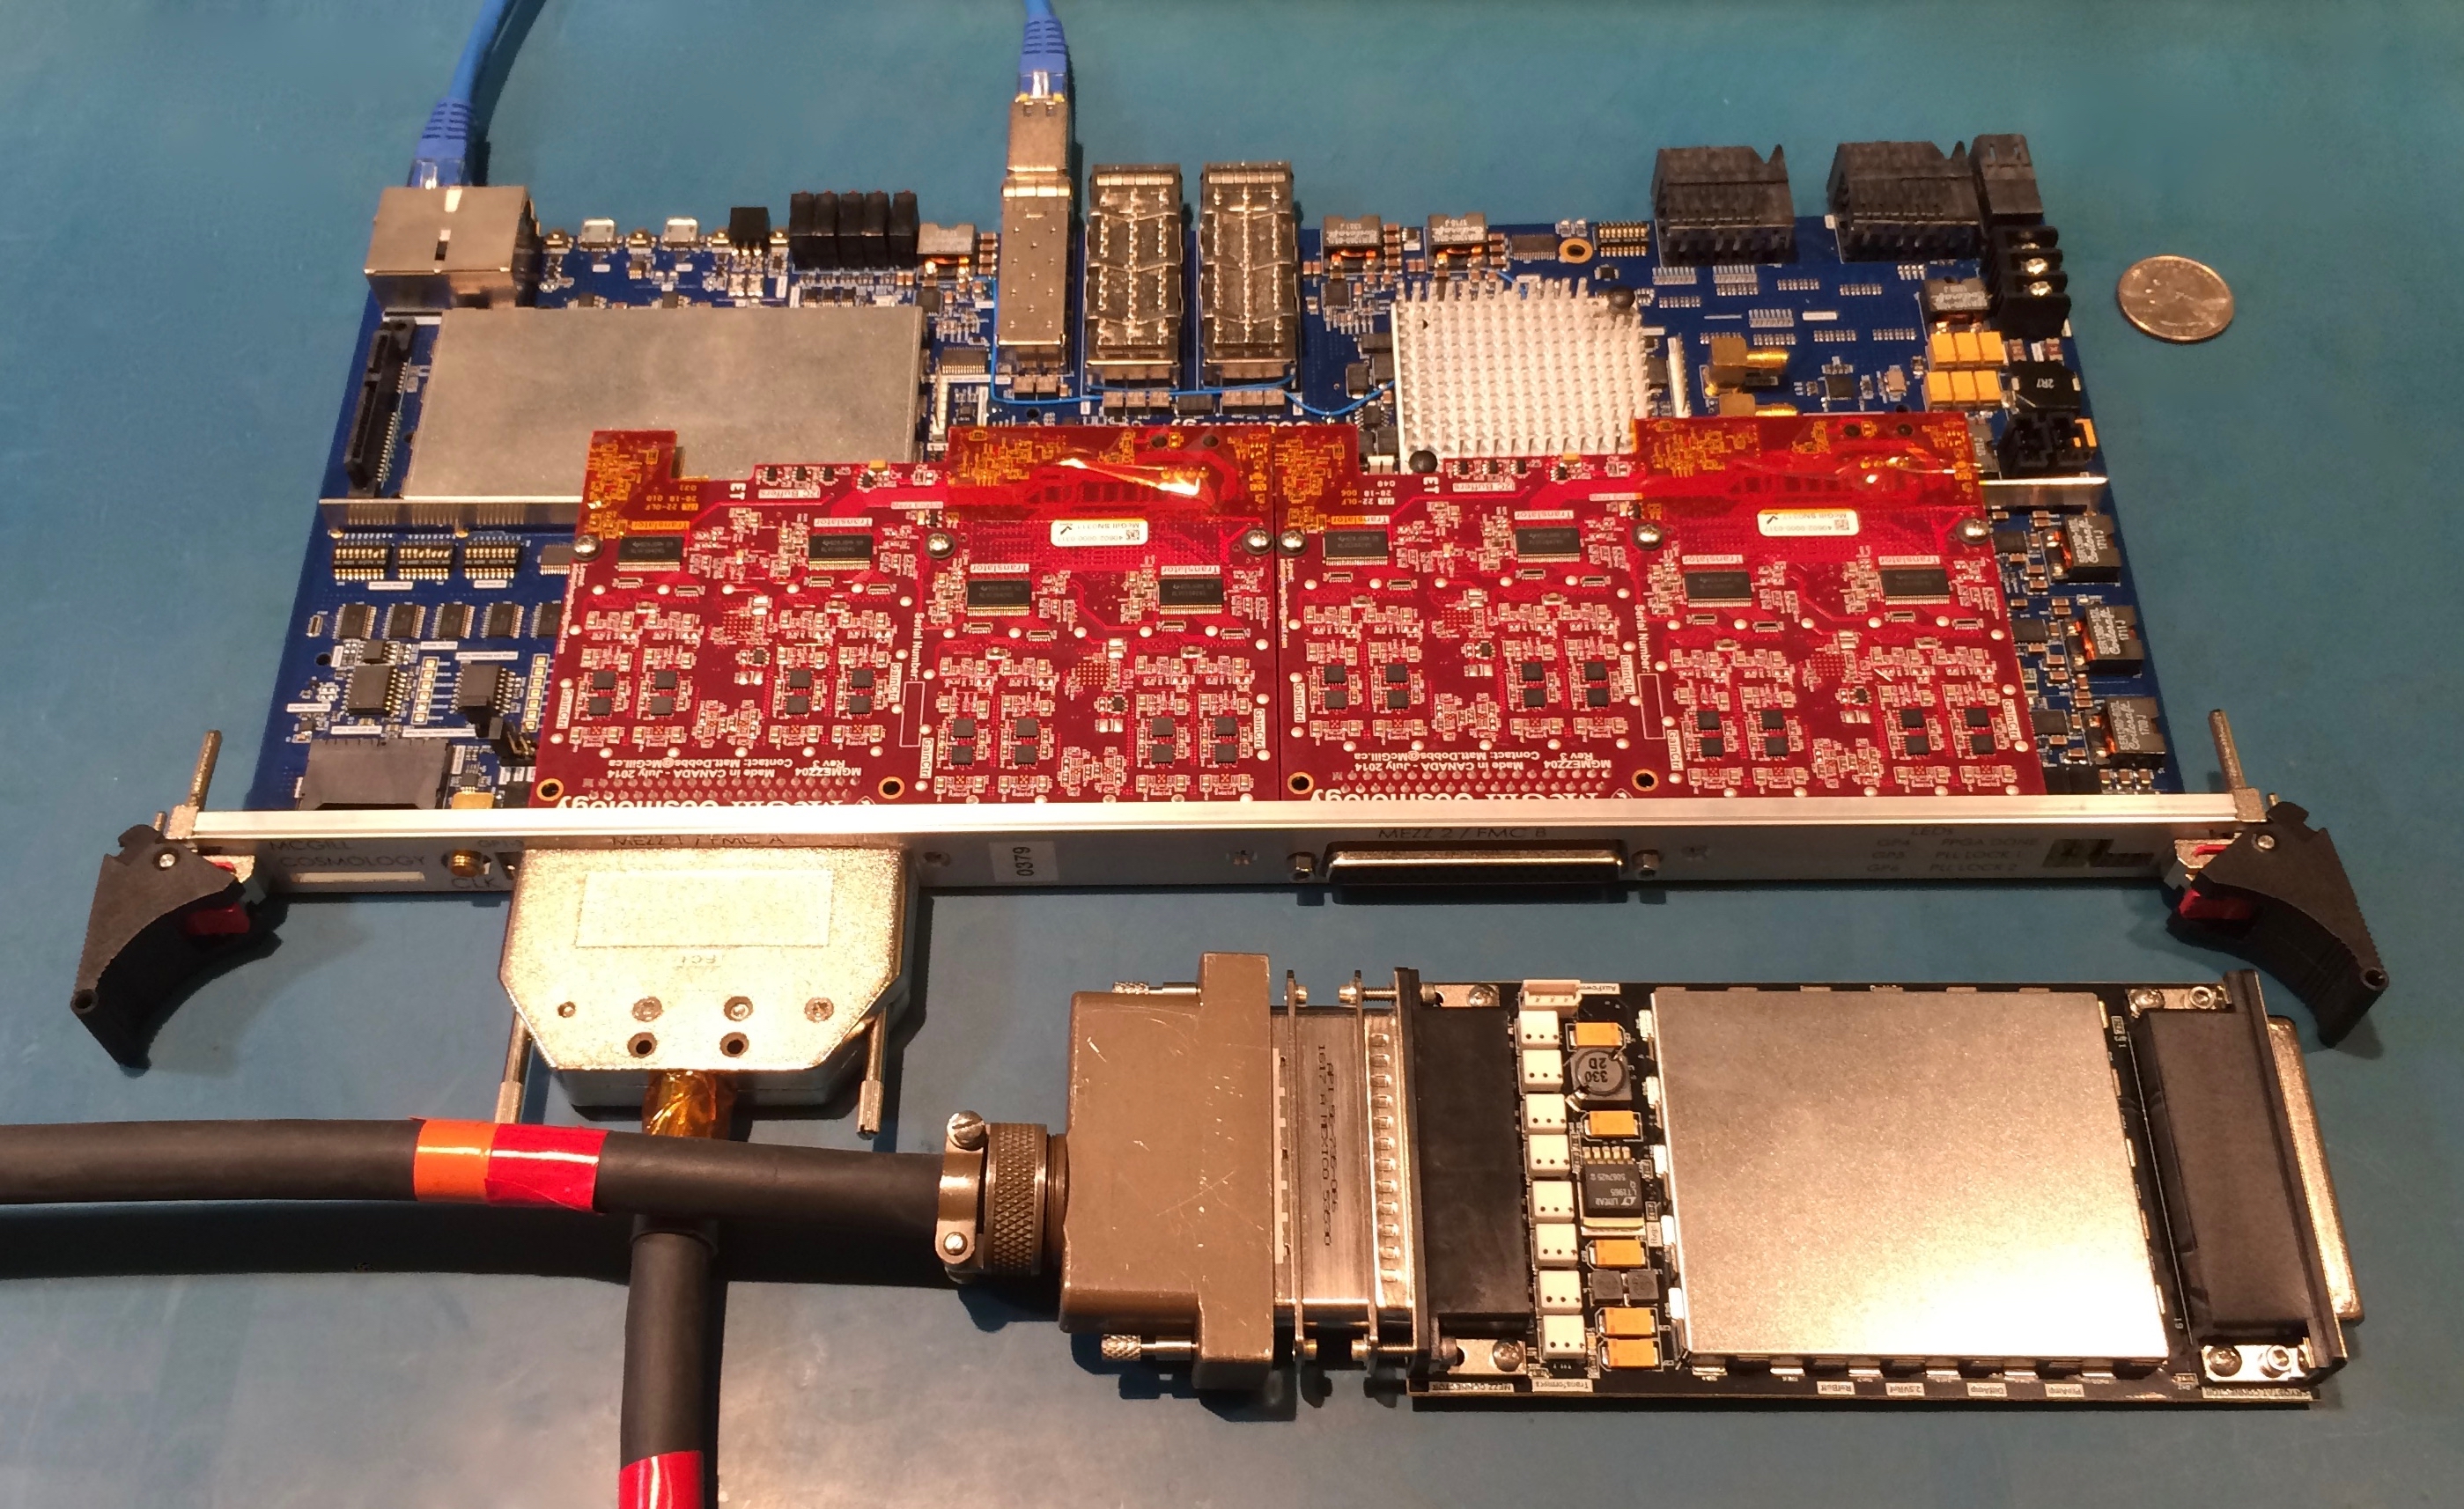
Crosstalk is measured for SPT-3G using observations of the galactic HII region RCW38. SPT-3G regularly observes RCW38 as part of its calibration scheme, raster scanning the telescope such that every detector in the focal plane sees the source. RCW38 is slightly extended compared to a true point source. Therefore, a template for the expected flux distribution is constructed from the average for all detectors within a given observing band (95/150/220 GHz) and detector wafer. A map of RCW38 is then made for each detector individually and the associated template is used to measure the flux at the expected source position (the primary signal from that detector). Flux is also measured at the known offsets for all detectors within the same readout module. The ratio of these two flux measurements quantifies the crosstalk coefficients for each detector. The procedure is also applied to a region of the map outside the source region to generate a noise expectation. Fig. 3 shows the resulting crosstalk distribution and the noise expectation.
There are several subtleties present in the crosstalk analysis. First, this technique measures the total crosstalk in SPT-3G, including any optical contribution. However, negative crosstalk coefficients can only originate in the readout. Next, this analysis is unable to separate the individual crosstalk coefficients from each of the bolometers within the same pixel. Consequently, the crosstalk coefficient is assigned to the detector with the bias frequency closest to that of the primary detector. As mentioned previously, RCW38 is slightly extended. Spatial neighbors in the focal plane often fall within the source envelope, confusing the crosstalk measurement. There is no correlation between focal plane position and relative spacing of bias frequencies in SPT-3G. Therefore, detector pairs separated by less than 20 arcminutes are excluded in this characterization of readout crosstalk. We note a small excess of positive crosstalk in Fig. 3, which could be residual from this effect or non-readout crosstalk. Finally, as described previously, crosstalk coefficients are only calculated between detectors within the same readout module. When the measurement is expanded to include wafer-level crosstalk coefficients, there is no additional crosstalk significant in comparison to the noise expectation.
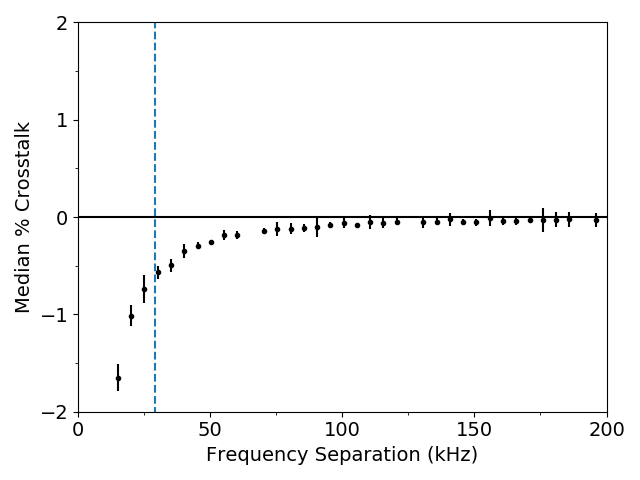
The cryogenic readout components for SPT-3G were designed to maintain crosstalk at a level of 0.5% or below, assuming zero scatter in the resonant frequencies bender2016 (15). There is a tail in the distribution of crosstalk components shown in Fig. 3 that exceeds this specification. To understand this deviation, the median crosstalk level across multiple RCW38 observations is plotted as a function of the bias frequency separation between the detectors (shown in the right-hand panel of Fig. 3). The vertical dashed line denotes the minimum frequency spacing in the design. The crosstalk coefficients in excess of 0.5% clearly correlate with bias frequencies that are closer together than designed (a result of small deviations from design in the fabricated capacitors). Future fMux systems with improved control of this frequency scatter or other design changes that mitigate the mechanisms by which crosstalk depends on bias frequency spacing will suppress this excess.
3.3 Noise
A critical metric of performance for the SPT-3G receiver is the noise. The total noise during observations is a combination of photon noise from the sky and optical elements in the receiver itself, phonon and Johnson noise intrinsic to the bolometers, and finally readout noise. To measure the readout noise, the TES bolometers are first operated into the transition with the telescope at a typical observing elevation. This strategy ensures that the bias and nuller waveforms approximate nominal levels during the noise measurement. The telescope then moves to point at the horizon, increasing the optical loading enough to saturate the bolometers and suppress the photon and phonon noise. Johnson noise will still be present at the level of pA/ for a 2 TES operating at a temperature of 315 mK, but the resulting data will be dominated by the readout noise. Data is acquired for five minutes while the telescope is held stationary (referred to as a noise stare).
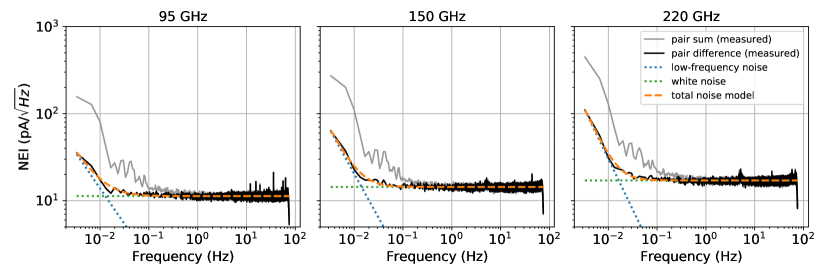
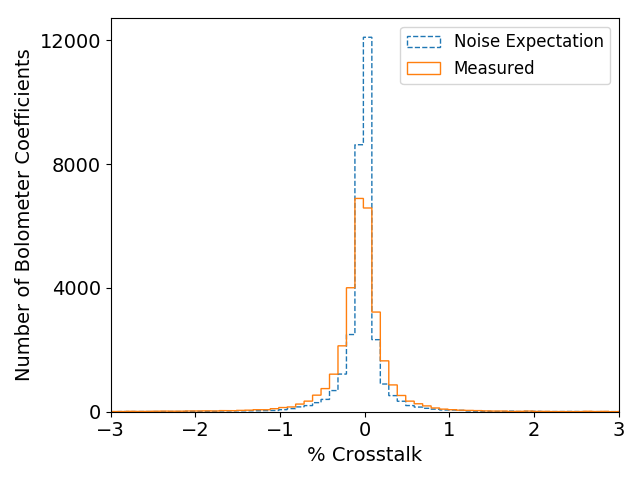
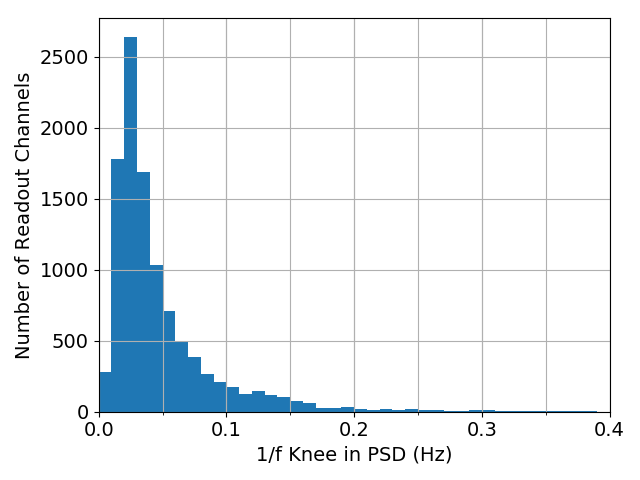
Amplitude spectral distributions (ASDs) are extracted from the noise stare by taking the sum and difference of time-ordered data (TOD) for detector pairs of the same observing band within each pixel. The TOD are initially conditioned by removing a first-order polynomial. The TOD are then gain-matched in the low-frequency region ( Hz) to remove correlated noise between the detector pairs and measure the fundamental low-frequency noise behavior. Fig. 4 shows representative pair-sum and pair-difference ASDs averaged for all detectors within an observing band on a single detector wafer in the SPT-3G focal plane. A noise model containing white noise and 1/f noise (NEI = ) is fit to the difference ASD for each detector pair. The 1/f knee is derived from the resulting fit parameters by calculating the frequency at which the 1/f noise equals the white noise level in the ASD. Histograms of the readout white noise level and 1/f knee are shown in Fig. 5 and median values are presented in the table below.

Several important features of the SPT-3G fMux readout are observed in these results. First, the pair-sum ASDs show increased noise at low frequency compared to the pair-difference. This excess implies correlated low-frequency noise that originates within the readout via a mechanism that affects a module as whole. Expected sources include temperature fluctuations in electronics (both cryogenic and room temperature) and noise intrinsic to the digital-to-analog converters. It is important to note that multiple analysis techniques exist for cleaning correlated noise from data (including pair-differencing), leaving only the contribution from the uncorrelated low-frequency readout noise.
| Observing Band | White Noise Level | 1/f Frequency |
|---|---|---|
| [GHz] | pA/[] | [Hz] |
| 95 GHz | 10.4 | 0.041 |
| 150 GHz | 13.0 | 0.032 |
| 220 GHz | 16.0 | 0.029 |
The next feature evident in both the ASDs and Fig. 5 is that the white noise level appears to increase across the 95/150/220 GHz bands. In SPT-3G, the different bands are grouped together across the electronics bandwidth (i.e., the 95 GHz detectors have the lowest AC bias frequencies, followed by the 150 GHz and 220 GHz). The white noise level is therefore increasing with bias frequency (and not observing band), resulting from a subtle feature in the nulling scheme. Briefly, a small fraction of the nuller leaks back through the comb and bias resistor to ground and the nuller increases to compensate, amplifying noise sources in the demodulation chain bender2018 (10). The amplification factor depends on the ratio of comb impedance and squid input-coil impedance. Future implementations of fMux can mitigate this leakage effect by changing the impedance ratio. The histogram of white noise shown in Fig. 5 also includes the expected photon noise level for the three SPT-3G observing bands. The median readout white noise level is clearly below the photon noise, showing that despite the frequency dependence, the SPT-3G fMux readout is operating as desired in the photon-noise-dominated regime.
Finally, we see in Fig. 5 that the median 1/f knee frequency in the pair-differenced ASDs is mHz. Typical CMB telescopes scan the sky at a rate of or faster, up-mixing the science band to separate it from low-frequency noise sources. With this scan speed, the fMux readout 1/f knee corresponds to a multipole number of . At multipoles below this (larger angular scales on the sky), there will be increasing levels of readout noise. This knee is around a factor of three lower in multipole than the peak of predicted inflationary CMB polarization spectrum from recombination, a key scientific target for modern CMB experiments kamionkowski2016 (21). Additionally, both pair-sum (CMB temperature) and pair-difference (CMB polarization) measurements will have low-frequency noise contributions from the atmosphere. Even at an excellent site such as the South Pole, the low-frequency atmospheric contribution is expected to dominate the readout contribution presented here bussmann2005 (22). We observe that low-frequency noise from the fMux readout does not limit SPT-3G measurements of either polarization or temperature power at the scales relevant to the key science goals.
4 Summary
We present the on-sky performance of the SPT-3G fMux readout. Crosstalk is shown to meet the design specification of , with a slight excess resulting from increased frequency scatter in the filter network. We measure the white noise level of the readout and demonstrate that SPT-3G is operating in the photon-noise-dominated regime. Additionally, we explore the low-frequency noise contribution from the readout and measure a median readout 1/f knee frequency of 33 mHz. Low-frequency noise from the fMux readout will therefore not limit the SPT-3G receiver’s ability to measure the CMB polarization at the large angular scales of the inflationary signal from recombination.
Acknowledgements.
The South Pole Telescope program is supported by the National Science Foundation (NSF) through grant PLR-1248097. Partial support is also provided by the NSF Physics Frontier Center grant PHY-1125897 to the Kavli Institute of Cosmological Physics at the University of Chicago, the Kavli Foundation, and the Gordon and Betty Moore Foundation through grant GBMF#947 to the University of Chicago. Work at Argonne National Lab is supported by UChicago Argonne LLC, Operator of Argonne National Laboratory (Argonne). Argonne, a U.S. Department of Energy Office of Science Laboratory, is operated under contract no. DE-AC02-06CH11357. We acknowledge R. Divan, L. Stan, C.S. Miller, and V. Kutepova for supporting our work in the Argonne Center for Nanoscale Materials. Work at Fermi National Accelerator Laboratory, a DOE-OS, HEP User Facility managed by the Fermi Research Alliance, LLC, was supported under Contract No. DE-AC02-07CH11359. NWH acknowledges support from NSF CAREER grant AST-0956135. The McGill authors acknowledge funding from the Natural Sciences and Engineering Research Council of Canada, Canadian Institute for Advanced Research, and the Fonds de recherche du Québec Nature et technologies. JV acknowledges support from the Sloan Foundation.References
- (1) Piet A. J. Korte et al. “Time-division superconducting quantum interference device multiplexer for transition-edge sensors” In Rev. Scientific Instruments 74.8, 2003, pp. 3807–3815 DOI: 10.1063/1.1593809
- (2) E. S. Battistelli et al. “Functional Description of Read-out Electronics for Time-Domain Multiplexed Bolometers for Millimeter and Sub-millimeter Astronomy” In J. Low Temp. Phys. 151.3-4, 2008, pp. 908–914 DOI: 10.1007/s10909-008-9772-z
- (3) M. A. Dobbs et al. “Frequency multiplexed superconducting quantum interference device readout of large bolometer arrays for cosmic microwave background measurements” In Rev. Scientific Instruments 83.7, 2012, pp. 073113 DOI: 10.1063/1.4737629
- (4) L. Gottardi et al. “Development of the superconducting detectors and read-out for the X-IFU instrument on board of the X-ray observatory Athena” In Nuclear Instruments and Methods in Physics Research Section A: Accelerators, Spectrometers, Detectors and Associated Equipment 824, 2016, pp. 622 –625 DOI: https://doi.org/10.1016/j.nima.2015.09.072
- (5) B. Dober et al. “Microwave SQUID multiplexer demonstration for cosmic microwave background imagers” In App. Phys. Lett. 111.24, 2017, pp. 243510 DOI: 10.1063/1.5008527
- (6) G. M. Stiehl et al. “Code-division multiplexing for x-ray microcalorimeters” In App. Phys. Lett. 100.7, 2012 DOI: 10.1063/1.3684807
- (7) P. A. R. Ade et al. “ANTENNA-COUPLED TES BOLOMETERS USED IN BICEP2,Keck Array, AND SPIDER” In ApJ 812.2 IOP Publishing, 2015, pp. 176 DOI: 10.1088/0004-637x/812/2/176
- (8) S. W. Henderson et al. “Advanced ACTPol Cryogenic Detector Arrays and Readout” In J. Low Temp. Phys. 184.3-4, 2016 DOI: 10.1007/s10909-016-1575-z
- (9) A. Suzuki et al. “The Polarbear-2 and the Simons Array Experiments” In J. Low Temp. Phys. 184.3-4, 2016 DOI: 10.1007/s10909-015-1425-4
- (10) A. N. Bender et al. “Year two instrument status of the SPT-3G cosmic microwave background receiver” In Proc. SPIE 10708, 2018 DOI: 10.1117/12.2312426
- (11) Nicholas Galitzki et al. “The Simons Observatory: instrument overview” In Proc. SPIE 10708, 2018 DOI: 10.1117/12.2312985
- (12) T. de Haan, G. Smecher and M. Dobbs “Improved performance of TES bolometers using digital feedback” In Proc. SPIE 8452, 2012 DOI: 10.1117/12.925658
- (13) K. Hattori et al. “Optimization of cold resonant filters for frequency domain multiplexed readout of POLARBEAR-2” In Proc. SPIE 9153, 2014 DOI: 10.1117/12.2057045
- (14) K. Rotermund et al. “Planar Lithographed Superconducting LC Resonators for Frequency-Domain Multiplexed Readout Systems” In J. Low Temp. Phys. 184, 2016 DOI: 10.1007/s10909-016-1554-4
- (15) A. N. Bender et al. “Integrated performance of a frequency domain multiplexing readout in the SPT-3G receiver” In Proc. SPIE 9914, 2016 DOI: 10.1117/12.2232146
- (16) J. S. Avva et al. “Design and Assembly of SPT-3G Cold Readout Hardware” In J. Low Temp. Phys. 193.3, 2018 DOI: 10.1007/s10909-018-1965-5
- (17) A. N. Bender et al. “Digital frequency domain multiplexing readout electronics for the next generation of millimeter telescopes” In Proc. SPIE 9153, 2014 DOI: 10.1117/12.2054949
- (18) K. Bandura et al. “ICE: A Scalable, Low-Cost FPGA-Based Telescope Signal Processing and Networking System” In Journal of Astronomical Instrumentation 5.4, 2016 DOI: 10.1142/S2251171716410051
- (19) A. T. Crites et al. “MEASUREMENTS OF E-MODE POLARIZATION AND TEMPERATURE-E-MODE CORRELATION IN THE COSMIC MICROWAVE BACKGROUND FROM 100 SQUARE DEGREES OF SPTPOL DATA” In ApJ 805.1 IOP Publishing, 2015, pp. 36 DOI: 10.1088/0004-637x/805/1/36
- (20) R. Keisler et al. “Measurements of Sub-degree B-mode Polarization in the Cosmic Microwave Background from 100 Square Degrees of SPTpol Data” In ApJ 807.2, 2015 DOI: 10.1088/0004-637X/807/2/151
- (21) Marc Kamionkowski and Ely D. Kovetz “The Quest for B Modes from Inflationary Gravitational Waves” In Annual Review of Astronomy and Astrophysics 54.1, 2016 DOI: 10.1146/annurev-astro-081915-023433
- (22) R. S. Bussmann, W. L. Holzapfel and C. L. Kuo “Millimeter Wavelength Brightness Fluctuations of the Atmosphere above the South Pole” In ApJ 622.2, 2005, pp. 1343–1355 DOI: 10.1086/427935