acmlicensed \isbn978-1-4503-6816-2/19/10 \acmPrice$15.00
Sketch-n-Sketch: Output-Directed Programming for SVG
Abstract
For creative tasks, programmers face a choice: Use a GUI and sacrifice flexibility, or write code and sacrifice ergonomics?
To obtain both flexibility and ease of use, a number of systems have explored a workflow that we call output-directed programming. In this paradigm, direct manipulation of the program’s graphical output corresponds to writing code in a general-purpose programming language, and edits not possible with the mouse can still be enacted through ordinary text edits to the program. Such capabilities provide hope for integrating graphical user interfaces into what are currently text-centric programming environments.
To further advance this vision, we present a variety of new output-directed techniques that extend the expressive power of Sketch-n-Sketch, an output-directed programming system for creating programs that generate vector graphics. To enable output-directed interaction at more stages of program construction, we expose intermediate execution products for manipulation and we present a mechanism for contextual drawing. Looking forward to output-directed programming beyond vector graphics, we also offer generic refactorings through the GUI, and our techniques employ a domain-agnostic provenance tracing scheme.
To demonstrate the improved expressiveness, we implement a dozen new parametric designs in Sketch-n-Sketch without text-based edits. Among these is the first demonstration of building a recursive function in an output-directed programming setting.
doi:
https://doi.org/10.1145/3332165.3347925keywords:
Output-Directed Programming; SVG; Sketch-n-Sketch<ccs2012> <concept> <concept_id>10011007.10011006.10011066.10011070</concept_id> <concept_desc>Software and its engineering Application specific development environments</concept_desc> <concept_significance>300</concept_significance> </concept> <concept> <concept_id>10011007.10011006.10011008.10011024</concept_id> <concept_desc>Software and its engineering Language features</concept_desc> <concept_significance>300</concept_significance> </concept> <concept> <concept_id>10003120.10003121.10003124.10010865</concept_id> <concept_desc>Human-centered computing Graphical user interfaces</concept_desc> <concept_significance>300</concept_significance> </concept> </ccs2012>
[300] Software and its engineering Application specific development environments \ccsdesc[300] Software and its engineering Language features \ccsdesc[300] Human-centered computing Graphical user interfaces
1 Introduction
Direct manipulation [41] graphical user interface (GUI) applications are ubiquitous. Every day, direct manipulation GUIs are used by millions for office tasks such as presentation and document preparation as well as for specialized creative tasks such as engineering and graphic design. Direct manipulation’s intuitive point-click-modify experience enables a large number of people to leverage computers to create novel artifacts.
Even so, experts may sometimes forgo a GUI application and create their artifact using a programming language. In contrast to the intuitive experience offered by direct manipulation GUIs, text-based coding does not offer immediate and direct artifact construction, but programmers use text-based languages to gain flexibility not afforded by any GUI application.
Both paradigms—direct manipulation and text-based programming—have proven useful. Naturally, there have been efforts to combine their distinct strengths.
For example, some professional creative applications do offer a scripting API (e.g. Maya [3]), but, beyond perhaps an initial macro recording, script construction is a text editing process with no direct manipulation support. Furthermore, in the programming world, non-text paradigms such as blocks- [5] or wires-based visual programming [44] allow direct manipulation of program elements. Even so, most professional programming remains a strictly plain text activity.
Instead, could direct manipulation augment text-based programming, providing user interfaces more like standard creative application GUIs, such as graphics editors? Rather than directly manipulating program elements construed as blocks and wires, could one construct a textual program by directly manipulating a program’s output?
Output-Directed Programming (ODP)
We refer to this paradigm—in which a programmer constructs a plain text program by mouse-based operations on the program’s output—as output-directed programming (ODP). Each operation triggers a transformation on the text-based program, akin to automatic refactoring tools. Successive operations build the program step by step. Because the program is plain text throughout the process, desired changes that are not possible through the provided direct manipulation interactions can be enacted by ordinary text editing. The system treats the plain text as the artifact’s primary representation so that text editing does not disable future direct manipulation actions.
This ODP paradigm for altering a program by manipulating its output offers two tantalizing possibilities:
-
•
Creative applications could represent the user’s artifact not as an opaque internal data structure but as a visible, editable, textual program. Direct manipulation of the artifact can be freely mixed with computational generation.
-
•
For general-purpose programming, ODP could facilitate general program construction via output-directed manipulations. For experts, these ODP interactions might accelerate common program construction tasks, and for novices, ODP interactions might provide an approachable pathway into programming.
A number of systems have made initial steps towards realizing this paradigm. After first drafting a program using ordinary text edits, several ODP systems allow direct manipulation of the output to change constant literals in the program [47, 10, 25, 40, 30]. To also relieve the initial text editing burden, for programs with graphical output a few systems provide ODP mechanisms for program construction [32, 39, 20], akin to drawing tools in graphics editors.
All prior ODP systems presented their workflow as a mix of text edits and direct manipulation. Although the selling point of ODP is that text edits can compensate for any missing direct manipulation features, the standing question is how thoroughly direct manipulation can subsume text-based editing. Therefore, in this work we wonder: What kinds of programs can be constructed entirely through output manipulations?
New ODP Techniques in Sketch-n-Sketch
We extend our prior work on Sketch-n-Sketch [10, 20], a programming system for creating vector graphics, with new ODP techniques that enable the system to construct 16 example programs without text edits on the code—even though ordinary text editing remains possible at any time during the construction of each example. Specifically, we:
-
1.
Expose intermediate execution values for manipulation, instead of just the final output.
-
2.
Offer expression focusing to enable contextual drawing.
-
3.
Expose generic code refactoring tools through output-directed interactions.
-
4.
Use generic run-time tracing to track value provenance, to associate output values with source code locations.
Although the Sketch-n-Sketch system is specialized for programs that output vector graphics, the four principles above are relevant for future output-directed programming systems of all kinds.
Paper Outline and Supplementary Materials
To introduce the output-directed programming workflow in Sketch-n-Sketch, in the next section we walk through the creation of a simple example program. After this overview, we present the core ODP mechanisms and our four innovations in more detail, followed by an examination of the construction of the 16 example programs. We conclude by discussing current limitations of Sketch-n-Sketch, related work, and future directions for ODP. Our implementation, examples, videos, and appendices are available as Supplementary Materials and on the Web (http://ravichugh.github.io/sketch-n-sketch/).
2 Overview
Sketch-n-Sketch is a bimodal programming environment, as depicted in Figure 1: the left pane is an ordinary source code text editor; the right pane renders the scalable vector graphics (SVG) [48] design generated by the code and also offers a graphical interface for performing transformations on the SVG output (i.e., with mouse-based manipulations). The programmer may perform keyboard text edits on the code at any time during program construction, but this ability will not be used in this paper.

Lambda logo.
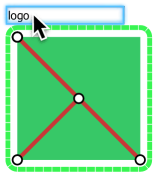
To introduce the basic ODP workflow in Sketch-n-Sketch, we will walk through the construction of a reusable design for the Sketch-n-Sketch logo (Figure 2).
The construction will proceed in four consecutive phases:
(i) drawing the shapes,
(ii) relating graphical features to align shapes and equate colors,
(iii) abstracting the design into a reusable function, and, finally,
(iv) refactoring the design to clean up the generated code.
Throughout, the code shown is as produced by Sketch-n-Sketch.
Newlines inserted for formatting purposes in this paper are “escaped” by a “\” backslash.
The final code for this example is shown in Figure 11.
2.1 Drawing Shapes
The initial program template is nearly blank, defining only an empty list of SVG shapes:
Starting from this bare program, the programmer would first like to get some shapes into the program’s output. A traditional programming environment would require looking up the drawing library’s documentation and perhaps copy-pasting some example code into the program.
The Sketch-n-Sketch output pane, however, imitates a traditional drawing application. The programmer clicks on the “square” tool from the toolbox (Figure 1a) and drags the mouse on the canvas. When she releases the mouse, a new square1 definition is inserted in the program, based on a call to the square standard library function with arguments for position and size derived from the mouse drag operation. A square1 variable usage is also inserted into the shape list at the end of the program, and thereby a red square appears in the program output on the canvas (not shown).
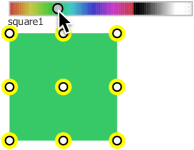
Shapes on the canvas may be directly moved and resized as in a traditional graphics editor, causing Sketch-n-Sketch to automatically change appropriate numeric constants in the program [10]. Additionally, when a shape is selected, sliders appear to allow similar modification of non-shape attributes such as, e.g., fill color (Figure 3) or stroke width. In our example, the programmer drags the color slider to change the square’s fill color from red to a shade of green; the appropriate number in the program is updated (the color number 0 above becomes 140, shown in Figure 4).
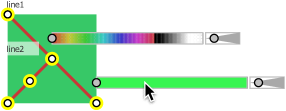
To create the lines for the lambda symbol, the programmer selects the “line” tool and then “snap-draws” [18] two lines between point features of the green square: she draws one line from the top-left to the bottom-right corner and a second line from the bottom-left corner to the center point (these two steps are shown in the right side of Figure 4). Sketch-n-Sketch interprets these snaps as constraints which should always hold, i.e., the lines should still coincide with the corners and center even if the square is moved or resized. Sketch-n-Sketch encodes these constraints in the program via shared variables: three new variables are introduced for the square’s top-left and coordinates and its width , and the spatial properties of both the square and the two lines are defined in terms of simple math on those variables (Figure 4).
2.2 Relating Properties
The programmer would like the color and width of the two lines always to be identical.
Sketch-n-Sketch offers tools for relating features after they are drawn. To relate the colors, the programmer first selects the two lines (indicated by yellow highlights in Figure 5) to expose sliders for each line’s color and stroke width.
As mentioned earlier, she can manipulate the sliders to change constants in the program, but here she instead clicks the whole line2 color slider
to select the property itself (a selected property is indicated in green, as shown in Figure 5) and then selects the other line’s color slider as well.
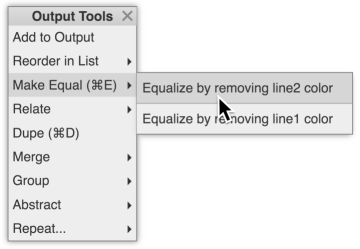
Whenever an item is selected, Sketch-n-Sketch displays a floating menu of output tools. The programmer would like the two selected colors to always be the same, so she moves her mouse to the Make Equal tool, revealing a list of possible program transformations in a submenu—in this case there is only one, but if the lines had been different colors two results would be offered to let the programmer decide which line’s color should take priority (as simulated in Figure 6). Moving her mouse over the single “Equalize by removing line2 color” result in the submenu shows a preview of the new output on the canvas and presents a diff of the change in the code box (not shown)—in this case the appearance will not change but an appropriately-named color variable will be introduced and used for both lines. The programmer is happy with this change and clicks to apply it. She repeats this workflow to equalize the stroke width of the two lines as well.
2.3 Abstracting the Design
The programmer would like to make her logo design reusable—in other words, she would like to create a function that, given size and color arguments, generates a logo appropriately.
She gathers the three shapes into a single expression by selecting the shapes and invoking the Group tool in the floating menu. Analogous to the grouping functionality of traditional graphics editors, Group in Sketch-n-Sketch gathers the shapes into a single list definition, which is used in place of the individual shapes in the final shape list:
Now that the shapes are grouped into a list, Sketch-n-Sketch offers that list itself as an object for selection on the canvas. Lists are represented on the canvas with list widgets—boxes with dotted borders (intended to evoke the elements of a list). When the programmer hovers her mouse over a shape, list widgets are shown for each of the list expressions in the program in which the shape appeared. In this example there are four such lists: the initial list literal [square1, line1, line2] plus three expressions at the end of the program that evaluate to lists (the squareLineLine variable usage, the list literal [squareLineLine], and the flattened list value produced by the call concat [squareLineLine]).
Notice in Figure 7 how Sketch-n-Sketch chooses a layout to avoid otherwise-overlapping widgets.
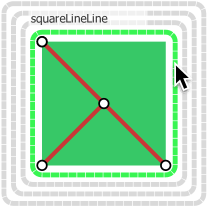
Hovering over a list widget highlights the corresponding code expression in the program (not shown), allowing the programmer to distinguish the various lists. She selects the list widget corresponding to the [square1, line1, line2] literal (as shown in Figure 7). Because this list literal is assigned to a variable, the list widget is labeled with the variable name, squareLineLine.
A label on the canvas may be clicked to enact a Rename refactoring on the variable (Figure 8). After renaming the squareLineLine variable to logo, she then, with the list still selected, invokes the Abstract tool to construct a function that returns the selected item, namely the list [square1, line1, line2]. The Abstract tool performs an “Extract Method” refactoring. Definitions (with free variables) used only in the construction of [square1, line1, line2] are heuristically pulled into the new function, producing a function named logoFunc parameterized over the remaining free variables y, x, w, color, and strokeWidth:
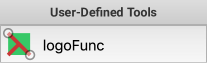
The programmer has created a reusable function, which she could manually call multiple times in the program. Conveniently, however, type inference in Sketch-n-Sketch notices that this function accepts an -coordinate and a width, so this function appears in the tool box on the right-hand side as a custom drawing tool (Figure 9).111Type inference mechanisms to distinguish between and coordinates, distances, and other numeric values are described in the appendix included in the Supplementary Materials. User-defined drawing tools behave the same way as the standard library drawing tools such as the square and line tools already demonstrated: drawing on the canvas with the tool will insert a new call to the custom function into the program.
2.4 Refactoring
Although the programmer has produced a reusable design, she may change her mind about particular details in the program. For example, the programmer may like to clean up the code and also may want to add a border to the design. Sketch-n-Sketch provides features to help implement code changes such as these two.
Similar to list widgets, call widgets—drawn with solid borders—are placed around items that are produced by function calls in the program. The programmer clicks the call widget for the first call to logoFunc, which (a) exposes the function’s arguments above the called widget, and (b) focuses any changes to just that function. The rest of the program output (there is none currently) disappears from the canvas for the duration of the focused editing session.
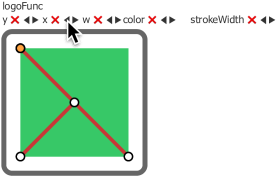
When a function is focused, its arguments may be renamed, removed, or reordered; an argument may be added by selecting a shape feature within the function and choosing Add Argument from the output tools menu. In this case, the programmer clicks the Reorder Argument arrows to place the x argument before y.
Now the programmer would like to add a border. After changing the two existing lines to black via color sliders, she then snap-draws a polygon to the four corners of the square with the “Polygon” tool from the toolbox. Because she is focused on this function, the new polygon, called polygon1, is added to the return expression of the logoFunc function instead of to the program’s final shape list (see lines 20-25 of Figure 11). With the polygon selected, she uses the polygon’s sliders to set its fill color to transparent and to adjust its stroke width.
The lambda logo program is now completed to the programmer’s satisfaction; the final code is shown in Figure 11. The programmer was able to create the program entirely through output-directed manipulations on the canvas by using tools for drawing, relating, abstracting, and refactoring.
3 Design and Implementation
Sketch-n-Sketch is a browser application written in the functional language Elm [15] extended with custom providers for mutation and exceptions.
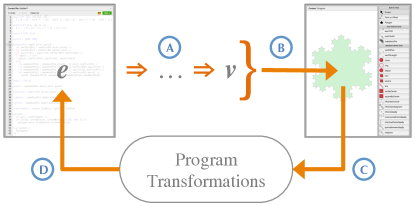
Figure 12 depicts the workflow for output-directed programming in Sketch-n-Sketch. The programmer-facing language for users is a standard functional language with Elm-like syntax. A text-based program written in this language is evaluated, and its SVG output value is rendered on the output canvas. The output is overlaid with widgets for selecting and manipulating sub-values (discussed below). The programmer may draw a shape, or drag an item to change a number in the program [10], or make a selection and choose a program transformation from the floating tools menu (Figure 6). The resulting modified program is placed in the code box and is re-evaluated producing new output on the canvas.
Most of Sketch-n-Sketch’s tools (summarized in Figure 13) operate on selections on the canvas. Different kinds of sub-values of the final output may be selected: whole shapes may be selected, or sub-features of shapes may be selected—namely, positional properties (via points rendered on the corners and edge midpoints of shapes), size properties (via selection regions for width and height), colors (via color sliders), or strokes (via stroke width sliders). When the programmer makes a selection and then invokes a transformation, the selected sub-values are “arguments” to the transformation and are interpreted in a transformation-specific way.
| Drawing | #Ex |
|---|---|
| ★ Draw Shape | 16 |
| ★ Draw Custom Shape | 4 |
| ★ Dupe | 2 |
| ★ Draw Point | 3 |
| ★ Draw Offset | 9 |
| ★ Delete | 4 |
| ★ Focused Drawing | 1 |
| ★ Snap Drawing (UI) | 15 |
| Relating | #Ex |
| ★ Make Equal | 12 |
| ★ Relate | 2 |
| ★ Distance Features (UI) | 6 |
| Abstracting | #Ex |
|---|---|
| ★ Group | 8 |
| ★ Abstract | 9 |
| ★ Merge | 0 |
| ★ Repeat over Function Call | 2 |
| ★ Repeat over Existing List | 3 |
| ★ Repeat by Indexed Merge | 2 |
| ★ Fill Hole | 2 |
| ★ List Widgets (UI) | 9 |
| Refactoring | #Ex |
| ★ Focus Expression | 3 |
| ★ Rename in Output | 15 |
| ★ Add/Remove/Reorder Arg. | 6 |
| ★ Reorder List | 4 |
| ★ Add to Output | 1 |
| ★ Select Termination Cond. | 1 |
Looking forward to applying ODP to larger programs, manipulation of the final output alone will be insufficient. The output by itself does not represent the process by which the output was produced. We believe some of the intermediate process should be exposed on the canvas for manipulation.
Therefore, in addition to the sub-values of the final output described above, the programmer may also select two additional kinds of terms associated with the program’s execution. First, we also expose widgets on the canvas that correspond to intermediate values produced during execution. Second, we allow the programmer to select a sub-expression in the program to denote the context under focus. These additional kinds of selections—intermediate values and focused sub-expressions—serve as further arguments to program transformations and enable the programmer to modify portions of the computation that do not have a direct representation in the final output.
To highlight the key ideas behind our implementation, we discuss these two novel selection types below. We also discuss the degree to which several of our transforms are ordinary automatic refactorings (i.e. not specific to SVG), as well as the generic provenance tracing that the transformations rely upon to associate canvas selections with program locations.
3.1 Intermediate Value Widgets
To allow manipulation of computation steps before the final output, Sketch-n-Sketch displays widgets for three kinds of intermediate values produced during execution: point values, offset values, and list values.
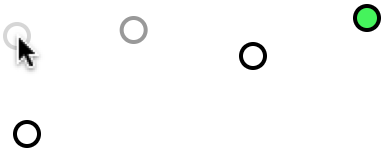
Points (number-number pairs, e.g. [10, 20]) produced at intermediate execution steps are exposed for manipulation as point widgets on the canvas. Between selected points, we also draw distance features for selecting Cartesian distances.
In graphics code, it is common to define offsets from some base or values. Therefore, during execution, when a numeric amount is added to or subtracted from an or coordinate, an offset widget is drawn on the canvas as a horizontal or vertical arrow from the initial point, where the length of the arrow is the numeric amount of the offset. The arrow itself may be selected or dragged to change the offset amount.
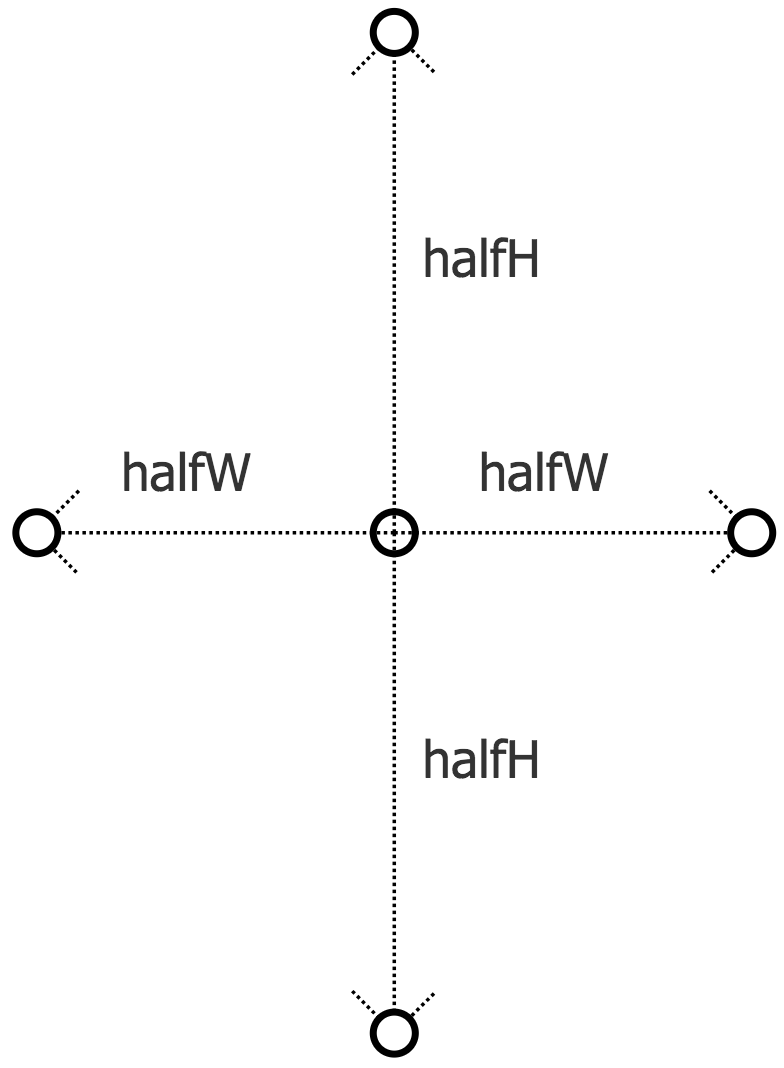
To complement the new point widgets and offset widgets, a “Point and Offset” tool in the toolbox (Figure 1b) allows the programmer either to click on the canvas to add a point definition to the program (e.g. [x, y] as point = [10, 20]) or to drag on the canvas to add a new offset definition (e.g. xOffset = x + 5). Offsets not drawn from an existing point also insert a new point for the base of the offset. To ease the creation of symmetry, offset amounts may snap to each other while drawing. The symmetry is enforced by introducing a shared variable for offset distance.
For example, the program in Figure 14 is rendered on the canvas as a point widget from which four offsets emanate. The variables halfW and halfH are shared offset amounts produced by snap-drawing (and subsequently renamed by the programmer). The ends of the offsets can serve as snap targets for future drawing (e.g. the rhombuses in Figure 15xii). Note that Figure 14 was created by the using the “Point and Offset” tool, but the rendered widgets would be the same if the program were instead written by text edits—only the code matters. Sketch-n-Sketch emits widgets from the evaluator when appropriate computation patterns are encountered.
A third type of intermediate widget—a list widget—is emitted whenever an execution step evaluates to a list of graphical items. A list widget is drawn as a dashed box encompassing the items (Figure 7). Any list of shapes, list of points, or list of lists in the program can thus be selected. List widgets obviate the need for a graphics-specific construct to denote groups of shapes—a group is just a list of shapes, and the list widget facilitates selection of, and thus operations on, the group.
3.2 Expression Focusing
To enable manipulation of subsections of the program, a program expression may be selected to control the syntactic scope of changes made to the code. Most notably, focusing a shape group (i.e. list of shapes) or a function causes drawing operations to insert shapes into that group or function rather than the final output. Accordingly, a recursive design can be created by drawing a function inside itself.
When a function call produces graphical elements, a call widget is displayed around the returned elements as a box with a gray solid border. Clicking the gray border focuses the function call (Figure 10). The remainder of the program’s output is hidden and drawing operations are interpreted inside the focused function. Clicking the call widget again or pressing the “escape” key returns focus back to the entire program.
Literal (non-function) definitions may also be focused. If a canvas selection refers to the right hand side of an assignment, a Focus Expression tool is offered to focus that assignment.
3.3 Generic Refactoring
Looking forward to applying ODP to domains beyond vector graphics, a number of Sketch-n-Sketch’s tools apply standard automatic refactorings.
Most notably, labels are drawn next to most widgets on the canvas to aid comprehension—any label may be clicked to Rename the associated variable and its uses.
Sketch-n-Sketch also includes tools for refactoring functions. The Abstract tool performs a generic “Extract Method” refactoring, building a new function parameterized over the expression’s free variables. Also, when a function call is focused by clicking its call widget, Sketch-n-Sketch offers actions to add, remove, or reorder arguments. Finally, the Merge tool performs clone elimination.
3.4 Provenance Tracing
While the widgets for intermediate values expose relevant steps of the computation on the canvas, occasionally the transformations require knowledge about parts of the computation that are not directly represented by widgets. For example, the Add Argument tool searches for every expression that affected the selected value and separately offers each such expression as a possible new argument to the function.
To help the tools answer these kinds of questions, the Sketch-n-Sketch evaluator performs tracing on every execution step: the resultant value is tagged with the expression being evaluated as well as pointers to the prior (tagged) values used in the immediate computation; transitively following these prior tagged values reveals the dependencies of the computation. To answer containment queries, we additionally add pointers from list elements to the list(s) containing them. Our tracing discards certain control flow information, most notably pattern match de-structuring operations; future versions of Sketch-n-Sketch may adopt the Transparent ML [2] tracing scheme to preserve this information. Neither our tracing nor Transparent ML is specific to SVG—we suspect generic tracing will be useful for ODP in multiple domains.
Sketch-n-Sketch becomes sluggish on larger examples. Although tracing theoretically adds memory and time overhead to evaluation, the culprit is not tracing itself but is usually comparison between large traces or widget processing.
4 Case Study of ODP Examples
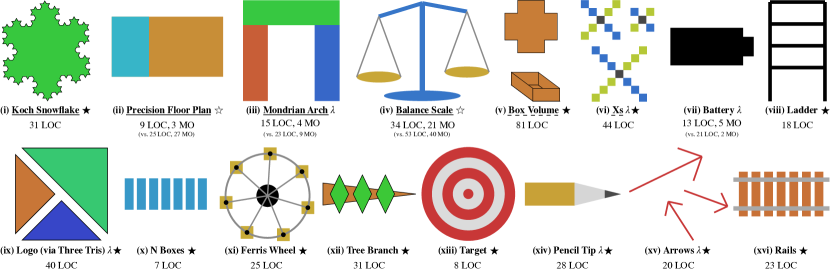
To explore the expressiveness of ODP in Sketch-n-Sketch, we implemented 16 parametric designs summarized in Figure 15. Drawn from various sources [10, 20, 35, 6, 9], the designs exercise different features: 6 designs are parameterized functions that appear as drawing tools at the end of construction, 6 involve repetition by position, 1 involves repetition by other features (radius and color, Figure 15xiii), and 1 uses recursion (Figure 15i). All 16 programs, spanning 427 lines of code total, were built entirely via output-directed manipulations, without any text editing in the code box.
Below, we discuss common patterns in how we used the tools to implement the examples. Next, we recount the key steps in building the recursive Koch curve and explain the process to construct designs involving repetition. Finally, we describe limitations by discussing the tasks from the Watch What I Do: Programming by Demonstration [35] benchmark suite that the current system cannot complete without text edits.
4.1 Authoring
The lambda logo walkthrough in the overview framed the Sketch-n-Sketch workflow as a four stage draw-relate-abstract-refactor authoring process. In practice, design construction cannot always be cleanly delineated into precise stages in a fixed order. For example, while constructing the designs of Figure 15, we often specified the relationships before drawing the shapes: we laid out the desired parameterization of the design using points and offsets (as in, e.g., Figure 14) and afterwards attached shapes using snap-drawing.
The #Ex column of Figure 13 lists how many of the Figure 15 examples utilized each tool. Indeed, besides shape drawing and variable renaming, the most widely used functionality was Sketch-n-Sketch’s snap-drawing ability—not surprising given that the goal was to create parametric designs.
It is notable that to encode spatial constraints we more often preferred to snap-draw rather than use the Make Equal tool. Make Equal is more flexible, but not only does it require extra clicks compared to snap-drawing, Make Equal can offer a large number of different but hard-to-distinguish ways to enforce a constraint (Figure 6 is a tame example). To help, Sketch-n-Sketch employs a ranking heuristic that seems to work well in practice: Make Equal prefers changes that rewrite terms near each other and later in the program. The least used tool for specifying relationships was the Relate tool. Relate guesses a mathematic relationship between selected items—we only used it for constraints involving thirds.
Offsets plus snaps and Make Equal was sufficient, but not always convenient, for creating reasonable parameterizations of the designs. Laying out offsets beforehand requires forethought. A future Sketch-n-Sketch might benefit from tools to break constraints or invert dependencies after the fact.
As indicated in Figure 13, we did not use the Merge tool and three tools were used only once, all on the most challenging example, the Koch snowflake. The Merge tool merges multiple copies of a shape into a function—we prefer Abstract instead because it requires only a single example. The three tools only used for the Koch fractal all played a role in the workflow to specify recursion, which we now recount.
4.2 Recursive Koch Snowflake
We highlight the key steps in creating the recursive von Koch snowflake design [46] (Figure 1, Figure 15i). This task requires manipulating intermediates—program has no output throughout most of its development—and focused editing is needed to build the recursive function. Here we emphasize the steps to specify the recursion, although the video in the Supplementary Materials walks through the entire construction.
Each side of the Koch snowflake is based on a recursive motif shown in Figure 1f. The motif requires two helper functions: a function that, given two points, computes a point of the way between them (oneThirdPt, Figure 1d), and a function that, given two points, computes a third point that completes an equilateral triangle (equiTriPt, Figure 1e). The two helpers are created without text edits via the Relate and Make Equal tools, respectively. Each helper takes in two points and is thus exposed as a drawing tool (Figure 1c).
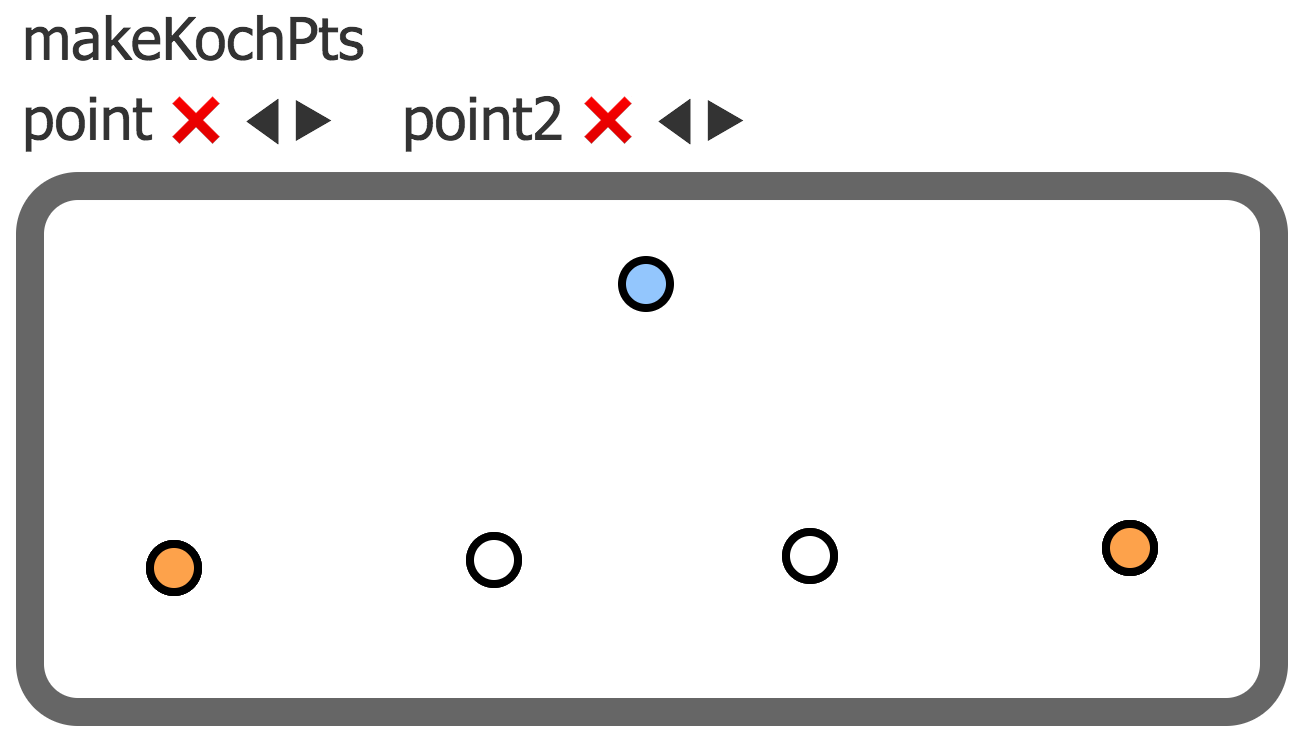
The Koch motif is created by snap-drawing oneThirdPt forward and backwards to yield the and points; equiTriPt is used to create a point equidistant from the and points. The bottom of Figure 16 shows this initial motif after abstraction. Note that when a function is focused, as in Figure 16, input points are rendered in orange and output points in blue. The code is not recursive yet:
Drawing the function inside itself causes Sketch-n-Sketch to insert a recursive skeleton and the recursive call:
To avoid infinite recursion, the temporary guard expression ??terminationCondition evaluates to false the first time the function is encountered, and true if the function has appeared earlier in the call stack, affecting termination at a fixed depth. The termination condition may be selected later.
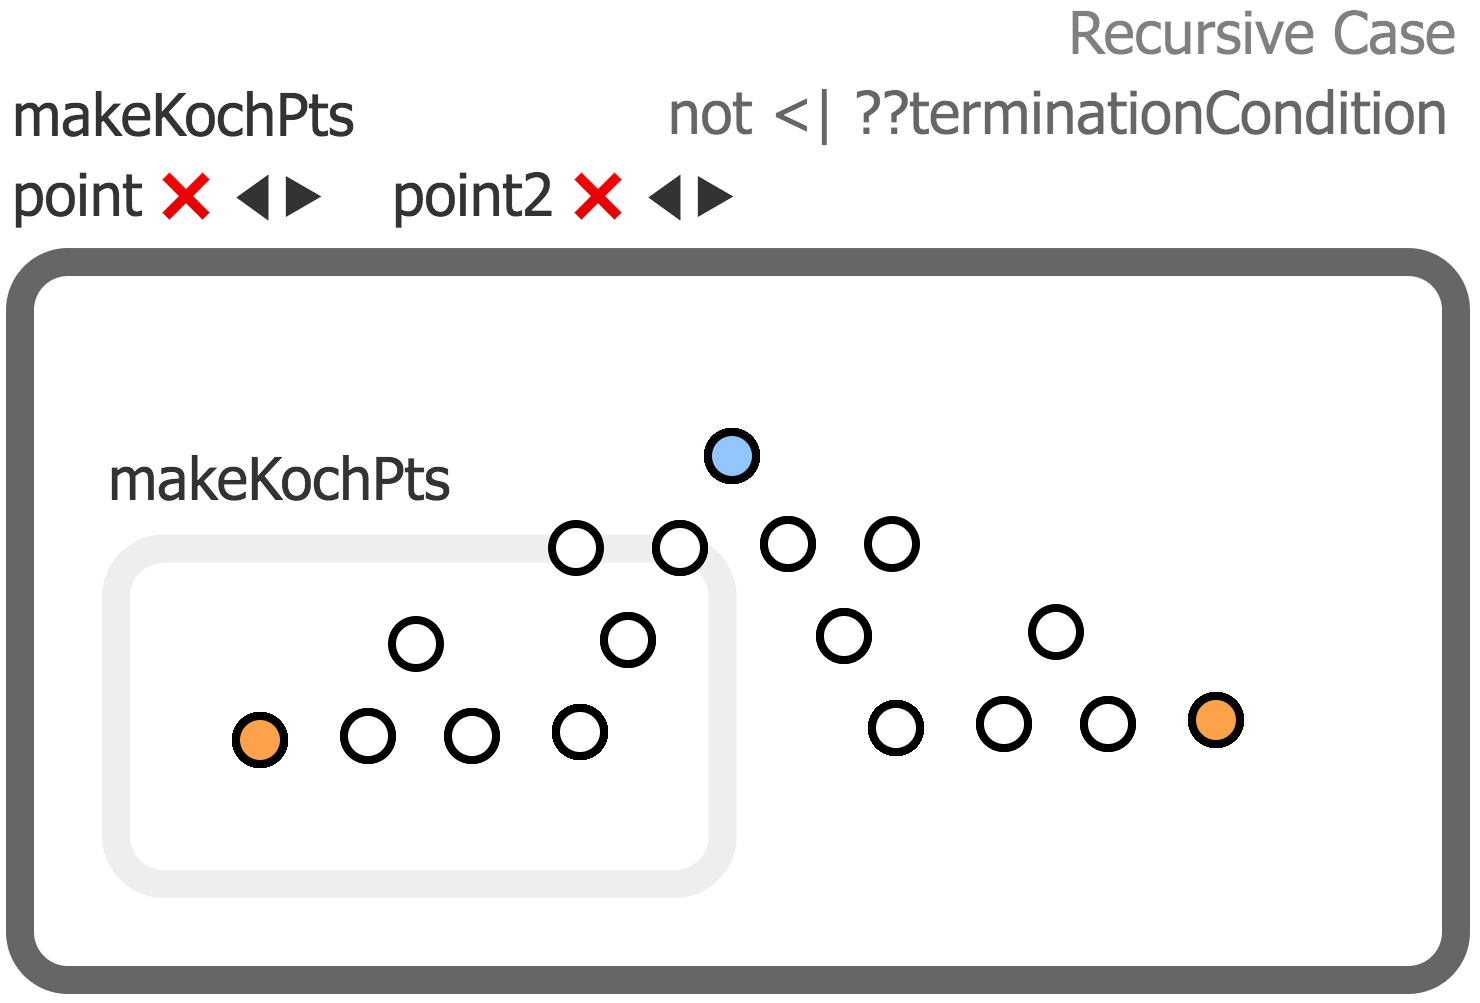
After drawing the function between the remaining three pairs of points the design looks like a fractal (Figure 17). However, only one point is output from the function—the white points are only intermediates. Moreover, most of those intermediates are inside calls to the base case. Although focused on the function’s recursive case, to modify the output of the base case, the programmer can click the call widget of a call to the base case (the inner light gray border in Figure 17) to focus that call instead (Figure 18).
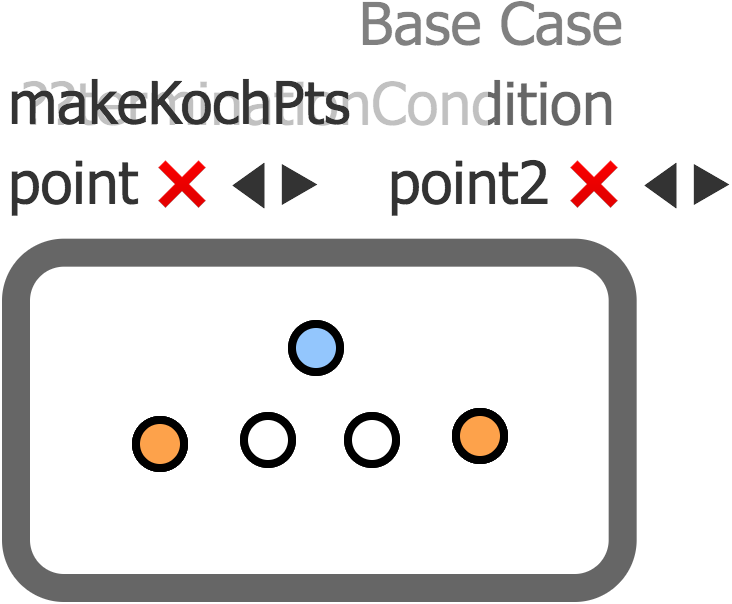
The Add to Output and Reorder in List tools are used to place the selected points into the output of the base case (resulting in the list on line 16 of Figure 1). Once complete, the recursive case may be refocused, and, using the same two tools, its output is specified to be the concatenation of the lists returned from calls the the base case (line 22 of Figure 1).
What remains is to choose a termination condition. The focused call widget for makeKochPts displays the conditional not <| ??terminationCondition for the recursive case. Clicking the conditional offers termination conditions. Currently, Sketch-n-Sketch implements only one: fixed depth, in which a depth argument is decremented on the recursive calls. These changes are visible in the final code (Figure 1f).
With all the points for the Koch snowflake now on the canvas, a polygon is attached to them by selecting the “Polygon” tool and clicking the list widget to select the points. With widgets hidden, the final snowflake is shown in Figure 1.
4.3 Repetition
Of the Figure 15 examples, 7 utilize Sketch-n-Sketch’s tools for creating repetitive designs. A selected shape may be repeated either over an existing list of points in the program or over a new call to any function that returns a list of points (the default toolbox in Figure 1a contains several such functions). Figure 19 illustrates code produced by these repetition tools.
For creating designs that vary over a non-spatial attribute, Sketch-n-Sketch alternatively offers a programming by demonstration workflow: after manually laying out the first few shapes of a repetitive design, the Repeat by Indexed Merged tool syntactically merges the shape expressions into a single function that is called with an argument i that takes on the values 0, 1, 2, etc. Using a simple form of sketch-based synthesis [42], a special tool called Fill Hole resolves syntactic differences between the original shape expressions by synthesizing expressions that refer to the index variable i. Figure 15x and xiii were constructed with this workflow.
4.4 Limitations: Remaining Tasks
Of the 15 tasks in the Watch What I Do: Programming by Demonstration [35] benchmark suite that may be interpreted as parametric drawings, our system is able to fully complete 4. What is needed to complete all the tasks without text edits?
Two of these remaining WWID: PBD tasks can be partially completed in this work (Figure 15v, vi). To fully complete them, “Box Volume” would require an interaction to compute and display the numeric volume of the folded box, and “Xs” would require more precise control over what definitions are abstracted. (Not all uses of a squareWidth parameter are pulled into the abstraction, causing the design to render incorrectly when drawing an X with different sized squares.)
The remaining nine tasks are diverse; no single feature would help with more than two or three. A prominent missing feature is arbitrary text boxes, with other elements placed relative to the text size. Beyond this, several examples require various list operations. Sketch-n-Sketch would also need to reason about intersections of lines with shape edges, to offer ways to specify overlapping and containment constraints, and to solve different kinds of such constraints simultaneously. Finally, one example would require creating if-then-else branches outside of a recursive or hole-filling setting.
5 Related Work
Many related approaches provide direct manipulation tools to (a) transform programs and/or (b) build parametric designs.
Parametric Computer-Aided Design (CAD)
Feature-based parametric CAD systems record user actions as a series of steps that together act as a program encoding the creation of the design. If an element’s property is changed, dependent actions in the sequence are re-run. Among CAD systems, EBP [34] is notable for offering a programming by demonstration workflow to create loops and conditionals.
Drawing With Constraints
Several visual design systems integrate constraint specification (e.g. [49, 23]). Notably, Apparatus [38], Recursive Drawing [37], and Geometer’s SketchPad [22] support recursion. Like CAD, but unlike Sketch-n-Sketch, these systems do not represent the design in a general-purpose, text-based programming language.
Constraint-Oriented Programming (COP)
Other constraint-oriented systems, following in the footsteps of SketchPad [43], explicitly view building a constrained system as a programming task [7, 21, 16]. While offering varying degrees of visibility into the code, these systems are distinguished by running constraint solvers alongside the program. We instead rely on standard execution semantics.
Programming by Demonstration (PBD)
Several PBD approaches [11] use shape drawing as a domain for exploring non-textual programming techniques. These systems usually rely on a visual rather than representation of the program (e.g. [24, 26]) or show actions step-by-step [29]. We also use shape drawing as our application domain, but we do not hide the program text. Although not as visual as peer PBD systems, Tinker [27] is notable for supporting recursion by demonstration; indeed, any Lisp expression may be created, albeit via manipulations performed on a symbolic representation not far removed from the underlying Lisp. More recently, PBD techniques have been developed for data visualization [45], mobile applications for collaboration [13], web scraping [4, 8], API discovery [50], and hand-drawing recognition [14].
Output-Directed Programming
Several recent systems augment a regular text-based programming experience with abilities to directly manipulate output to enact code changes. The transformations available may be “small” (such as changing constants [10, 25, 30], strings [47, 40, 25, 30], or list literals [30]), but several systems enable “larger” program changes via output manipulation.
Transmorphic [39] re-implements the Morphic UI framework [28] but with stateless views. Transmorphic retains Morphic’s ability to manipulate shapes by affecting changes to a view’s (text-based) code rather than changing live object state. Adding and removing shapes as well as changing a shape’s primitive properties are both supported.
APX [32, 33], like Sketch-n-Sketch, is a two-pane (code box and output canvas) environment for creating shape-drawing programs (APX also supports dynamic visual simulations). On the canvas, manipulating shape attributes changes appropriate numbers in the program; a few larger changes (e.g. grouping and inserting shapes) are also supported. However, most of APX’s interactions focus on directly manipulating terms in the code box rather than on the canvas.
Prior Sketch-n-Sketch
Our prior work on Sketch-n-Sketch [20] introduced a draw-relate-abstract workflow, including the ability to select sub-values in the output and invoke certain program transformations. Figure 13 indicates which tools also appeared in this prior work. In the present work, besides exposing intermediates for manipulation, offering expression focusing, and adding repetition and generic refactoring tools, we also sought to improve the prior draw-relate-abstract tools.
The prior Sketch-n-Sketch [20] relied on syntactic restrictions: shapes followed a strict “left-top-right-bot” bounding box parameterization, special functions were needed to compose shapes, and the program needed to be a series of top-level definitions followed by a list literal “main” expression referring to the top-level definitions. If, through text-editing, the programmer veered outside of this syntactic subset of the language, many output-directed tools became unavailable.
In this work, we relaxed these syntactic restrictions and moved the operation of Sketch-n-Sketch’s tools closer to ordinary programming concepts. The drawing tools now operate based on types rather than a syntactic bounding box construct. No longer are special function calls needed to compose shapes: groups are now ordinary lists. Our generic provenance tracing enables the tools to transform shapes not defined at the top level. We also now offer multiple results for transformations.
We additionally improved code generation. Four of the examples in Figure 15 (ii, iii, iv, vii) can also be constructed without text edits in the prior Sketch-n-Sketch [20], albeit with undesirable parameterizations for two of the four (ii, iv). Figure 15 lists the source lines of code (LOC) and math operations (MO) for the programs in both the present and prior versions of Sketch-n-Sketch. Reductions in LOC are incidental—our drawing tools now insert single-line function calls instead of wordier multi-line definitions. Reductions in math operations, however, do indicate better code: the prior Sketch-n-Sketch sometimes inserted large math expressions too complex for human comprehension. Besides discarding the bounding boxes that required properties such as shape width to be computed (e.g. as right - left), we also more aggressively reuse variables and simplify math in the Make Equal tool, aided by connecting Sketch-n-Sketch to an external solver (REDUCE [19]).
During our upgrades, some functionality was disabled but would be useful to restore. Most notably, unneeded by our examples, the current Sketch-n-Sketch lacks a path tool. Also, tools to re-parameterize shapes en masse could be useful, if, for example, a bounding box parameterization is desired.
6 Conclusion and Future Work
We improved expressiveness in Sketch-n-Sketch, showing how to construct a variety of non-trivial programs entirely through direct manipulation. Our long-term goal, however, is not to create a practical drawing tool but to use this particular application domain as a laboratory for advancing the expressiveness of output-directed programming for a variety of future programming settings. There are several avenues to explore in this direction.
ODP for Novices
Our work so far has assumed the Sketch-n-Sketch user is comfortable working in code to understand program operation. ODP interactions might also help those with little programming experience—such as domain experts or students—to quickly produce rudimentary programs. Design considerations for novices should be investigated.
Widget Visibility
Because program execution may involve a large number of intermediate evaluation steps, even simple programs might clutter the canvas with widgets, making it unusable. Therefore, our current implementation hides most widgets by default and uses heuristics to determine when to show them—generally, upon the mouse hovering over some associated shape. Additionally, widgets from intermediate expressions in standard library code—outside the visible program—are generally not shown. In the future, these visibility choices could be more systematically controlled, e.g., by source code annotations or user interface options.
Customizing Widgets
Mechanisms for customization may help address the open question of how
to render graphical representations of program evaluation and of domain objects
that are not inherently visual.
One approach would be to design an API for “toSvg” functions that
specify how to render graphical representations of intermediate data structures.
Analogous to “toString” functions that render text, a toSvg API
might similarly render composite data structures via recursively calling toSvg for each of the structure’s elements.
Synthesizing Program Transformations
Each program transformation offered by Sketch-n-Sketch has been hand-coded one-by-one. This effort is time-consuming, error-prone, and limits the composability of transformations. Program synthesis techniques have been successfully incorporated into refactoring tasks for class-based languages [36]; perhaps such techniques can be extended to streamline the specification of output-directed transforms that operate simultaneously on both abstract and concrete syntax.
User Interactions for Deciphering Human Intent
There are often multiple valid program changes associated with a specific user action. To resolve ambiguity, our system displays code and output differences and asks the user to choose. Richer interactions are needed to explain the differences (e.g., change impact analysis [17, 12]) and to better resolve the user’s intent (e.g., by asking additional questions [31]).
In order for the live and immediate experience afforded by output-directed programming to scale into usable systems for different programming tasks and user scenarios, developing and refining such user interaction techniques remain crucial challenges to tackle in future work.
7 Acknowledgements
Our thanks to Philip Guo and the anonymous reviewers for helpful feedback. This work was supported by U.S. National Science Foundation Grant No. 1651794.
References
- [1]
- [2] Umut A. Acar, Amal Ahmed, James Cheney, and Roly Perera. 2013. A Core Calculus for Provenance. Journal of Computer Security (2013).
- [3] Autodesk Inc. Maya. http://www.autodesk.com/products/maya/overview.
- [4] Shaon Barman, Sarah Chasins, Rastislav Bodik, and Sumit Gulwani. 2016. Ringer: Web Automation by Demonstration. In Object-Oriented Programming, Systems, Languages, and Applications (OOPSLA).
- [5] Andrew Begel. 1996. LogoBlocks: A Graphical Programming Language for Interacting with the World. Advanced Undergraduate Project, MIT Media Lab.
- [6] Gilbert Louis Bernstein and Wilmot Li. 2015. Lillicon: Using Transient Widgets to Create Scale Variations of Icons. Transactions on Graphics (TOG) (2015).
- [7] Alan Borning. 1981. The Programming Language Aspects of ThingLab. Transactions on Programming Languages and Systems (TOPLAS) (October 1981).
- [8] Sarah E. Chasins, Maria Mueller, and Rastislav Bodik. 2018. Rousillon: Scraping Distributed Hierarchical Web Data. In Symposium on User Interface Software and Technology (UIST).
- [9] Salman Cheema, Sumit Gulwani, and Joseph LaViola. 2012. QuickDraw: Improving Drawing Experience for Geometric Diagrams. In Conference on Human Factors in Computing Systems (CHI).
- [10] Ravi Chugh, Brian Hempel, Mitchell Spradlin, and Jacob Albers. 2016. Programmatic and Direct Manipulation, Together at Last. In Conference on Programming Language Design and Implementation (PLDI).
- [11] Allen Cypher, Daniel C. Halbert, David Kurlander, Henry Lieberman, David Maulsby, Brad A. Myers, and Alan Turransky (Eds.). 1993. Watch What I Do: Programming by Demonstration. MIT Press.
- [12] Bogdan Dit, Michael Wagner, Shasha Wen, Weilin Wang, Mario Linares Vásquez, Denys Poshyvanyk, and Huzefa H. Kagdi. 2014. ImpactMiner: A Tool for Change Impact Analysis. In International Conference on Software Engineering, Companion Proceedings (ICSE-C).
- [13] Jonathan Edwards, Jodie Chen, and Alessandro Warth. 2016. Live End-User Programming. In LIVE Workshop.
- [14] Kevin Ellis, Daniel Ritchie, Armando Solar-Lezama, and Josh Tenenbaum. 2018. Learning To Infer Graphics Programs From Hand-Drawn Images. In Conference on Neural Information Processing Systems (NIPS).
- [15] Evan Czaplicki. 2012-2019. Elm. http://elm-lang.org.
- [16] Tim Felgentreff, Alan Borning, Robert Hirschfeld, Jens Lincke, Yoshiki Ohshima, Bert Freudenberg, and Robert Krahn. 2014. Babelsberg/JS - A Browser-Based Implementation of An Object Constraint Language. In European Conference on Object-Oriented Programming (ECOOP).
- [17] Malcom Gethers, Bogdan Dit, Huzefa Kagdi, and Denys Poshyvanyk. 2012. Integrated Impact Analysis for Managing Software Changes. In International Conference on Software Engineering (ICSE).
- [18] Michael Gleicher and Andrew Witkin. 1994. Drawing with Constraints. The Visual Computer: International Journal of Computer Graphics (1994).
- [19] Anthony C. Hearn. 1968. REDUCE: A User-Oriented Interactive System for Algebraic Simplification. In Interactive Systems for Experimental Applied Mathematics. Academic Press.
- [20] Brian Hempel and Ravi Chugh. 2016. Semi-Automated SVG Programming via Direct Manipulation. In Symposium on User Interface Software and Technology (UIST).
- [21] Allan Heydon and Greg Nelson. 1994. The Juno-2 Constraint-Based Drawing Editor. In Technical Report 131a, Digital Systems Research, Digital Equipment Corporation.
- [22] R. Nicholas Jackiw and William F. Finzer. 1993. The Geometer’s Sketchpad: Programming by Geometry. In Watch What I Do: Programming by Demonstration. MIT Press.
- [23] Jennifer Jacobs, Sumit Gogia, Radomír Mech, and Joel R. Brandt. 2017. Supporting Expressive Procedural Art Creation Through Direct Manipulation. In Proceedings of the 2017 CHI Conference on Human Factors in Computing Systems, Denver, CO, USA, May 06-11, 2017.
- [24] David Kurlander. 1993. Graphical Editing by Example. Ph.D. Dissertation. Columbia University.
- [25] Kevin Kwok and Guillermo Webster. 2016. Carbide Alpha. https://alpha.trycarbide.com/.
- [26] Henry Lieberman. 1993a. Mondrian: A Teachable Graphical Editor. In Watch What I Do: Programming by Demonstration. MIT Press.
- [27] Henry Lieberman. 1993b. Tinker: A Programming By Demonstration System for Beginning Programmers. In Watch What I Do: Programming by Demonstration. MIT Press.
- [28] John H. Maloney and Randall B. Smith. 1995. Directness and Liveness In the Morphic User Interface Construction Environment. In Symposium on User Interface Software and Technology (UIST).
- [29] David L. Maulsby, Ian H. Witten, and Kenneth A. Kittlitz. 1989. Metamouse: Specifying Graphical Procedures by Example. In Conference on Computer Graphics and Interactive Techniques (SIGGRAPH).
- [30] Mikaël Mayer, Viktor Kunčak, and Ravi Chugh. 2018. Bidirectional Evaluation with Direct Manipulation. Proceedings of the ACM on Programming Languages (PACMPL), Issue OOPSLA (2018).
- [31] Mikaël Mayer, Gustavo Soares, Maxim Grechkin, Vu Le, Mark Marron, Oleksandr Polozov, Rishabh Singh, Benjamin Zorn, and Sumit Gulwani. 2015. User Interaction Models for Disambiguation in Programming by Example. In Symposium on User Interface Software and Technology (UIST).
- [32] McDirmid, Sean. 2015. A Live Programming Experience. In Future Programming Workshop, Strange Loop. https://onedrive.live.com/download?cid=51C4267D41507773&resid=51C4267D41507773%2111492&authkey=AMwcxdryTyPiuW8 https://www.youtube.com/watch?v=YLrdhFEAiqo.
- [33] McDirmid, Sean. 2016. The Future of Programming will be Live. In Curry On. https://www.youtube.com/watch?v=bnqkglrSqrg.
- [34] Guy Pierra, Jean-Claude Potier, and Patrick Girard. 1996. The EBP System: Example Based Programming System for Parametric Design. In Modelling and Graphics in Science and Technology. Springer Berlin Heidelberg.
- [35] Richard Potter and David Maulsby (Eds.). 1993. A Test Suite for Programming by Demonstration. In Watch What I Do: Programming by Demonstration. MIT Press.
- [36] Veselin Raychev, Max Schäfer, Manu Sridharan, and Martin Vechev. 2013. Refactoring with Synthesis. In Object-Oriented Programming, Systems, Languages, and Applications (OOPSLA).
- [37] Schachman, Toby. 2012. Recursive Drawing. Master’s thesis. New York University Interactive Telecommunications Program. http://recursivedrawing.com/.
- [38] Schachman, Toby. 2015. Apparatus. http://aprt.us/.
- [39] Robin Schreiber, Robert Krahn, Daniel H. H. Ingalls, and Robert Hirschfeld. 2016. Transmorphic: Mapping Direct Manipulation to Source Code Transformations.
- [40] Christopher Schuster and Cormac Flanagan. 2016. Live Programming by Example: Using Direct Manipulation for Live Program Synthesis. In LIVE Workshop.
- [41] Ben Shneiderman. 1983. Direct Manipulation: A Step Beyond Programming Languages. Computer (August 1983).
- [42] Armando Solar-Lezama. 2008. Program Synthesis by Sketching. Ph.D. Dissertation. UC Berkeley.
- [43] Ivan Sutherland. 1963. Sketchpad, A Man-Machine Graphical Communication System. Ph.D. Dissertation. MIT.
- [44] William Robert Sutherland. 1966. The On-line Graphical Specification of Computer Procedures. Ph.D. Dissertation. Massachusetts Institute of Technology.
- [45] Victor, Bret. 2013. Drawing Dynamic Visualizations. http://worrydream.com/#!/DrawingDynamicVisualizationsTalk.
- [46] Helge von Koch. 1904. Sur une courbe continue sans tangente, obtenue par une construction géométrique élémentaire. Arkiv för Matematik, Astronomi och Fysik 1 (1904), 681–704.
- [47] Xiaoyin Wang, Lu Zhang, Tao Xie, Yingfei Xiong, and Hong Mei. 2012. Automating Presentation Changes in Dynamic Web Applications via Collaborative Hybrid Analysis. In International Symposium on the Foundations of Software Engineering (FSE).
- [48] World Wide Web Consortium (W3C). Scalable Vector Graphics (SVG) 1.1 (Second Edition). http://www.w3.org/TR/SVG11/.
- [49] Haijun Xia, Bruno Araújo, Tovi Grossman, and Daniel J. Wigdor. 2016. Object-Oriented Drawing. In Conference on Human Factors in Computing Systems (CHI).
- [50] Kuat Yessenov, Ivan Kuraj, and Armando Solar-Lezama. 2017. DemoMatch: API Discovery from Demonstrations. In Conference on Programming Language Design and Implementation (PLDI).
8 Appendix
We provide a few additional details about our design and implementation; discuss examples from prior work [20]; and describe two examples from Figure 15 in more detail.
8.1 Type Inference
Because Sketch-n-Sketch designs are ordinary programs, custom functions that produce shapes can be incorporated as new drawing tools in the user interface. Any function that takes two points as input—or one point and a horizontal and/or vertical distance—is exposed as a custom drawing tool.
To determine which numbers represent horizontal/vertical distances and to provide reasonable default values for e.g. colors and stroke widths, type inference tags each type with a set of zero or more inferred roles. Functions in the standard library (the bottom portion of Figure 1a) have role annotations in their type declarations. By using these functions, role information enters the program and propagates via type inference, usually obviating the need for manual annotation. A similar scheme called brands (implemented via named mixin traits) is used in [32], although we additionally apply certain built-in usage rules—e.g. that a number added to an X value must be a HorizontalDistance—to infer roles in more cases.
8.2 Value Holes
Tagging values with provenance enables a helpful trick that we use to implement several of the new transformations (most notably the snap-drawing): to indicate that a particular program location should somehow evaluate to a particular value, we transiently insert that value as a leaf in the abstract syntax tree. Before displaying the program, each such value hole is filled by inspecting the provenance of the value and choosing an expression that evaluates to the value (usually by using or introducing a variable). This internal workflow has been an effective way to express and resolve equality constraints within template code.
8.3 Specifying the Focused Expression
A focused function and call are denoted by special comments, automatically inserted into the program. Comments, unlike internal expression identifiers, are preserved across arbitrary text edits to the program.
8.4 Completing the Examples from the Prior Sketch-n-Sketch
Our prior work [20] presented three examples that require text edits both in the prior system and ours. Below, we discuss the additional features that would be required to complete these tasks entirely via output-directed manipulations.
Two of the remaining examples in [20] utilize paths (“Garden Logo” and “Coffee Mug”). Unneeded by our examples, we disabled the path tool pending internal updates to allow path drawing to work with snaps. Besides a path tool, a Rewrite as Offsets tool would be useful to rewrite the coordinates of selected points to be computed relative to an anchor point (akin to the domain-specific rewriting performed by the prior Group tool). “Garden Logo” would also benefit from special tooling for mirrored drawing across a vertical symmetry line.
The third remaining example (“Snip Polygon”) relied on special tooling to draw a polygon with its points positioned relative to a bounding box. That tooling was discarded along with the pervasive bounding box parameterization and would have to be restored (perhaps as a Rewrite Relative to Bounds tool). Additionally, to fully develop the design without text edits, Sketch-n-Sketch would need an output-directed mechanism for specifying min/max calculations.
8.5 Example (xii): Tree Branch
Tools highlighted: Draw Offset, Repeat Over List
To demonstrate offset widgets and repetition tools, we describe part of the tree branch task shown in Figure 15ii. The overarching strategy is to build a rhombus abstracted over its center, and then repeat it over a list of points to form the leaves. We omit mentioning uses of Rename.
The rhombus is constructed around a central point using offsets drawn with the “Point or Offset” tool. Offset amounts may snap to each other while drawing, which inserts a variable for the shared offset amount (halfW and halfH below).
We then draw a polygon snapped to the offset endpoints and Abstract the resulting rhombus into a function parameterized over [x, y], halfW, and halfH. We will attach instances of this function over the branch.
![[Uncaptioned image]](/html/1907.10699/assets/branchWithDeadspace.png)
![[Uncaptioned image]](/html/1907.10699/assets/branchWithAttachmentPts.png)
![[Uncaptioned image]](/html/1907.10699/assets/branchWithLeaves.png)
The branch construction is shown at right. On top of a brown polygon, two “deadspace” offsets are drawn inwards from the ends of the branch to form the start and end locations of the attachment points for the leaves. Between these locations we draw the pointsBetweenSepBy standard library function that returns points separated from their neighbors by a fixed distance. With this particular function, making our branch longer will add more leaves rather than spacing them out.
Finally, to repeat our leaf rhombus over the points, we first select the one copy of the rhombus and invoke the Repeat Over List tool to repeat over the attachment points we just drew. This tool creates a new function abstracted over just a single point (rhombusFunc2 below) and maps that function over our leafAttachmentPts, completing our leafy branch.
8.6 Example (xiii): Target
Tools highlighted: Repeat by Indexed Merge, Fill Hole
Repeating over a point list allows copies of shapes to vary in their spacial positions, but not over any other attributes such as size or color. To support other repetition scenarios where the varying attributes could be calculated from an index (i.e. 0, 1, 2, …), we offer a workflow which we now briefly demonstrate by the construction of a target (Figure 15iii).
To start, we draw three concentric circles snapped to the same center point and change the color of the middle circle.
After selecting the three circles, we invoke Repeat by Indexed Merge, from which we select the second of two results (which differs from the first only in that it adds the reverse call seen below, so that i 0 for the smallest circle).
The program maps an anonymous function that takes an index (\i -> ...) over the list [2,1,0]; each index is thus transformed into one of the circles. The anonymous function is a syntactic merger of the original three circle definitions.
Their differences—radius and color—have been turned into what we call programming-by-example (PBE) holes, represented by ??(...). The first PBE hole above
can be read as “the first time this expression is executed it should return 0, the second time it is executed it should return 466, and the third time 0”.
![[Uncaptioned image]](/html/1907.10699/assets/targetHole1Fillings.png)
![[Uncaptioned image]](/html/1907.10699/assets/targetHole2Fillings.png)
Sketch-n-Sketch employs sketch-based synthesis [42] to resolve these holes.
As shown at right, all suggested fillings involve i, the only variable
that differs in the execution environments.
For the first hole, we choose the mod i 2 == 0! conditional to obtain alternating colors. For the second we choose the only option, a expression, to calculate the radii of our circles. Similar to the Koch snowflake, the inserted code zeroTo 3{0-15} contains a slider annotation allowing us to manipulate the number of circles.
Figure 15xiii shows five circles for the final design.