Larger than Valley Polarization of Free Carriers
in Singly-Oriented Single Layer on Au(111)
Abstract
We employ time- and angle-resolved photoemission spectroscopy to study the spin- and valley-selective photoexcitation and dynamics of free carriers at the and ′ points in singly-oriented single layer . Our results reveal that in the valence band maximum an ultimate valley polarization of free holes of can be achieved upon excitation with circularly polarized light at room temperature. Notably, we observe a significantly smaller valley polarization for the photoexcited free electrons in the conduction band minimum. Clear differences in the carrier dynamics between electrons and holes imply intervalley scattering processes into dark states being responsible for the efficient depolarization of the excited electron population.
Semiconducting single layer transition metal dichalcogenides (SL TMDCs) are promising platforms for future opto-valleytronic and opto-spintronic applications Wang et al. (2012); Butler et al. (2013); Xu et al. (2014); Mak and Shan (2016). The remarkable properties of these materials arise from the presence of a direct band gap at the and ′ valleys in combination with a lack of structural inversion symmetry and strong spin-orbit coupling. Valley and spin degrees of freedom are strongly coupled so that a valley-selective excitation of spin-polarized carriers upon absorption of circularly polarized light becomes possible Xiao et al. (2012); Cao et al. (2012); Zeng et al. (2012); Mak et al. (2012) [Fig. 2(a)].
Experimentally, the unique properties of SL TMDCs were studied predominantly by all-optical techniques providing particular insights into the intriguing exciton physics of these materials Mak et al. (2010); Splendiani et al. (2010); Chernikov et al. (2015); Yang et al. (2015); Rivera et al. (2016); Christiansen et al. (2017). For the investigation of free carrier processes it is advantageous to alternatively apply photoemission techniques, which can provide the energy, momentum and spin sensitivity required to map out the ground and excited state electronic band structure and their properties Riley et al. (2014); Hein et al. (2016); Bruix et al. (2016); Wallauer et al. (2016); Waldecker et al. (2017).
The direct study of SL TMDCs by photoemission spectroscopy relies, however, on high quality TMDC layers with typical sizes in the mm2-regime. Bottom-up growth techniques allow for the production of such types of samples and were, for instance, successfully applied for the preparation of SL TMDCs on single crystalline noble metal substrates Grønborg et al. (2015); Dendzik et al. (2015). Previous angle-resolved photoemission spectroscopy (ARPES) and time-resolved ARPES (trARPES) studies of such samples revealed insights into the electronic structure and the ultrafast free carrier dynamics Grønborg et al. (2015); Grubišić Čabo et al. (2015). Furthermore, it was possible to demonstrate optical control of the spin and valley degrees of freedom using circularly polarized light Ulstrup et al. (2017). A critical drawback of these samples is, however, the presence of mirror domains Lehtinen et al. (2015), which show an inversion of the and ′ points. As photoemission experiments intrinsically average over these domains, effects due to an optically induced spin and valley selectivity become reduced or completely masked. A quantitative interpretation of such data is therefore difficult or even impossible.
This Letter reports on a trARPES study of a singly-oriented layer of WS2 epitaxially grown on . The single orientation character of the sample with a maximum of contribution of mirror domains was demonstrated in a comprehensive study on the structural properties Bignardi et al. (2019).
This unique property makes it possible to gain quantitative information on the valley selectivity of free carrier excitation using circularly polarized light.
We show that in the valence band maximum (VBM) a valley polarization of free holes of can be generated. Remarkably, the free electron valley polarization in the conduction band minimum (CBM) is lower with a value of . We consider intervalley scattering processes between and ′ being responsible for this reduction, which are strongly enhanced in the conduction band (CB) due to an almost vanishing spin splitting. Differences in the observed depopulation rates of excited carriers between CBM and VBM support this interpretation.
The singly-oriented SL WS2/ sample was grown with a coverage of about at the SuperESCA beamline of the Elettra Synchrotron radiation facility in Trieste Bignardi et al. (2019). The sample was transported to the Kiel trARPES system in an evacuated tube and cleaned by laser annealing under ultrahigh vacuum (UHV) conditions using laser pulses ( pulse width) at an incident fluence of several mJcm-2. The procedure was applied until ARPES spectra of the characteristic band structure of WS2 did not show any further changes. TrARPES experiments were performed using the output of a Ti:sapphire multipass amplifier. Near-resonant excitation at the and ′ points of WS2 was achieved at an incident fluence of using () pump pulses generated in a non-collinear optical parametric amplifier. The polarization of the pump pulses was adjusted with a zero-order quarter-wave plate (QWP). A Stokes polarimeter was used for the quantitative characterization of the polarization state of the pulses. ARPES probe spectra were recorded with an energy resolution of using p-polarized pulses delivered from a high harmonic generation (HHG) source Eich et al. (2014) and using a hemispherical analyzer. Pump and probe pulses were focused almost collinearly at near-normal incidence onto the sample. Cross correlation measurements at the sample position yielded a time resolution of (FWHM). All experiments were performed at a pressure of and a sample temperature of .
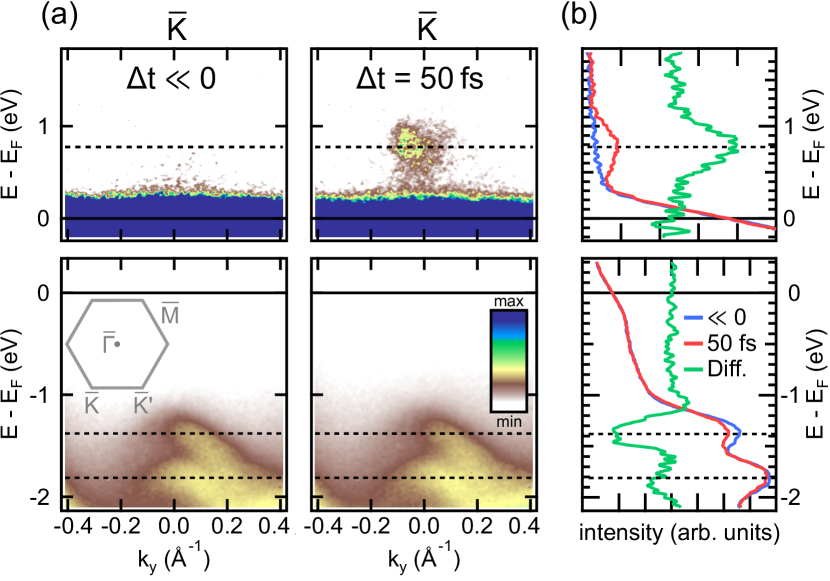
Figure 1(a) compares trARPES data of the sample around before (negative pump-probe delay ) and during () the optical excitation with linearly polarized pump pulses. In both spectra one can clearly distinguish the spin-split upper and lower valence bands (UVB/LVB) below (bottom panels). The additional signal at for energies (top panels) results from the transient population of the conduction band at the CBM due to the optical excitation. Energy distribution curves (EDCs) derived from the data in Fig. 1(a) are shown in Fig. 1(b). A difference spectrum calculated from the EDCs (green line) furthermore uncovers a transient depletion of the carrier population near the UVB maximum. A finite, but much weaker depletion is also visible for the LVB.
Quantitative analysis of the spectra yields a direct gap of and an energy splitting between UVB and LVB of Sup . Both values are in very good agreement with earlier experiments Dendzik et al. (2015); Ulstrup et al. (2017); Eickholt et al. (2018) and indicate a resonant excitation between upper VBM and CBM at the used photon energy of . The observed depletion of the LVB can be associated with a transition into gap states near Gong et al. (2014); Liu et al. (2013).
A recent trARPES study of the semiconducting bulk TMDC 2H-MoSe2 reported additionally on the observation of transient excitonic signatures Buss et al. (2017). In our case, screening due to the free carriers of the supporting gold substrate efficiently suppresses the formation of bound excitons Ugeda et al. (2014). Furthermore, the presented experiments are performed at an excitation density well above the threshold for an excitonic Mott transition in SL WS2 Chernikov et al. (2015).
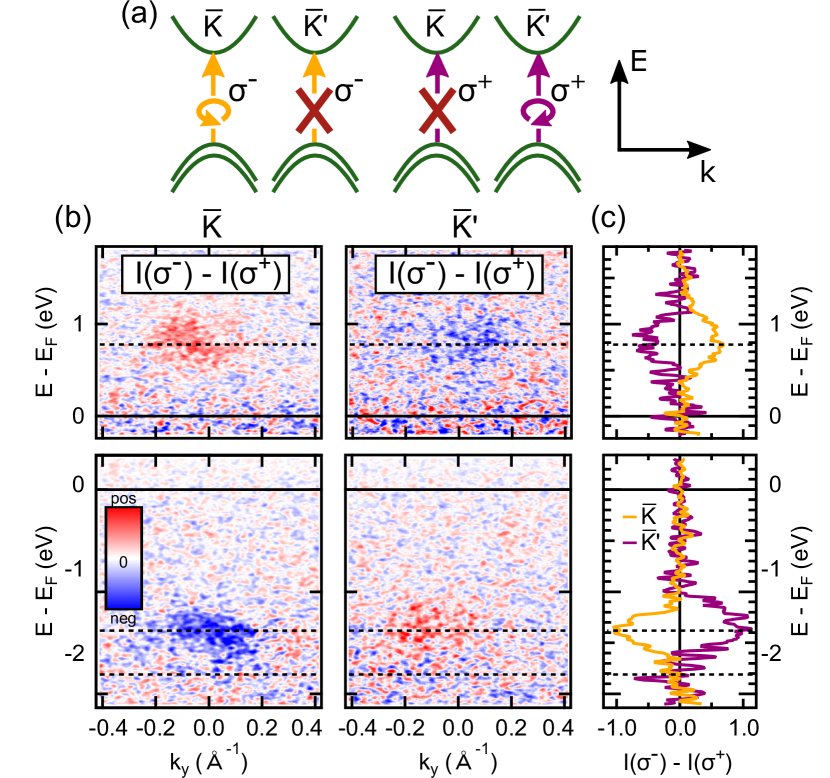
Photoinduced valley-selectivity within the WS2 layer is demonstrated by comparing transient ARPES spectra at (′) recorded after excitation with right () and left () circularly polarized pump pulses, respectively. The specific delay was chosen so that the transient intensity becomes maximum, see Fig. 4(a). Difference intensity maps generated from these spectra are shown in Fig. 2(b). The data confirms the presence of a strong circular dichroism both in the CB and in the valence band (VB). The contrast is inverted between the and ′ points, as expected from the optical selection rules. In the VB a dichroism is only observed in the UVB, but is absent in the LVB, as can be seen particularly clearly in the difference EDCs shown in Fig. 2(c).
The experimental data presented so far confirm the qualitative findings of a related study on a SL WS2/Ag(111) sample that exhibited a preferential, but not single domain orientation Ulstrup et al. (2017). In the following, we will show that the single orientation character of our sample allows also for a quantitative determination of the valley polarization that ultimately can be generated upon optical excitation.
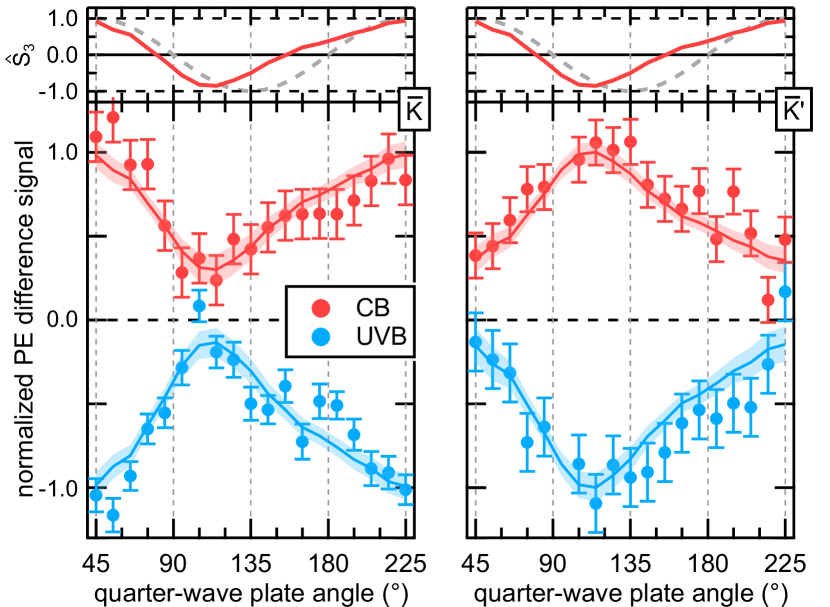
In the further investigations we performed pump polarization scans with the angle of the QWP in the pump beam varied over a range of in steps of . Results are summarized in Fig. 3, which shows normalized integral photoemission intensities for of the CBM (red) and the upper VBM (blue) as a function of the QWP angle. As expected for a dichroic response, we observe distinct maxima and minima as the circular polarization state is changed. The inversion of the traces at and ′ is in agreement with the valley selectivity of the excitation process shown above. Notably, the traces exhibit a clear asymmetry with respect to the QWP angle, shifting the extrema expected at by approximately . The polarization scan allows to quantify the circular dichroism in the photoemission signal with and being the maxima and minima in the photoemission signal, respectively. The analysis yields circular dichroism values of for the UVB and for the CB. Surprisingly, the circular dichroisms in the photoemission signal from UVB and CB clearly differ.
Further quantitative analysis of the data relies on a detailed characterization of the changes in the circular polarization state of the pump pulse as the QWP angle is changed. Measurements were performed with the Stokes polarimeter and are presented and discussed in detail in the Supplemental Material Sup . The upper panels of Fig. 3 show the evaluated normalized Stokes parameter of the pump pulses at the sample position as a function of the QWP angle. We observe a distinct asymmetry in the data, which can be traced back to the reflection from the final deflection mirror mounted inside the UHV chamber Sup . Additionally, the quantitative analysis of the data yields a maximum absolute value for the normalized Stokes parameter of , i.e., it is not possible in this configuration to observe a circular dichroism of . A comparison with the ARPES data in Fig. 3 implies that part of the observed peculiarities in the photoemission polarization scans directly reflect the circular polarization state of the pump pulse.
The Stokes polarimeter results enable us to evaluate the fraction of carriers excited according to the optical selection rules and from this the degree of valley polarization . For a given fraction of preferentially oriented domains, the changes in the integrated photoemission signal at the point during a pump polarization scan can be described by the relation Sup
| (1) |
Here, denotes the degree of circular polarization of the pump pulse with () corresponding to purely () polarized light.
The solid lines in Fig. 3 show fits of Eq. 1 to the experimental data with being the only free fitting parameter yielding for the UVB and for the CB. The value for was determined from the Stokes polarimeter data and was set here to accounting for a perfectly oriented WS2 layer. We conclude that upon excitation with purely circularly polarized laser pulses an almost perfect valley selective hole population in the UVB can be prepared. The observed value of for the UVB results in a valley polarization . Note that in the presence of mirror domains this value can only increase. For the limiting case of a contribution of mirror domains () Bignardi et al. (2019) we obtain (). For comparison, for the valley polarization of A excitons in semiconducting SL TMDCs, theory predicts , which in this case is limited by coherent intervalley coupling Berghäuser et al. (2018).
The analysis of the CB data yields ( for the limiting case of ). In agreement with the observed differences in the circular dichroism, these values are significantly smaller than what we evaluated for the UVB. The analysis of time-resolved photoemission data presented in the following section provides further insights into the origin of this difference.
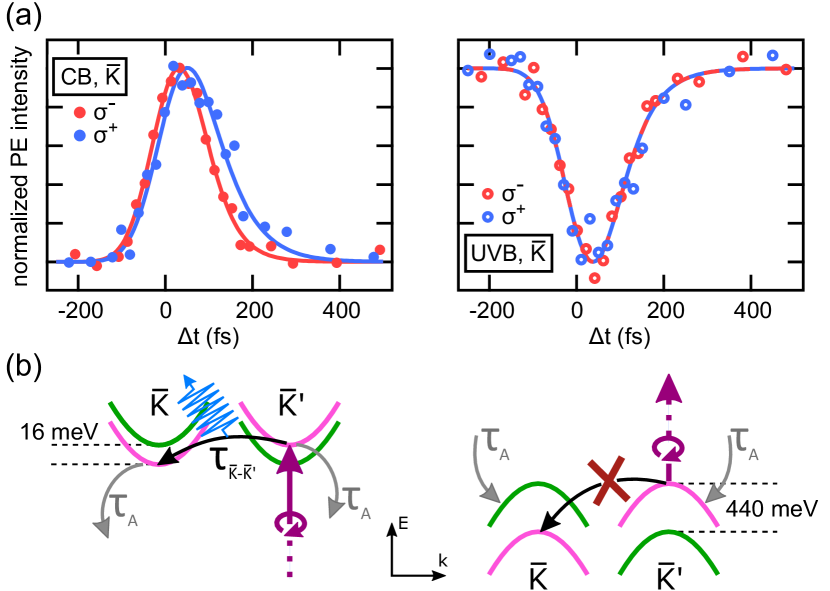
Figure 4(a) compares normalized photoemission intensity transients for CBM and upper VBM deduced from trARPES data at the point with the QWP set to and , i.e., for excitation with predominantly and polarized pump pulses, respectively. Note that despite the optical selection rules we observe for both cases a finite transient signal at due to the not perfectly circularly polarized light of the pump pulse, potential contributions from mirror domains, and a value of . The overall temporal evolution of the transients reflects the excited carrier population and relaxation dynamics, with the latter one being largely governed by Auger-type processes due to interaction with charge carriers in the gold substrate Grubišić Čabo et al. (2015). Notably, for the CBM we observe clear differences in the temporal evolution for and excitation. This implies a distinct delay in the population of the CB valley at for the case of a predominant photoexcitation at ′ (using light). We conclude that for this excitation scenario the CB valley at becomes in large part populated indirectly, and therefore delayed, by intervalley scattering from ′. This indirect excitation additionally reduces the overall valley selectivity during the finite duration of the excitation process in our experiment. In contrast, the temporal evolution of the UVB transients remains unchanged upon switching from to excitation. In both cases the transient hole population in the UVB directly results from the photoexcitation process. If present at all, contributions from intervalley scattering processes are negligibly slow Mai et al. (2014a, b).
The distinct differences in the spin-orbit splitting between VB and CB, as illustrated in Fig. 4(b), can account for the differences in the observed dynamics. The small spin-orbit splitting at the CBM of only Eickholt et al. (2018) opens up spin-conserving intervalley scattering channels for photoexcited electrons from ′ into the energetically lower dark states at via phonon emission processes, as indicated by the black arrow in Fig. 4(b) Jin et al. (2014); Hinsche et al. (2017). For photoexcited holes at the upper VBM this channel is efficiently blocked due to the large spin-orbit splitting of , which considerably exceeds the maximum phonon energy in the system. Therefore, we propose that this spin-conserving intervalley scattering channel is responsible for the observed accelerated depopulation at the directly photoexcited CBM and the reduction in the valley polarization in the CB in comparison to the VB.
The intervalley scattering rate can be determined from a rate equation analysis of the photoemission intensity transients of the CB and VB Sup . Fits of the rate equation model to the experimental data are added for comparison as solid lines in Fig. 4(a). The fits to the VB data yield a characteristic depopulation time constant , independent of whether the direct () or the indirect () excitation scenario is considered. This value is in good quantitative agreement with results reported for other SL TMDCs on noble metal substrates Grubišić Čabo et al. (2015); Ulstrup et al. (2017) and can be associated with the population decay due to Auger-type interaction processes with carriers in the gold substrate. is used as an input for the fits to the CB data, making the intervalley scattering time constant, , the only free fitting parameter. These fits give a value of . Notably, this value agrees well with the typical timescales on the order of predicted from theory for the formation of momentum forbidden intervalley dark excitons in W-based SL TMDCs due to electron-phonon interaction Selig et al. (2018, 2016).
In summary, our trARPES study of SL WS2/ shows a very high valley polarization in the excited state photoemission signal. This observation confirms the absence of structural mirror domains in the studied WS2 layer, as was shown in a previous study of the investigated sample Bignardi et al. (2019).
On a closer look, we find that the valley polarization of free holes in the upper VB considerably exceeds the value for the free electrons in the CB. Substantial differences in the transient evolution of the CB intensity point to a coupling channel between and ′ that is not available for the excited carriers in the VB. This behavior can be explained by the different spin-orbit splitting of VB and CB. The herein reported valley polarization of at room temperature shows that free hole excitations in SL WS2 can be particularly attractive for future opto-spintronic applications.
Acknowledgements.
This work was supported by the German Research Foundation (DFG) through project BA 2177/10-1. We gratefully acknowledge funding from VILLUM FONDEN through the Centre of Excellence for Dirac Materials (Grant. No. 11744) and the Danish Council for Independent Research, Natural Sciences under the Sapere Aude program (Grant No. DFF-4002-00029).References
- Wang et al. (2012) Q. H. Wang, K. Kalantar-Zadeh, A. Kis, J. N. Coleman, and M. S. Strano, Nat. Nanotechnol. 7, 699 (2012).
- Butler et al. (2013) S. Z. Butler, S. M. Hollen, L. Cao, Y. Cui, J. A. Gupta, H. R. Gutiérrez, T. F. Heinz, S. S. Hong, J. Huang, A. F. Ismach, E. Johnston-Halperin, M. Kuno, V. V. Plashnitsa, R. D. Robinson, R. S. Ruoff, S. Salahuddin, J. Shan, L. Shi, M. G. Spencer, M. Terrones, W. Windl, and J. E. Goldberger, ACS Nano 7, 2898 (2013).
- Xu et al. (2014) X. Xu, W. Yao, D. Xiao, and T. F. Heinz, Nat. Phys. 10, 343 (2014).
- Mak and Shan (2016) K. F. Mak and J. Shan, Nat. Photonics 10, 216 (2016).
- Xiao et al. (2012) D. Xiao, G. B. Liu, W. Feng, X. Xu, and W. Yao, Phys. Rev. Lett. 108, 196802 (2012).
- Cao et al. (2012) T. Cao, G. Wang, W. Han, H. Ye, C. Zhu, J. Shi, Q. Niu, P. Tan, E. Wang, B. Liu, and J. Feng, Nat. Commun. 3, 887 (2012).
- Zeng et al. (2012) H. Zeng, J. Dai, W. Yao, D. Xiao, and X. Cui, Nat. Nanotechnol. 7, 490 (2012).
- Mak et al. (2012) K. F. Mak, K. He, J. Shan, and T. F. Heinz, Nat. Nanotechnol. 7, 494 (2012).
- Mak et al. (2010) K. F. Mak, C. Lee, J. Hone, J. Shan, and T. F. Heinz, Phys. Rev. Lett. 105, 136805 (2010).
- Splendiani et al. (2010) A. Splendiani, L. Sun, Y. Zhang, T. Li, J. Kim, C.-Y. Chim, G. Galli, and F. Wang, Nano Lett. 10, 1271 (2010).
- Chernikov et al. (2015) A. Chernikov, C. Ruppert, H. M. Hill, A. F. Rigosi, and T. F. Heinz, Nat. Photonics 9, 466 (2015).
- Yang et al. (2015) J. Yang, T. Lü, Y. W. Myint, J. Pei, D. Macdonald, J. C. Zheng, and Y. Lu, ACS Nano 9, 6603 (2015).
- Rivera et al. (2016) P. Rivera, K. L. Seyler, H. Yu, J. R. Schaibley, J. Yan, D. G. Mandrus, W. Yao, and X. Xu, Science 351, 688 (2016).
- Christiansen et al. (2017) D. Christiansen, M. Selig, G. Berghäuser, R. Schmidt, I. Niehues, R. Schneider, A. Arora, S. M. de Vasconcellos, R. Bratschitsch, E. Malic, and A. Knorr, Phys. Rev. Lett. 119, 187402 (2017).
- Riley et al. (2014) J. M. Riley, F. Mazzola, M. Dendzik, M. Michiardi, T. Takayama, L. Bawden, C. Granerod, M. Leandersson, T. Balasubramanian, M. Hoesch, T. K. Kim, H. Takagi, W. Meevasana, P. Hofmann, M. S. Bahramy, J. W. Wells, and P. D. C. King, Nat. Phys. 10, 835 (2014).
- Hein et al. (2016) P. Hein, A. Stange, K. Hanff, L. X. Yang, G. Rohde, K. Rossnagel, and M. Bauer, Phys. Rev. B 94, 205406 (2016).
- Bruix et al. (2016) A. Bruix, J. A. Miwa, N. Hauptmann, D. Wegner, S. Ulstrup, S. S. Grønborg, C. E. Sanders, M. Dendzik, A. Grubišić Čabo, M. Bianchi, J. V. Lauritsen, A. A. Khajetoorians, B. Hammer, and P. Hofmann, Phys. Rev. B 93, 165422 (2016).
- Wallauer et al. (2016) R. Wallauer, J. Reimann, N. Armbrust, J. Güdde, and U. Höfer, Appl. Phys. Lett. 109, 162102 (2016).
- Waldecker et al. (2017) L. Waldecker, R. Bertoni, H. Hübener, T. Brumme, T. Vasileiadis, D. Zahn, A. Rubio, and R. Ernstorfer, Phys. Rev. Lett. 119, 036803 (2017).
- Grønborg et al. (2015) S. S. Grønborg, S. Ulstrup, M. Bianchi, M. Dendzik, C. E. Sanders, J. V. Lauritsen, P. Hofmann, and J. A. Miwa, Langmuir 31, 9700 (2015).
- Dendzik et al. (2015) M. Dendzik, M. Michiardi, C. Sanders, M. Bianchi, J. A. Miwa, S. S. Grønborg, J. V. Lauritsen, A. Bruix, B. Hammer, and P. Hofmann, Phys. Rev. B 92, 245442 (2015).
- Grubišić Čabo et al. (2015) A. Grubišić Čabo, J. A. Miwa, S. S. Grønborg, J. M. Riley, J. C. Johannsen, C. Cacho, O. Alexander, R. T. Chapman, E. Springate, M. Grioni, J. V. Lauritsen, P. D. C. King, P. Hofmann, and S. Ulstrup, Nano Lett. 15, 5883 (2015).
- Ulstrup et al. (2017) S. Ulstrup, A. Grubišić Čabo, D. Biswas, J. M. Riley, M. Dendzik, C. E. Sanders, M. Bianchi, C. Cacho, D. Matselyukh, R. T. Chapman, E. Springate, P. D. C. King, J. A. Miwa, and P. Hofmann, Phys. Rev. B 95, 041405(R) (2017).
- Lehtinen et al. (2015) O. Lehtinen, H.-P. Komsa, A. Pulkin, M. B. Whitwick, M.-W. Chen, T. Lehnert, M. J. Mohn, O. V. Yazyev, A. Kis, U. Kaiser, and A. V. Krasheninnikov, ACS Nano 9, 3274 (2015).
- Bignardi et al. (2019) L. Bignardi, D. Lizzit, H. Bana, E. Travaglia, P. Lacovig, C. E. Sanders, M. Dendzik, M. Michiardi, M. Bianchi, M. Ewert, L. Buß, J. Falta, J. I. Flege, A. Baraldi, R. Larciprete, P. Hofmann, and S. Lizzit, Phys. Rev. Materials 3, 014003 (2019).
- Eich et al. (2014) S. Eich, A. Stange, A. V. Carr, J. Urbancic, T. Popmintchev, M. Wiesenmayer, K. Jansen, A. Ruffing, S. Jakobs, T. Rohwer, S. Hellmann, C. Chen, P. Matyba, L. Kipp, K. Rossnagel, M. Bauer, M. M. Murnane, H. C. Kapteyn, S. Mathias, and M. Aeschlimann, J. Electron Spectrosc. 195, 231 (2014).
- (27) See Supplemental Material for additional information on the band positions, the Stokes polarimeter, equation (1) and the rate equation model, which includes Berry et al. (1977); Schaefer et al. (2007).
- Berry et al. (1977) H. G. Berry, G. Gabrielse, and A. E. Livingston, Appl. Optics 16, 3200 (1977).
- Schaefer et al. (2007) B. Schaefer, E. Collett, R. Smyth, D. Barrett, and B. Fraher, Am. J. Phys. 75, 163 (2007).
- Eickholt et al. (2018) P. Eickholt, C. Sanders, M. Dendzik, L. Bignardi, D. Lizzit, S. Lizzit, A. Bruix, P. Hofmann, and M. Donath, Phys. Rev. Lett. 121, 136402 (2018).
- Gong et al. (2014) C. Gong, L. Colombo, R. M. Wallace, and K. Cho, Nano Lett. 14, 1714 (2014).
- Liu et al. (2013) D. Liu, Y. Guo, L. Fang, and J. Robertson, Appl. Phys. Lett. 103, 183113 (2013).
- Buss et al. (2017) J. H. Buss, F. Joucken, J. Maklar, H. Wang, Y. Xu, R. Unni, C. Ko, S. Tongay, J. Wu, and R. A. Kaindl, in Conference on Lasers and Electro-Optics, (2017) p. FTh1F.6.
- Ugeda et al. (2014) M. M. Ugeda, A. J. Bradley, S.-F. Shi, F. H. da Jornada, Y. Zhang, D. Y. Qiu, W. Ruan, S.-K. Mo, Z. Hussain, Z.-X. Shen, F. Wang, S. G. Louie, and M. F. Crommie, Nat. Mater. 13, 1091 (2014).
- Berghäuser et al. (2018) G. Berghäuser, I. Bernal-Villamil, R. Schmidt, R. Schneider, I. Niehues, P. Erhart, S. Michaelis de Vasconcellos, R. Bratschitsch, A. Knorr, and E. Malic, Nat. Commun. 9, 971 (2018).
- Mai et al. (2014a) C. Mai, Y. G. Semenov, A. Barrette, Y. Yu, Z. Jin, L. Cao, K. W. Kim, and K. Gundogdu, Phys. Rev. B 90, 041414(R) (2014a).
- Mai et al. (2014b) C. Mai, A. Barrette, Y. Yu, Y. G. Semenov, K. W. Kim, L. Cao, and K. Gundogdu, Nano Lett. 14, 202 (2014b).
- Jin et al. (2014) Z. Jin, X. Li, J. T. Mullen, and K. W. Kim, Phys. Rev. B 90, 045422 (2014).
- Hinsche et al. (2017) N. F. Hinsche, A. S. Ngankeu, K. Guilloy, S. K. Mahatha, A. Grubišić, M. Bianchi, M. Dendzik, C. E. Sanders, J. A. Miwa, H. Bana, E. Travaglia, P. Lacovig, L. Bignardi, R. Larciprete, A. Baraldi, S. Lizzit, K. S. Thygesen, and P. Hofmann, Phys. Rev. B 96, 121402(R) (2017).
- Selig et al. (2018) M. Selig, G. Berghäuser, M. Richter, R. Bratschitsch, A. Knorr, and E. Malic, 2D Mater. 5, 035017 (2018).
- Selig et al. (2016) M. Selig, G. Berghäuser, A. Raja, P. Nagler, C. Schüller, T. F. Heinz, T. Korn, A. Chernikov, E. Malic, and A. Knorr, Nat. Commun. 7, 13279 (2016).