Path Loss Models for V2V mmWave Communication: Performance Evaluation and Open Challenges
Abstract
Recently, millimeter wave (mmWave) bands have been investigated as a means to enhance automated driving and address the challenging data rate and latency demands of emerging automotive applications. For the development of those systems to operate in bands above 6 GHz, there is a need to have accurate channel models able to predict the peculiarities of the vehicular propagation at these bands, especially as far as Vehicle-to-Vehicle (V2V) communications are concerned. In this paper, we validate the channel model that the 3GPP has proposed for NR-V2X systems, which (i) supports deployment scenarios for urban/highway propagation, and (ii) incorporates the effects of path loss, shadowing, line of sight probability, and static/dynamic blockage attenuation. We also exemplify the impact of several automotive-specific parameters on the overall network performance considering realistic system-level simulation assumptions for typical scenarios. Finally, we highlight potential inconsistencies of the model and provide recommendations for future measurement campaigns in vehicular environments.
Index Terms:
V2V communications; millimeter wave (mmWave); channel model; performance evaluation.I Introduction
Over the past few years, the advance towards enhanced automated driving relying on high levels of connectivity has motivated the automotive industry to investigate new radio access technologies as a tool to enable vehicular communications. In particular, the millimeter wave (mmWave) frequencies offer the potential of multi-gigabit-per-second data transmission rates and therefore represent a promising opportunity to support advanced automotive applications [1, 2].
In this regard, the 3rd Generation Partnership Project (3GPP) has recently developed some functionalities to provide enhancements of the traditional communication standards for both Vehicle-to-Vehicle (V2V) and Vehicle-to-Network (V2N) communications, starting with the 3GPP Release-16 Study Item (SI) on NR-V2X [3]. These developments include NR-based sidelink design and enhancements of Release-15 NR uplink/downlink for advanced V2X services in both sub-6 GHz and mmWave bands. From a physical-layer perspective, the channel has been designed to be optimized for uses under 52.6 GHz and with the potential to be used for above 52.6 GHz (including therefore mmWave transmissions) [4]. However, frequencies above 52.6 GHz face more difficult challenges than conventional bands, e.g., severe propagation and penetration loss and strong power spectral density regulatory requirements [5], thereby calling for innovative channel modeling and design solutions [6]. While measurement campaigns in mmWave V2N scenarios have been quite widespread (e.g., [7]), measurements in the V2V context are still very limited, and realistic scenarios are indeed hard to simulate. For example, Takahashi et al., in [8], have conducted measurements in crowded roads to characterize the mmWave propagation in V2V networks, although validation through more accurate experimental equipment is needed. Yamamoto et al., in [9], have also conducted some measurements to obtain a general characterization of the V2V channel at 60 GHz, but the model does not consider urban propagation, nor does it distinguish between static and dynamic blockage. The measurements in [10] (with modified antenna heights) can be a starting point of discussion for the definition of a V2V channel model in above-6 GHz scenarios, although the parameters are derived from cellular measurements which might not be fully representative of a vehicular system due to the more challenging propagation characteristics of highly mobile vehicular nodes. Some other measurements were conducted for frequencies between 450 MHz and 6 GHz, but did not include any empirical confirmation for use at mmWaves [11].
Along these lines, the 3GPP has recently specified how to model the V2V channel at mmWave frequencies [12]. In particular, distinctions between environmental and vehicular blockages, as well as between urban and highway propagation scenarios, have been proposed. However, before the model can be adopted as a feasible solution to simulate V2V propagation, it is fundamental to evaluate its performance in realistic vehicular scenarios, a research issue that, to date, has not yet been thoroughly addressed. In this paper, we provide the first numerical validation of the 3GPP V2V path loss model for nodes operating at mmWaves. Moreover, we exemplify the impact of several automotive-specific parameters, such as the antenna array size and the vehicular traffic density, on the overall network performance, which is assessed in terms of packet reception ratio. To this end, we consider an extension of the 3GPP model, proposed in [13], which, unlike the 3GPP model, characterizes density-dependent propagation. Finally, we highlight potential model limitations that should be overcome by future measurements in vehicular environments, such as the dynamics of the channel, the Doppler spread with directional antennas, the impact of the antenna placement, the traffic density, and the delay spread.
| Path Loss Probability | Highway scenario | Urban scenario | ||
| m | m | |||
|
|
|
|||
|
||||
| Probability | Density | Highway scenario: | Urban scenario: | |||
| a | b | c | ||||
| Low | ||||||
| Medium | ||||||
| High | ||||||
| Low | ||||||
| Medium | ||||||
| High | ||||||
| Low | ||||||
| Medium | ||||||
| High | ||||||
|
||||||
II V2V mmWave Path Loss Modeling
The first step towards proper vehicular protocol design is a deep understanding of the propagation model. In this section, we describe the path loss characterization that the 3GPP is considering for V2V mmWave communications.
II-A LOS/NLOS Probability
In V2V systems, the path loss is modeled according to the following three states [12]:
-
1.
Line of Sight (LOS), i.e., the propagation path is not blocked by vehicles nor environmental objects.
-
2.
Vehicle Non Line of Sight (NLOSv), i.e., the LOS path is blocked by dynamic blockages (e.g., other vehicles).
-
3.
Non Line of Sight (NLOS), i.e., the LOS path is blocked by environmental blockages (e.g., buildings).
The LOS and NLOSv probabilities, i.e., and , are defined in [12, Table 6.2-1] and reported in Table I.
Although the model distinguishes between urban and highway scenarios (respectively denoted with superscripts and throughout the paper), it does not differentiate between different densities of vehicular traffic. Moreover, the determination of the NLOS state is deterministic, i.e., it is based on purely geometric considerations which evaluate whether the V2V link is blocked or not by buildings, therefore a closed-form expression for the NLOS probability, i.e., , is not currently provided. As we will numerically demonstrate in Sec. III-B, such assumptions reduce the accuracy of the analysis and might result in misleading conclusions.
| Scenario | LOS path loss () | NLOSv path loss () | NLOS path loss () |
| Urban | PL | ||
| Highway | |||
In this paper, we therefore consider an extension of the path loss probability equations presented above based on [13], as summarized in Table II. The model in [13] (i) characterizes low, medium, and high densities of the vehicular traffic in both urban and highway scenarios, and (ii) introduces a probabilistic model for the NLOS probability as a function of the inter-vehicle distance (the longer the link, the more likely to intersect one or more blockages). In order to have realistic mobility traces for the vehicles in the considered environments, the authors in [13] have used Simulation of Urban MObility (SUMO) [14], an open-source road traffic simulator designed to handle and model the traffic of large road networks. The LOS/NLOSv/NLOS classification is finally provided by GEMV2, a freely available vehicular propagation modeling software which performs geometry-based blockage analyses based on the outlines of buildings and vehicles.
II-B LOS Path Loss
As soon as the different communication states have been identified, the path loss follows a dual-slope piecewise-linear model, which is deemed suitable to represent the real propagation in a vehicular environment. For LOS transmissions, the path loss depends on the inter-vehicle distance and the considered scenario, and is computed as reported in Table III:
| (1) |
In Eq. (1), is in GHz and is in meters. represents the shadowing, i.e., the effect of signal power fluctuations due to surrounding objects, and is modeled according to a lognormal random variable with standard deviation dB [15].
For above 6 GHz propagation, oxygen absorption is modeled introducing additional loss which is derived based on [10], i.e., PL dB. At 60 GHz, dB/km.
II-C NLOSv/NLOS Path Loss
The 3GPP characterizes the NLOSv and NLOS path loss equations as illustrated in Table III, but does not distinguish between urban and highway scenarios in case of NLOS.
a) NLOSv: The model provides the additional attenuation factor to be summed to the LOS path loss. is modeled according to a lognormal random variable with mean and standard deviation . Different values of and are obtained for different vehicle dropping strategies.
-
•
If the minimum between the antenna height of the TX and the RX is larger than the blocker height, ;
-
•
If the maximum between the antenna height of the TX and the RX is smaller than the blocker height, dB and dB;
-
•
For all the remaining configurations, dB and dB.
The NLOSv path loss is finally computed as:
| (2) |
b) NLOS: A frequency-dependent NLOS equation is defined (and valid for both urban and highway scenarios), i.e.,
| (3) |
where is in GHz, is in meters, and the shadowing component is modeled according to a lognormal random variable with standard deviation dB [15].
As mentioned, for above 6 GHz propagation, oxygen absorption is modeled based on [10], i.e., PL dB.
| Parameter | Value | Description |
| m | {Urban, highway} lane width | |
| {Urban, highway} number of lanes | ||
| {5, 13} m | {Type 2, Type 3} vehicle length | |
| {2, 2.6} m | {Type 2, Type 3} vehicle width | |
| {1.6, 3} m | {Type 2, Type 3} vehicle height | |
| {1.6, 3} m | {Type 2, Type 3} antenna height | |
| dBm | Transmission power | |
| GHz | Total bandwidth | |
| GHz | Carrier frequency | |
| NF | 13 dB | Noise figure |
| Antenna array size | ||
III Performance Evaluation
In this section, we review the methodology defined in [12] for assessing the performance of vehicular networks, and validate the 3GPP V2V path loss model proposed for nodes operating at mmWaves through system-level simulations.
III-A Evaluation Methodology
a) Evaluation Scenarios. The channel characteristics are heavily influenced by the proprieties of the environment in which the vehicles are deployed, i.e., urban or highway. The parameters regarding the road configuration for both scenarios are taken from [12, Table A-1]: for the urban (highway) case, () lanes per directions are assumed, where each lane has width m ( m).
b) Vehicle Characteristics. Three types of vehicles are defined according to the 3GPP [12, Sec. 6.1.2]: Type 1 and Type 2 vehicles are passenger cars with bumper and rooftop antenna position, respectively, while Type 3 vehicles are large trucks or buses. The vehicle type may potentially affect the path loss equation (since the antenna height is determined according to the type of vehicle), the loss caused by the blocking vehicle, and the radiation pattern. In our analysis we consider both Type 2 and Type 3 deployments.
c) Vehicle Dropping Models. Vehicles are dropped according to a random process, so that the distance between the rear bumper of a vehicle and the front bumper of the following vehicle in the same lane is equal to , where and is the average speed [12, Sec. 6.1.2].
d) System-Level Simulation Parameters. The simulation parameters are based on the system-design considerations specified in [12, Sec. 6.1.1] and are summarized in Table IV. For mmWave links, the central frequency is set to 63 GHz while the total bandwidth is set to 1 GHz. The vehicles’ noise figure is set to 13 dB and the transmit power is set to 21 dBm. In order to establish directional transmissions, vehicles are equipped with Uniform Planar Arrays (UPAs) of elements. For above 6 GHz propagation, the maximum value of is currently set to 32 [12, Tab. 6.1.4-12]. For completeness, in our study we also consider omnidirectional mmWave transmissions, i.e., . Our results are finally derived through a Monte Carlo approach as a function of the inter-vehicle distance , with varying from 2 m to 500 m.
III-B Performance Results
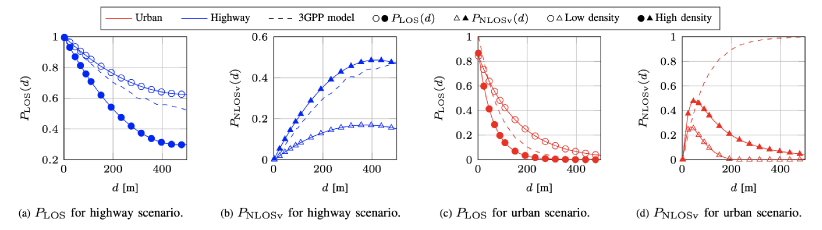
Path Loss Probabilities. In Fig. 1 we plot the LOS and NLOSv probabilities vs. considering both the 3GPP model [12] (which does not distinguish between low- and high-traffic densities) and the extended model [13]. As foreseen, the LOS probability is significantly higher in case of highway deployments than in urban scenarios since the signal usually propagates in free space. Moreover, it is clear that the impact of different density regimes is not negligible (the gap is particularly evident for large distances). While, for the NLOSv case, the 3GPP model behaves as in a high-density scenario, for the LOS case it operates as in a low-density scenario, thereby setting a lower bound to the path loss. For the urban case, peaks at around m and then starts decreasing for larger values of when the model in [13] is considered. In fact, although the probability of both dynamic and static blockages potentially obstructing the propagation path between the endpoints increases with , [13] assumes that the channel condition is categorized as NLOS when the line of sight is blocked by both vehicles and buildings. The 3GPP model [12], instead, does not make this distinction and shows a monotonically increasing trend.
Path Loss. The following results are derived considering the extended model in [13]. The 3GPP model, in fact, does not define a closed-form expression for the NLOS probability and prevents a complete stochastic analysis for the path loss, which has to be based on geometric simulations instead. In Fig. 2 we plot the path loss as a function of . Different densities of vehicular traffic and vehicle deployment options are considered. We see that, for the LOS case (Fig. 2a), the 3GPP model registers better propagation in urban rather than highway scenario (i.e., around 5 dB at 200 m). In fact, while in the highway environment the propagating signals attenuate over distance following Friis’ law, in the urban environment the observed path loss is significantly lower, indicating a waveguide effect resulting from the more likely reflections from walls of static blockages in street canyons.
From Fig. 2b, we observe that, for the NLOSv case, the path loss slightly decreases when deploying both Type 2 and Type 3 vehicles, i.e., when tall vehicles (e.g., trucks) are deployed. In fact, although Type 3 blockage implies higher attenuation, larger vehicle heights may guarantee higher LOS probability when the obstacle is small.
Moreover, we see that the NLOS path loss is generally more than 20 dB higher than its NLOSv counterpart, demonstrating the much stronger impact of static/environmental blockages like buildings or vegetation, compared to dynamic obstructions like pedestrians and cars, on the received signal strength. We recall that the 3GPP model does not distinguish between urban and highway propagation for the NLOS case.
Finally, Fig. 2c measures the overall path loss as a function of . We observe that the urban path loss is significantly higher than its highway counterpart (although the waveguide effect caused by the more likely signal reflections and scattering in street canyons generally results in reduced attenuation) due to the much higher probability of blockage intersection in contrast to free-space propagation. Furthermore, the higher the vehicle density, the more probable the NLOSv state and, therefore, the larger the overall sidelink path loss.
Packet Reception Ratio. The performance of the vehicular network can be assessed in terms of average Packet Reception Ratio (PRR), [12, Sec. 6.1.6], which measures the percentage of vehicles experiencing successful packet reception. In this paper, successful reception is achieved if the Signal to Noise Ratio (SNR) experienced between the transmitting and receiving vehicles is above a predefined threshold, taken to be dB in our simulations. Fig. 3 plots the PRR vs. , for different antenna array configurations. We observe that higher PRR is guaranteed when considering short-range communications, since the endpoints are progressively closer, thus ensuring stronger received power. Moreover, we see that the PRR is unacceptably low (PRR ) in case of omnidirectional transmissions (i.e., ) for both urban and highway scenarios, thereby exemplifying how single-antenna communications should be avoided in a mmWave context. On the other hand, the PRR increases in case of directional transmissions, thanks to the high gains produced by beamforming. The benefits are particularly evident considering highway propagation, thanks to the much lower path loss that is generally experienced.
IV Open Challenges
The mmWave bands hold great promise to support cooperative driving applications because of the large available bandwidth which may provide the required link capacity. Before unleashing the potential of this technology, it is important to demonstrate the feasibility of designing mmWave-aware strategies in a vehicular context. In this regard, the 3GPP has recently proposed a model for the V2V channel at mmWaves whose accuracy, however, has not yet been fully examined. Motivated by these considerations, in this paper we provided the first numerical validation of the 3GPP V2V path loss model for nodes operating at mmWaves considering realistic system-level simulation parameters.
Although the results presented in the above sections provide some valuable insights into the propagation characteristics of the mmWave signals in a vehicular scenario, there remain many open problems which call for innovative modeling and design solutions. A list of relevant challenges includes the following aspects.
-
•
Propagation Scenario. It has been observed that the distance dependency of the path loss has remarkable sensitivity to the surrounding environment. In this regard, the 3GPP distinguishes between urban and highway propagation only in case of LOS transmissions, and does not provide a closed-form expression for the NLOS probability. A broader classification of the different propagation scenarios might be necessary.
-
•
Vehicular traffic density. Currently, the 3GPP model does not distinguish between different densities of vehicular traffic. Also considering the extended model in [13], Fig. 2c demonstrates that the difference between density regimes is limited (i.e., in the order of 2-3 dB) and, in case of urban propagation, only affects short-range communications. On the other hand, uncrowded roads have been proven to have the lowest path loss and path loss variation among all the environments (e.g., the increase in the path loss variation due to heavier traffic on crowded roads was experimentally measured to be above 10 dB [8]). Density-dependent path loss characterizations should therefore be provided.
-
•
Blockage Characteristics and Number of Blockers. While in the 3GPP model the size of the obstructing vehicle has negligible effects (see Fig. 2b), the blockage loss difference between small and large vehicles has been shown to range from 1 to 6 dB at high frequencies [16]. Moreover, while the 3GPP considers a single intermediate vehicle located midway between the transmitting and the receiving vehicle in case of NLOSv, adding a second blocking vehicle in addition to the first one might lead to significantly increased blockage loss (e.g., more than 5 dB at 60 GHz [17]). Such effects should be included in V2V channel models.
-
•
Antenna Placement. Although a rooftop position for the vehicle antennas was observed to provide optimal coverage, at mmWaves the self-blockage effect caused by the curvature of the roof raises questions about whether rooftop positions are preferable to bumper locations [18].
-
•
Temporal and Spatial Correlation. The lack of temporally and spatially correlated channel measurements in the mmWave band significantly limits the level of detail that can be achieved in simulations, as it becomes impossible to make a clear assessment about how the dynamics of the channel affect the network performance.
-
•
Use of Directional Antennas. The effects of directional transmissions have not been numerically characterized by currently available channel measurements, which make use of isotropic antennas with the assumption of unit gain or of horn antennas with fixed pointing direction. It has also been reported that the delay spread decreases with narrow beams, but measurements in a vehicular context are lacking [19].
-
•
Fading Statistics. The statistics of the small-scale fading at mmWave frequencies are vital to describe the fluctuations of the received power over time and to model deviations from the power predicted by the simple path loss equations. Such measurements also enable the study of the correlation among signals in a multipath environment, which is known to have significant impact on the system performance. Most existing measurement campaigns model large-scale path loss parameters, while a complete characterization of the fading statistics in a vehicular environment has received little attention so far and deserves further investigation.
References
- [1] F. Boccardi, R. W. Heath, A. Lozano, T. L. Marzetta, and P. Popovski, “Five disruptive technology directions for 5G,” IEEE Communications Magazine, vol. 52, no. 2, pp. 74–80, February 2014.
- [2] V. Va, T. Shimizu, G. Bansal, and R. W. Heath, “Millimeter wave vehicular communications: A survey,” Foundations and Trends® in Networking, vol. 10, no. 1, pp. 1–113, 2016.
- [3] 3GPP, “New SID on NR V2X (Release 16),” RP-181480, 2018.
- [4] ——, “Study on NR beyond 52.6 GHz (Release 16),” RP-181435, 2018.
- [5] T. S. Rappaport, R. W. Heath Jr, R. C. Daniels, and J. N. Murdock, Millimeter wave wireless communications. Pearson Education, 2014.
- [6] M. Giordani, A. Zanella, and M. Zorzi, “Millimeter wave communication in vehicular networks: Challenges and opportunities,” in 6th International Conference on Modern Circuits and Systems Technologies (MOCAST), May 2017.
- [7] A. Kato, K. Sato, and M. Fujise, “ITS wireless transmission technology. Technologies of millimeter-wave inter-vehicle communications: Propagation characteristics,” Journal of the Communications Research Laboratory, vol. 48, pp. 99–110, March 2001.
- [8] S. Takahashi, A. Kato, K. Sato, and M. Fujise, “Distance dependence of path loss for millimeter wave inter-vehicle communications,” in IEEE 58th Vehicular Technology Conference (VTC-Fall), Oct 2003.
- [9] A. Yamamoto, K. Ogawa, T. Horimatsu, A. Kato, and M. Fujise, “Path-loss prediction models for intervehicle communication at 60 GHz,” IEEE Trans. on Vehicular Technology, vol. 57, no. 1, pp. 65–78, Jan 2008.
- [10] 3GPP, “Study on channel model for frequencies from 0.5 to 100 GHz (Release 14),” TR 38.901, 2018.
- [11] A. F. Molisch, F. Tufvesson, J. Karedal, and C. F. Mecklenbrauker, “A survey on vehicle-to-vehicle propagation channels,” IEEE Wireless Communications, vol. 16, no. 6, pp. 12–22, Dec 2009.
- [12] 3GPP, “Study on evaluation methodology of new Vehicle-to-Everything V2X use cases for LTE and NR (Release 15),” TR 37.885, 2019.
- [13] M. Boban, X. Gong, and W. Xu, “Modeling the evolution of line-of-sight blockage for V2V channels,” in IEEE 84th Vehicular Technology Conference (VTC-Fall), 2016.
- [14] D. Krajzewicz, J. Erdmann, M. Behrisch, and L. Bieker, “Recent development and applications of SUMO - Simulation of Urban MObility,” International Journal on Advances in Systems and Measurements, vol. 5, no. 3&4, pp. 128–138, December 2012.
- [15] 3GPP, “Study on LTE-based V2X services (Release 14),” TR 36.885, 2016.
- [16] M. Boban, D. Dupleich, N. Iqbal, J. Luo, C. Schneider, R. Müller, Z. Yu, D. Steer, T. Jämsä, J. Li, and R. S. Thomä, “Multi-Band Vehicle-to-Vehicle Channel Characterization in the Presence of Vehicle Blockage,” IEEE Access, vol. 7, pp. 9724–9735, Jan 2019.
- [17] 3GPP, “V2X sidelink measurement results,” Huawei, HiSilicon – Tdoc R1-1801398, 2018.
- [18] C. F. Mecklenbrauker, A. F. Molisch, J. Karedal, F. Tufvesson, A. Paier, L. Bernadó, T. Zemen, O. Klemp, and N. Czink, “Vehicular channel characterization and its implications for wireless system design and performance,” Proceedings of the IEEE, vol. 99, no. 7, pp. 1189–1212, Feb 2011.
- [19] V. Va, J. Choi, and R. W. Heath, “The impact of beamwidth on temporal channel variation in vehicular channels and its implications,” IEEE Transactions on Vehicular Technology, vol. 66, no. 6, pp. 5014–5029, November 2017.