Unusual phase boundary of the magnetic-field-tuned valence transition in CeOs4Sb12
Abstract
The phase diagram of the filled skutterudite CeOs4Sb12 has been mapped in fields of up to 60 T and temperatures down to 0.5 K using resistivity, magnetostriction, and MHz conductivity. The valence transition separating the semimetallic low-, low- phase from the metallic high-, high- phase exhibits a very unusual, wedge-shaped phase boundary, with a non-monotonic gradient alternating between positive and negative. The expected “elliptical” behavior of the phase boundary of a valence transition with originates in the and dependence of the free energy of the multiplet. Here, quantum oscillation measurements suggest that additional energy scales associated with a quantum critical point are responsible for the deviation of the phase boundary of CeOs4Sb12 from this text-book behavior at high and low . The distortion of the low-, high- portion of the phase boundary may be associated with the proximity of CeOs4Sb12 to a topological semimetal phase induced by uniaxial stress.
I Introduction
Valence transitions, in which -electrons undergo a temperature and/or magnetic-field driven transformation from itinerant to quasi-localized, are associated with significant changes in material properties Ho et al. (2016); Koskenmaki and Gschneider (1978); Drymiotis et al. (2005) and dramatic alterations to the Fermi surface Ho et al. (2016); Dzero et al. (2000). Perhaps the best-known is the transition in Ce and its alloys, which leads to a spectacular sample volume collapse Koskenmaki and Gschneider (1978); Drymiotis et al. (2005). Valence transitions are also thought to be responsible for the onset of the “hidden order phase” of URu2Si2, plus some phase boundaries of elemental Pu Harrison and Jaime (2019); Lashley et al. (2003); Harrison et al. (2019). A key identifying feature of valence transitions is the resulting elliptical phase boundary in which the critical magnetic field and temperature of the valence transition follow a behavior (upper inset of Fig. 1) or, in other words, lie on a straight line when plotted as versus , with the slope determined by the -factor alone Dzero et al. (2000).
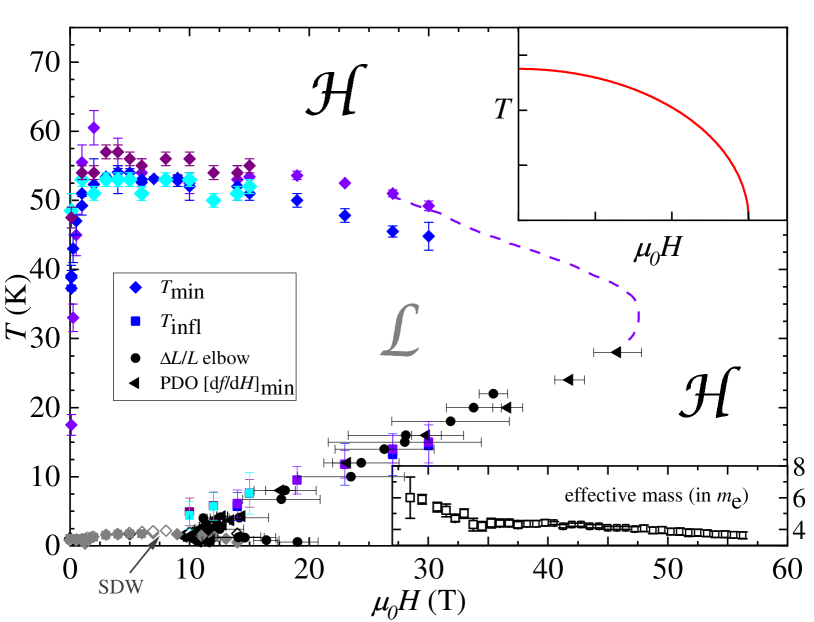
By contrast, we show here that the valence transition in CeOs4Sb12, identified by its effect on the Fermi surface and material properties Ho et al. (2016), does not follow the above textbook elliptical behavior. We performed MHz conductivity, magnetostriction and resistivity measurements on CeOs4Sb12, to map out the phase diagram shown in Fig 1. The valence transition separates the low-, low-, semimetallic phase and the high-, high-, metallic phase Ho et al. (2016); it is immediately obvious that it behaves very unconventionally, falling back to lower as and lower as . We suggest this unusual behavior is due to sensitivity of the groundstates of CeOs4Sb12 to quantum fluctuations, and proximity to a topological semimetallic phase.
CeOs4Sb12 is part of an interesting series of rare-earth-based filled skutterudites including the unconventional superconductor PrOs4Sb12 Bauer et al. (2002); B. Maple et al. (2002) and ferromagnetic NdOs4Sb12 Ho et al. (2016, 2005). While PrOs4Sb12 and NdOs4Sb12 possess similar Fermi surfaces comprising multiple pockets (but different effective masses), CeOs4Sb12 exhibits a valence transition from the heavy-effective-mass (Sommerfeld coefficient ) semimetallic phase Bauer et al. (2001a); Sugawara et al. (2005); Harima and Takegahara (2003); Yan et al. (2012) to the phase, characterized by a simple, almost spherical Fermi surface with a light effective mass Ho et al. (2016).
Earlier studies Bauer et al. (2001a) suggested CeOs4Sb12 to be a Kondo insulator due to the resistivity increase at low temperatures but band-structure calculations for the -phase have confirmed the semimetallic, gapless groundstate with heavy masses under ambient conditions and predict the system to become a topological semimetal or topological Kondo insulator under applied strain Harima and Takegahara (2003); Yan et al. (2012).
Antiferromagnetic order, believed to be due to spin-density wave (SDW) formation, was observed in CeOs4Sb12 below 1 K at Namiki et al. (2003); Yogi et al. (2005); Yang et al. (2006). The transition temperature, , was seen to increase with increasing field to 2 K at 7 T and subsequently decrease Ho et al. (2016); Sugawara et al. (2005); Rotundu and Andraka (2006) and be suppressed around 15 T.
In Ref. Ho et al. (2016), an attempt to trace the high-temperature limits of the boundary was made using contours, where is the magnetization. However, subsequent experiments suggested that was not an accurate indicator of the valence transition, prompting the current comprehensive series of measurements that reveal the much more unusual behavior shown in Fig. 1.
Our choice of techniques for clarifying the phase boundary is based on previous experimental evidence of the valence transition in cerium-based systems. The strongest indicator of this valence transition is the drastic change in unit cell volume. Magnetostriction measurements indicating the change in sample length as a function of field can very sensitively detect such volume changes and allow for a precise determination of the critical field of the phase transition. Due to the ratio of 1:17 of cerium to other elements in CeOs4Sb12 we expect a smooth rather than a sharp structural transition as in elemental or slightly doped cerium Koskenmaki and Gschneider (1978); Drymiotis et al. (2005).
Electrical resistivity (and related methods like MHz conductivity measurements) have been shown to be another reliable indicator of the valence transition in cerium and its alloys: hysteretic behavior in resistivity as a function of temperature or pressure in Ce0.8La0.1Th0.1 Thompson et al. (1983); Drymiotis et al. (2005), or CeNi Gignoux and Voiron (1985) occurs at the valence transition due to inhomogeneous strain fields in the sample associated with the cell volume collapse.
II Experimental details
CeOs4Sb12 single crystals were prepared using a molten-flux technique Bauer et al. (2001a) with Sb excess (details can be found in Ho et al. (2016)). Several single crystals (cubic space group (Im), No. 204) were obtained from the same growth batch. Four bar-shaped crystals (samples B1–B4) were used to measure standard four-probe resistivity with the current applied along the [100] axis.
Magnetic fields up to 15 T (30 T) were provided by superconducting (water-cooled resistive) magnets. A Proximity-Detector-Oscillator (PDO) technique was used for contactless (MHz) resistivity measurements in pulsed magnetic fields. Shifts in the PDO frequency are caused by alterations in the sample skin depth Ghannadzadeh et al. (2011); Altarawneh et al. (2009), leading to for small relative changes in Ghannadzadeh et al. (2011). Magnetostriction was measured in pulsed fields by the Fiber Bragg Grating technique Jaime et al. (2017). The magnetic field was applied along [001] for all measurements.
III Results
III.1 Resistivity - Temperature-sweeps at fixed field
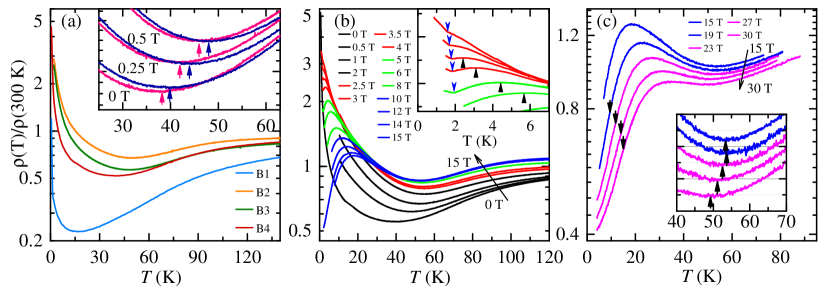
Fig. 2 (a) shows for crystals B1–B4 at zero field. In agreement with previous studies Bauer et al. (2001a); Sugawara et al. (2005), resistivity initially decreases upon cooling, reaching a minimum at . Below this temperature, increases strongly. The minimum in has previously been interpreted as the transition Ho et al. (2016). In contrast to that earlier work, our study shows that the exact value of at is strongly sample-dependent, ranging from 17.5 K to 48.5 K for the four crystals measured. Similar sample-dependent variations in the low-temperature magnetic and transport properties of other Ce-based skutterudites were observed in Meisner et al. (1985) and Bauer et al. (2001b), and attributed to a delicate balance between competing scattering effects and the influence of magnetic impurities. A more detailed discussion on the sample dependence in our measurements is provided in section IV.3.
Note that there is a small but consistent hysteresis between cooling and warming through the minimum, with being higher on cooling than on warming [inset of Fig. 2 (a)]. The difference increases with temperature-sweep rate, but it is always non-zero even for the slowest temperature changes. With decreasing temperature-sweep rate converges to indicating that it originates from a phase transition rather than a lag in thermal equilibrium.
As mentioned in the introduction, similar hysteretic behavior in was observed close to the valence transition in Ce-based materials Thompson et al. (1983); Gignoux and Voiron (1985); Drymiotis et al. (2005) but also close to the valence transitions in YbInCu4 Immer et al. (1997), supporting the proposal Ho et al. (2016) that the valence of Ce in CeOs4Sb12 changes at .
The shape of the curves changes significantly when a magnetic field is applied. Fig. 2 (b) shows normalized resistivity curves for sample B4 for fields up to 15 T. Increasing the magnetic field initially shifts the position of the minimum to higher temperatures; subsequently, is almost field independent between 3 and 15 T, but then decreases [inset of Fig. 2 (c)] for higher fields.
The transition to the ordered SDW phase manifests itself by a the kink in the curve, marked by down arrows in the inset of Fig. 2 (b). Similar features were observed at the transition to the SDW in earlier measurements Sugawara et al. (2005), and the behavior of in our data accords with the results in Sugawara et al. (2005).
For , a local maximum develops at temperature just above [up arrows in the inset of Fig. 2 (b)] and moves higher with increasing field. shows an almost linear field dependence (open diamonds in Fig. 4); in addition, as grows, the () maximum becomes broader and lower. These trends continue for fields up to 30 T [Fig. 2 (c)].
As will be clear from Fig. 1, for fields higher than 10 T, it is possible for a temperature sweep at constant field to traverse the valence transition twice: , followed by . In this context, the maximum at is a precursor that occurs before the restoration of metallic behavior at low and high but it does not indicate a phase transition. No hysteresis was observed around the maximum supporting the interpretation that the valence does not change at . For , we find a inflection point at below which metallic resistivity ()= is obeyed. It is this inflection point that we attribute to the valence transition. is marked by down arrows in Fig. 2 (c) and indicated by solid squares in Figs. 1 and 4. For fields between 3.5 T, where the maximum first emerges, and , the SDW phase interposes itself and is not visible. Nevertheless, within the region between and , CeOs4Sb12 begins to revert to metallic behavior (i.e., falls as decreases).
III.2 MHz Resistivity and Magnetostriction at fixed temperatures in pulsed magnetic fields
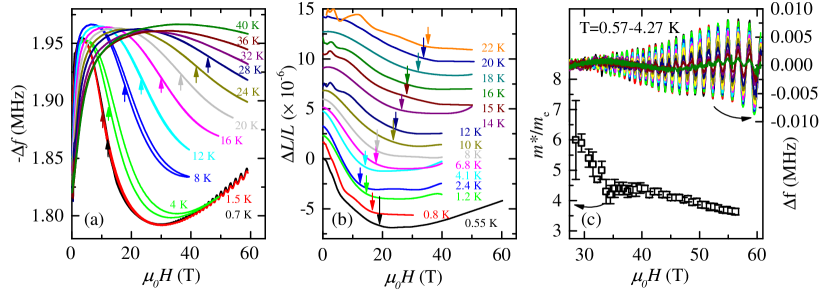
We will now turn to the high-, low- part of the phase boundary that partially coincides with the SDW phase suppression. It was initially identified using PDO experiments for K Ho et al. (2016). Here, we use the same technique to track the transition to higher temperatures. Fig. 3 (a) shows the PDO frequency change in CeOs4Sb12 in fields up to 60 T and temperatures between 0.7 and 40 K. For low temperatures a pronounced maximum exists at low fields, followed by a sharp decrease of and a minimum at high fields. Since is proportional to , we can analyse the PDO data in an analogous manner to the data. The maxima in both properties have the same field dependence, and the PDO maximum continues to move linearly to higher fields with increasing temperature. As in the data, the maximum is the precursor of a change from semimetallic behavior ( phase) to metallic character ( phase) and not a phase transition. The succeeding drop in (or ) is commensurate with removing Ce -electrons from the semimetallic groundstate with its ultra-heavy effective masses, the resulting Fermi energy shift producing the larger, almost-spherical Fermi surface (with light-mass quasiparticles) of the phase predicted by theory and observed in experiment Harima and Takegahara (2003); Yan et al. (2012); Ho et al. (2016). As in Ref. Ho et al. (2016), we identify the transition as the inflection point within the fall in [arrows in Fig. 3 (a)]. Hysteresis occurs between PDO data recorded with rising and falling field, again suggestive of the lossy kinetics typical of valence transitions Drymiotis et al. (2005).
Magnetostriction measurements were carried out in pulsed magnetic fields up to 60 T and for temperatures between 0.5 and 40 K in order to track sample volume changes that accompany the valence transition Koskenmaki and Gschneider (1978); Dzero et al. (2000); Drymiotis et al. (2005). Typical results are shown in Fig. 3 (b) as fractional change in length () versus field. The phase transition is marked by a change of slope: the initial decrease of slows down and is reversed or becomes flat, causing an elbow in the data. Note that only one in 17 atoms in CeOs4Sb12 is cerium which is expected to lead to a smoother structural transition compared to elemental or slightly doped cerium Koskenmaki and Gschneider (1978); Drymiotis et al. (2005).
Linear functions are fitted to the data below and above the elbow; the transition field is defined as the point at which the gradient of the data is equal to the mean gradient of the two linear functions and is indicated by arrows in the graph. Examples of raw and averaged data are shown in the Supplementary Information, section S1. At low temperatures, the valence transition follows the established SDW border to lower as increases Namiki et al. (2003); Sugawara et al. (2005); Rotundu and Andraka (2006); Tayama et al. (2015). Above 4 K this trend reverses; the transition field starts to grow with . The elbow can be followed up to 22 K; at higher temperatures, it is too weak to be identified reliably.
III.3 Quantum oscillations
Shubnikov-de Haas oscillations in occur in the lower- curves in Fig. 3 (a) above 25 T. These oscillations comprise a single frequency , due to the roughly spherical phase Fermi surface Ho et al. (2016). Using an analysis similar to Ref. Rebar et al., 2019, the quasiparticle effective mass was found to be field dependent. Details and examples can be found in the Supplementary Information, section S2. Fig. 3 (c) shows the oscillating part of (right axis) and the development of for several mean fields separated by 0.75 T steps. At first, increases slowly with decreasing field, from 3.6 to 4.4 between 56 and 35 T. As the intersection of the , and SDW phases at lower field approaches, increases rapidly, reaching 6 at 28.5 T, the lowest field at which a value could be determined.
Quantum oscillations in the -phase have not been observed experimentally. The cross-sections of the calculated Fermi surfaces are quite small ( times smaller compared to the -phase; see Supplementary Information, section S3, for more information) and the quasiparticles possess heavy masses Bauer et al. (2001a); Harima and Takegahara (2003); Yan et al. (2012). Very low temperatures would therefore be required to observe quantum oscillations from heavy quasiparticles. However, the presence of the ordered SDW phase below 2 K would prevent their observation in this temperature regime because of the accompanying Fermi surface reconstruction.
A discussion on whether the field-tuned transition might be affected by the quantum limit of quantum oscillations in the phase can be found in the Supplementary Information, section S3.
IV Discussion
IV.1 Phase diagram
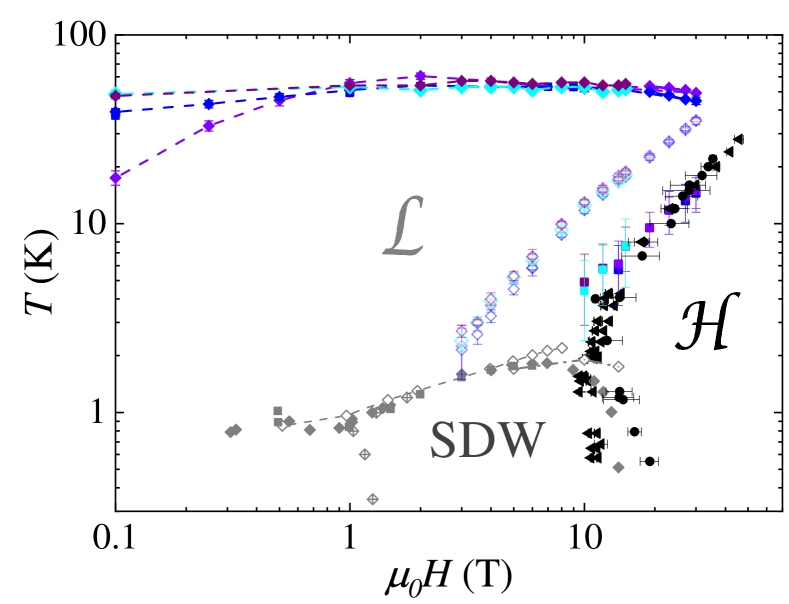
The PDO, magnetostriction and transport data ( and ) for B1–B4 are shown in Fig. 1 with linear axes and in Fig. 4 in logarithmic scaling. The SDW phase boundaries were taken from Refs. Namiki et al. (2003); Sugawara et al. (2005); Rotundu and Andraka (2006); Tayama et al. (2015); the high field data above 10 T corresponds closely to our measurements. The position of the valence transition could be determined quite precisely and agrees for different techniques. Further indications for a thermodynamic phase transition are the hysteresis in transport and PDO, and the change in behaviour of the lattice indicated by magnetostriction.
It is obvious that the “wedge-shaped” phase boundary surrounding the phase is very unusual indeed: On the high-, low- side of the phase diagram, the transition temperature , as mentioned above, differs for different samples, ranging from 17.5 to 48.5 K at . Additionally, with increasing field for , the transition at first moves rapidly to higher temperatures (i.e., has a positive gradient). Subsequently, hardly changes between 2 and 15 T but eventually decreases in higher fields. Amongst the different samples, the difference between the values decreases above 2 T, but remains at least 4 K up to 30 T.
On the low-, high- side, the metallic phase is restored. The field-induced transition and SDW phase destruction coincide below and above 10 T. A simple interpretation is that the SDW formation is dependent on details of the phase Fermi surface topology Singleton (2000); once the phase is removed by the valence transition, the SDW will inevitably be destroyed. However, we will see below that the death of the SDW and the phase boundary are, chicken-and-egg-like, much more subtly entwined than in this simple interpretation. Whereas the low part of the high-field phase boundary has a (relatively conventional) negative gradient, above , the phase boundary assumes a positive gradient; the transition moves toward higher field with increasing temperature, showing an almost linear relationship up to 28 K.
The local minimum in (), indicating the transition, and the () maximum, a precursor to the transition, move closer for increasing field, resulting in a plateau-like feature at 30 T (see Fig. 2 (c)). This convergence shows that the temperature range for which the phase is stable shrinks with increasing field. Extrapolating the measured points suggests that above , should be the only stable phase of CeOs4Sb12. A logarithmic scaling of the phase diagram displays this behavior more clearly, as shown in Fig. 4fn .
IV.2 Energy scales and quantum criticality
The phase boundary is clearly different from most others encountered in condensed-matter physics; unlike e.g., a mean-field boundary Chaikin and Lubensky (2007) or the “domes” observed in many correlated-electron systems such as organic, high- and pnictide superconductors Singleton (2000); Ramshaw et al. (2015); Michon et al. (2019); Si et al. (2016), the gradient of the boundary in space does not change monotonically, but alternates positive, negative, positive, negative. By the same token, it clearly deviates from the elliptic behavior found for field-induced valence transitions in other cerium based systems Koskenmaki and Gschneider (1978); Drymiotis et al. (2005) or uranium compounds Harrison and Jaime (2019).
The elliptic phase boundary usually associated with valence transitions is driven by the - and -dependencies of the free energy of the quasi-localized multiplet Dzero et al. (2000). The energies of the Fermi liquids on either side of the phase boundary will depend only slightly on and , so the multiplet’s free energy dominates the situation and drives the valence transition. The (where is entropy) term in the free energy means the phase in which the multiplet is populated will always be the groundstate at high and high Dzero et al. (2000); Drymiotis et al. (2005), the multiplet’s simple partition function resulting in the elliptic boundary Dzero et al. (2000). The deviation of CeOs4Sb12 from this simple behavior implies that one or more additional energy scales that depend strongly on and/or are present.
Turning first to the low, high portion of the valence transition, recall that the -phase quasiparticle effective mass appears to diverge as the transition approaches (Fig. 3 (c)). The antiferromagnetic PrOs4As12 shows a similar mass increase on approaching the phase boundary of its magnetic groundstate Ho et al. (2007). Such effective-mass increases are frequently associated with proximity to a quantum-critical point (QCP) Ramshaw et al. (2015); Michon et al. (2019); Ho et al. (2007). In the case of CeOs4Sb12, the QCP is most likely associated with the field-driven SDW collapse (Figs. 1 and 4). As , the entropy will diminish as well in accordance with the third law of thermodynamics, leaving any other energy scale to dominate Blundell and Blundell (2009). In consequence, strong quantum fluctuations - probably antiferromagnetic - around the QCP will greatly perturb the Fermi liquids’ free energy on either side of the boundary fn (2), challenging the dominance of the multiplet’s contribution Dzero et al. (2000).
IV.3 Sample dependence
Moving to the high, portion of the transition, the most striking feature is the initial, large, positive gradient. Qualitatively similar behavior is seen in the phase diagram of a reduced-dimensionality antiferromagnet Sengupta et al. (2009); in that case, the effect is attributed to thermal fluctuations affecting the system’s free energy. However, the phase-boundary gradient reversal measured in Ref. Sengupta et al., 2009 is much less marked than that in CeOs4Sb12 (Fig. 1). Moreover, there is no obvious reason why the mechanism of Ref. Sengupta et al. (2009) would yield the strong sample dependence seen here.
The phase of CeOs4Sb12 is thought to be highly unusual among Ce compounds in that very small application of uniaxial stress can transform it into an unusual topological semimetal Yan et al. (2012). It is therefore possible that the inclusions (fraction of a % level) of elemental Ce or Os, in otherwise very high quality crystals, recently observed in neutron scattering experiments neu result in local regions of varying uniaxial stress inducing topologically-protected “domains”. The number of domains would likely be very dependent on sample quality, and even small variations in strain within the same batch could give rise to the observed sample dependence. In addition, the band structure associated with such states can be sensitively dependent on magnetic field (see e.g. Refs. Rebar et al. (2019); Tang et al. (2017) and citations therein) perhaps leading to the initial positive gradient of the - boundary. Experimentally, the presence of even a small fraction of similar quasiparticles in an otherwise unremarkable Fermi liquid can have a disproportionate effect on measurable macroscopic properties Rebar et al. (2019). Analogous effects may well impact the unusual low, high curvature of the CeOs4Sb12 valence transition.
V Summary
In summary, the --phase diagram of CeOs4Sb12 has been mapped using resistivity, magnetostriction, and MHz conductivity. The semimetallic phase and the metallic -phase are separated by a valence transition that exhibits a wedge-shaped phase boundary that is clearly distinct from the text-book “elliptical” phase boundary usually followed by valence transitions. Field-dependent effective masses revealed by Shubnikov-de Haas oscillations within the phase show an increasing as the field drops toward the phase boundary, suggesting proximity to a QCP. The associated magnetic fluctuations may be responsible for the anomalous dependence of the valence transition at high field. The unusual low, high portion of the phase boundary may in contrast be associated with the proximity of CeOs4Sb12 to a topological semimetal induced by uniaxial stress, resulting in strongly sample-dependent behavior.
acknowledgments
We thank Roger Johnson for constructive discussions. We would also like to acknowledge useful discussions with Qimiao Si and Piers Coleman.
Work performed at the University of Warwick is supported by the EPSRC and European Research Council (ERC) under the European Union’s Horizon 2020 research and innovation programme (grant agreement No 681260); at the National High Magnetic Field Laboratory, USA, by NSF Cooperative Agreements DMR-1157490 and DMR-1644779, the State of Florida, U.S. DoE, and through the DoE Basic Energy Science Field Work Project Science in 100 T; at UCSD by NSF DMR-1206553 and US DOE DEFG02-04ER46105; at Hokkaido University by JSPS KAKENHI JP15KK0146, JP18H04297, JP17K05525; at CSU-Fresno NSF DMR-1506677. We acknowledge the support of the HFML-RU/FOM, member of the European Magnetic Field Laboratory (EMFL).
References
- Ho et al. (2016) P. C. Ho, J. Singleton, P. A. Goddard, F. F. Balakirev, S. Chikara, T. Yanagisawa, M. B. Maple, D. B. Shrekenhamer, X. Lee, and A. T. Thomas, Physical Review B 94, 205140 (2016).
- Koskenmaki and Gschneider (1978) D. C. Koskenmaki and K. A. Gschneider, Handbook on the Physics and Chemistry of Rare Earths, Vol. 1 (edited by K. A. Gschneider and L. Eyring (North Holland, Amsterdam), 1978) p. 337 ff.
- Drymiotis et al. (2005) F. Drymiotis, J. Singleton, N. Harrison, J. C. Lashley, A. Bangura, C. H. Mielke, L. Balicas, Z. Fisk, A. Migliori, and J. L. Smith, Journal of Physics: Condensed Matter 17, L77 (2005).
- Dzero et al. (2000) M. O. Dzero, L. P. Gor’kov, and A. K. Zvezdin, Journal of Physics: Condensed Matter 12, L711 (2000).
- Harrison and Jaime (2019) N. Harrison and M. Jaime, arXiv e-prints , arXiv:1902.06588 (2019), arXiv:1902.06588 [cond-mat.str-el] .
- Lashley et al. (2003) J. C. Lashley, J. Singleton, A. Migliori, J. B. Betts, R. A. Fisher, J. L. Smith, and R. J. McQueeney, Physical Review Letters 91, 205901 (2003).
- Harrison et al. (2019) N. Harrison, J. B. Betts, M. R. Wartenbe, F. F. Balakirev, S. Richmond, M. Jaime, and P. H. Tobash, arXiv e-prints , arXiv:1902.06859 (2019), arXiv:1902.06859 [cond-mat.str-el] .
- Namiki et al. (2003) T. Namiki, Y. Aoki, H. Sugawara, and H. Sato, Acta Physica Polonica B 34, 1161 (2003).
- Sugawara et al. (2005) H. Sugawara, S. Osaki, M. Kobayashi, T. Namiki, S. R. Saha, Y. Aoki, and H. Sato, Physical Review B 71, 125127 (2005).
- Rotundu and Andraka (2006) C. R. Rotundu and B. Andraka, Physical Review B 73, 144429 (2006).
- Tayama et al. (2015) T. Tayama, W. Ohmachi, M. Wansawa, D. Yutani, T. Sakakibara, H. Sugawara, and H. Sato, Journal of the Physical Society of Japan 84, 104701 (2015).
- Bauer et al. (2002) E. D. Bauer, N. A. Frederick, P.-C. Ho, V. S. Zapf, and M. B. Maple, Physical Review B 65, 100506 (2002).
- B. Maple et al. (2002) M. B. Maple, P.-C. Ho, V. S. Zapf, N. A. Frederick, E. D. Bauer, W. M. Yuhasz, F. M. Woodward, and J. W. Lynn, Journal of the Physical Society of Japan 71, 23 (2002).
- Ho et al. (2005) P.-C. Ho, W. M. Yuhasz, N. P. Butch, N. A. Frederick, T. A. Sayles, J. R. Jeffries, M. B. Maple, J. B. Betts, A. H. Lacerda, P. Rogl, and G. Giester, Physical Review B 72, 094410 (2005).
- Bauer et al. (2001a) E. D. Bauer, A. Slebarski, E. J. Freeman, C. Sirvent, and M. B. Maple, Journal of Physics: Condensed Matter 13, 4495 (2001a).
- Harima and Takegahara (2003) H. Harima and K. Takegahara, Journal of Physics: Condensed Matter 15, S2081 (2003).
- Yan et al. (2012) B. Yan, L. Müchler, X.-L. Qi, S.-C. Zhang, and C. Felser, Physical Review B 85, 165125 (2012).
- Yogi et al. (2005) M. Yogi, H. Kotegawa, G.-q. Zheng, Y. Kitaoka, S. Ohsaki, H. Sugawara, and H. Sato, Journal of the Physical Society of Japan 74, 1950 (2005).
- Yang et al. (2006) C. Yang, Z. Zhou, H. Wang, J. Hu, K. Iwasa, H. Sugawara, and H. Sato, Rare Metals 25, 550 (2006).
- Thompson et al. (1983) J. D. Thompson, Z. Fisk, J. M. Lawrence, J. L. Smith, and R. M. Martin, Physical Review Letters 50, 1081 (1983).
- Gignoux and Voiron (1985) D. Gignoux and J. Voiron, Physical Review B 32, 4822 (1985).
- Ghannadzadeh et al. (2011) S. Ghannadzadeh, M. Coak, I. Franke, P. A. Goddard, J. Singleton, and J. L. Manson, Review of Scientific Instruments 82, 113902 (2011).
- Altarawneh et al. (2009) M. M. Altarawneh, C. H. Mielke, and J. S. Brooks, Review of Scientific Instruments 80, 066104 (2009).
- Jaime et al. (2017) M. Jaime, C. Corvalán Moya, F. Weickert, V. Zapf, F. F. Balakirev, M. Wartenbe, P. F. S. Rosa, J. B. Betts, G. Rodriguez, S. A. Crooker, and R. Daou, Sensors 17, 2572 (2017).
- Meisner et al. (1985) G. P. Meisner, M. S. Torikachvili, K. N. Yang, M. B. Maple, and R. P. Guertin, Journal of Applied Physics 57, 3073 (1985).
- Bauer et al. (2001b) E. D. Bauer, A. Slebarski, R. P. Dickey, E. J. Freeman, C. Sirvent, V. S. Zapf, N. R. Dilley, and M. B. Maple, Journal of Physics: Condensed Matter 13, 5183 (2001b).
- Immer et al. (1997) C. D. Immer, J. L. Sarrao, Z. Fisk, A. Lacerda, C. Mielke, and J. D. Thompson, Physical Review B 56, 71 (1997).
- Rebar et al. (2019) D. J. Rebar, S. M. Birnbaum, J. Singleton, M. Khan, J. C. Ball, P. W. Adams, J. Y. Chan, D. P. Young, D. A. Browne, and J. F. DiTusa, Phys. Rev. B 99, 094517 (2019).
- Singleton (2000) J. Singleton, Reports on Progress in Physics 63, 1111 (2000).
- (30) The transition becomes difficult to observe in pulsed-field PDO data above 28 K, as it merges with the high- part of the phase boundary close to 40 K. As the upper part of the boundary is very flat in the plot, it is challenging to resolve in any swept-field, constant- pulsed experiment; the corresponding feature in the data will be very broad. Swept-, fixed- PDO measurements would be most suitable to follow the flatter, upper boundary to higher fields but would be limited to by the resistive magnet used.
- Chaikin and Lubensky (2007) P. Chaikin and T. Lubensky, Principles of condensed matter physics (4th print ed.) (Cambridge: Cambridge University Press, 2007).
- Ramshaw et al. (2015) B. J. Ramshaw, S. E. Sebastian, R. D. McDonald, J. Day, B. S. Tan, Z. Zhu, J. B. Betts, R. Liang, D. A. Bonn, W. N. Hardy, and N. Harrison, Science 348, 317 (2015).
- Michon et al. (2019) B. Michon, C. Girod, S. Badoux, J. Kačmarčík, Q. Ma, M. Dragomir, H. A. Dabkowska, B. D. Gaulin, J.-S. Zhou, S. Pyon, T. Takayama, H. Takagi, S. Verret, N. Doiron-Leyraud, C. Marcenat, L. Taillefer, and T. Klein, Nature 567, 218 (2019).
- Si et al. (2016) Q. Si, R. Yu, and E. Abrahams, Nature Reviews Materials 1, 1 (2016).
- Ho et al. (2007) P.-C. Ho, J. Singleton, M. B. Maple, H. Harima, P. A. Goddard, Z. Henkie, and A. Pietraszko, New Journal of Physics 9, 269 (2007).
- Blundell and Blundell (2009) S. J. Blundell and K. M. Blundell, Concepts in Thermal Physics (Oxford University Press, 2009).
- fn (2) The strong perturbation of the Fermi-liquid free energy is visibly manifested in the field-dependent effective mass renormalization.
- Sengupta et al. (2009) P. Sengupta, C. D. Batista, R. D. McDonald, S. Cox, J. Singleton, L. Huang, T. P. Papageorgiou, O. Ignatchik, T. Herrmannsdörfer, J. L. Manson, J. A. Schlueter, K. A. Funk, and J. Wosnitza, Phys. Rev. B 79, 060409 (2009).
- (39) M. J. Pearce et al., in preparation.
- Tang et al. (2017) P. Tang, Q. Zhou, and S.-C. Zhang, Phys. Rev. Lett. 119, 206402 (2017).