Controlling capillary fingering
using pore size gradients in disordered media
Abstract
Capillary fingering is a displacement process that can occur when a non-wetting fluid displaces a wetting fluid from a homogeneous disordered porous medium. Here, we investigate how this process is influenced by a pore size gradient. Using microfluidic experiments and computational pore-network models, we show that the non-wetting fluid displacement behavior depends sensitively on the direction and the magnitude of the gradient. The fluid displacement depends on the competition between a pore size gradient and pore-scale disorder; indeed, a sufficiently large gradient can completely suppress capillary fingering. By analyzing capillary forces at the pore scale, we identify a non-dimensional parameter that describes the physics underlying these diverse flow behaviors. Our results thus expand the understanding of flow in complex porous media, and suggest a new way to control flow behavior via the introduction of pore size gradients.
pacs:
Valid PACS appear hereI Introduction
Drainage is the process by which a non-wetting fluid displaces a wetting fluid from a porous medium. This phenomenon is ubiquitous: it arises in diverse settings including groundwater contamination, oil migration, gas venting from sediments, CO2 sequestration, mercury porosimetry, soil drying, liquid infusion into porous membranes, and oxygen accumulation within polymer electrolyte membranes cueto2008nonlocal ; bazyar2018liquid ; sahimi2011flow ; berg2012stability ; bethke1991long ; dandekar2013petroleum ; benson2008carbon ; macminn2010co ; saadatpoor2010new ; bandara2011pore ; neufeld2009modelling ; bear2010modeling ; dawson1997influence ; levy2003modelling ; kueper1991two ; lee2016porous ; carmo2013comprehensive . The ability to accurately predict the displacement pathway of the non-wetting fluid is critically important in all of these cases sahimi2011flow ; rabbani2018suppressing . For instance, whether the fluid flows through a compact, stabilized front or a narrow and fingered channel impacts how much contaminant penetrates into an aquifer, how much oil can be recovered from a reservoir, and how much water remains in a dried soil cottin2011influence ; singh2003dynamic ; datta2014mobilization ; datta2013drainage .
Different displacement behaviors can arise during drainage. For a homogeneous disordered medium of uniform wettability and uncorrelated pore sizes, these behaviors are predictable using two non-dimensional parameters: the viscosity ratio and the capillary number , where and are the non-wetting and wetting fluid viscosities, is the fluid flow rate through a cross-sectional area of the medium, and is the interfacial tension between the two fluids lenormand1988numerical ; yortsos1997phase ; xu1998invasion . Many processes are characterized by and ; under these conditions, capillary forces dominate, and the non-wetting fluid cannot enter a pore of diameter until the fluid pressure reaches a threshold . Therefore, the non-wetting fluid displacement proceeds one pore invasion at a time. At each time, the fluid invades the largest pore accessible to it, which is characterized by the lowest capillary pressure threshold. The flow behavior is thus determined by pore-to-pore variations in the pore size, resulting in a displacement process known as capillary fingering (CF) that is characterized by a ramified and disordered pathway lenormand1989capillary ; lenormand1983mechanisms ; lenormand1985invasion ; mayer1965mercury ; xu2008dynamics ; krummel2013visualizing ; toledo1994pore ; mason1986meniscus ; joekar2012analysis ; maaloy1992dynamics ; martys1991critical ; xu1998invasion .
Many naturally-occurring and synthetic porous media are not homogeneous, however. For example, shales, sandstones, and soils are typically heterogeneous, with smooth gradients or sharp discontinuities in pore size both along and orthogonal to the fluid flow direction ringrose1993immiscible ; schaetzl2015soils ; ashraf2019capillary . Sharp pore size stratification has been shown to alter the fluid pathway during drainage datta2013drainage ; yokoyama1981effects ; lake1981taylor ; chatzis1995investigation , yet the influence of a smooth gradient in pore sizes is still unclear. Theoretical calculations, numerical simulations, and indirect experimental evidence suggest that an applied pressure gradient can modify the fluid pathway meakin1991 ; meakin1992 ; chaouche1994 ; xu1998 , and a pore size gradient has been conjectured to play a similar role yortsos2001 , but this conjecture has not been directly tested in experiments. Recent investigations of viscous fingering, a distinct fluid displacement behavior that arises for , demonstrate that gradients and spatial correlations in pore size can indeed strongly impact the geometry of the fluid pathway rabbani2018suppressing ; al2012control ; jackson2017stability ; pihler2012suppression ; biswas2018drying . However, how a pore size gradient impacts capillary fingering remains unknown. As a result, accurate prediction of fluid displacement pathways is still elusive for many real-world applications.
Here, we use microfluidic porous media and computational pore-network models to investigate how capillary fingering is influenced by a pore size gradient. We find that the non-wetting fluid displacement behavior depends sensitively on the direction and the magnitude of the gradient, and for a sufficiently large gradient, capillary fingering is completely suppressed. Instead, if the non-wetting fluid flows down the gradient, it propagates via a uniform, stabilized front, while if the fluid flows up the gradient, it propagates through a single, unstable, fingered channel. This behavior also depends on the relative amount of disorder in the geometry of the medium; we demonstrate that the fluid displacement can be described by a single non-dimensional parameter that quantifies the competition between a pore size gradient and pore-scale disorder. Moreover, by analyzing capillary forces at the pore scale, we develop a geometric criterion that predicts when capillary fingering is completely suppressed. Our results thereby help elucidate how diverse flow pathways can arise due to pore size gradients in disordered media.
II Experimental materials and methods
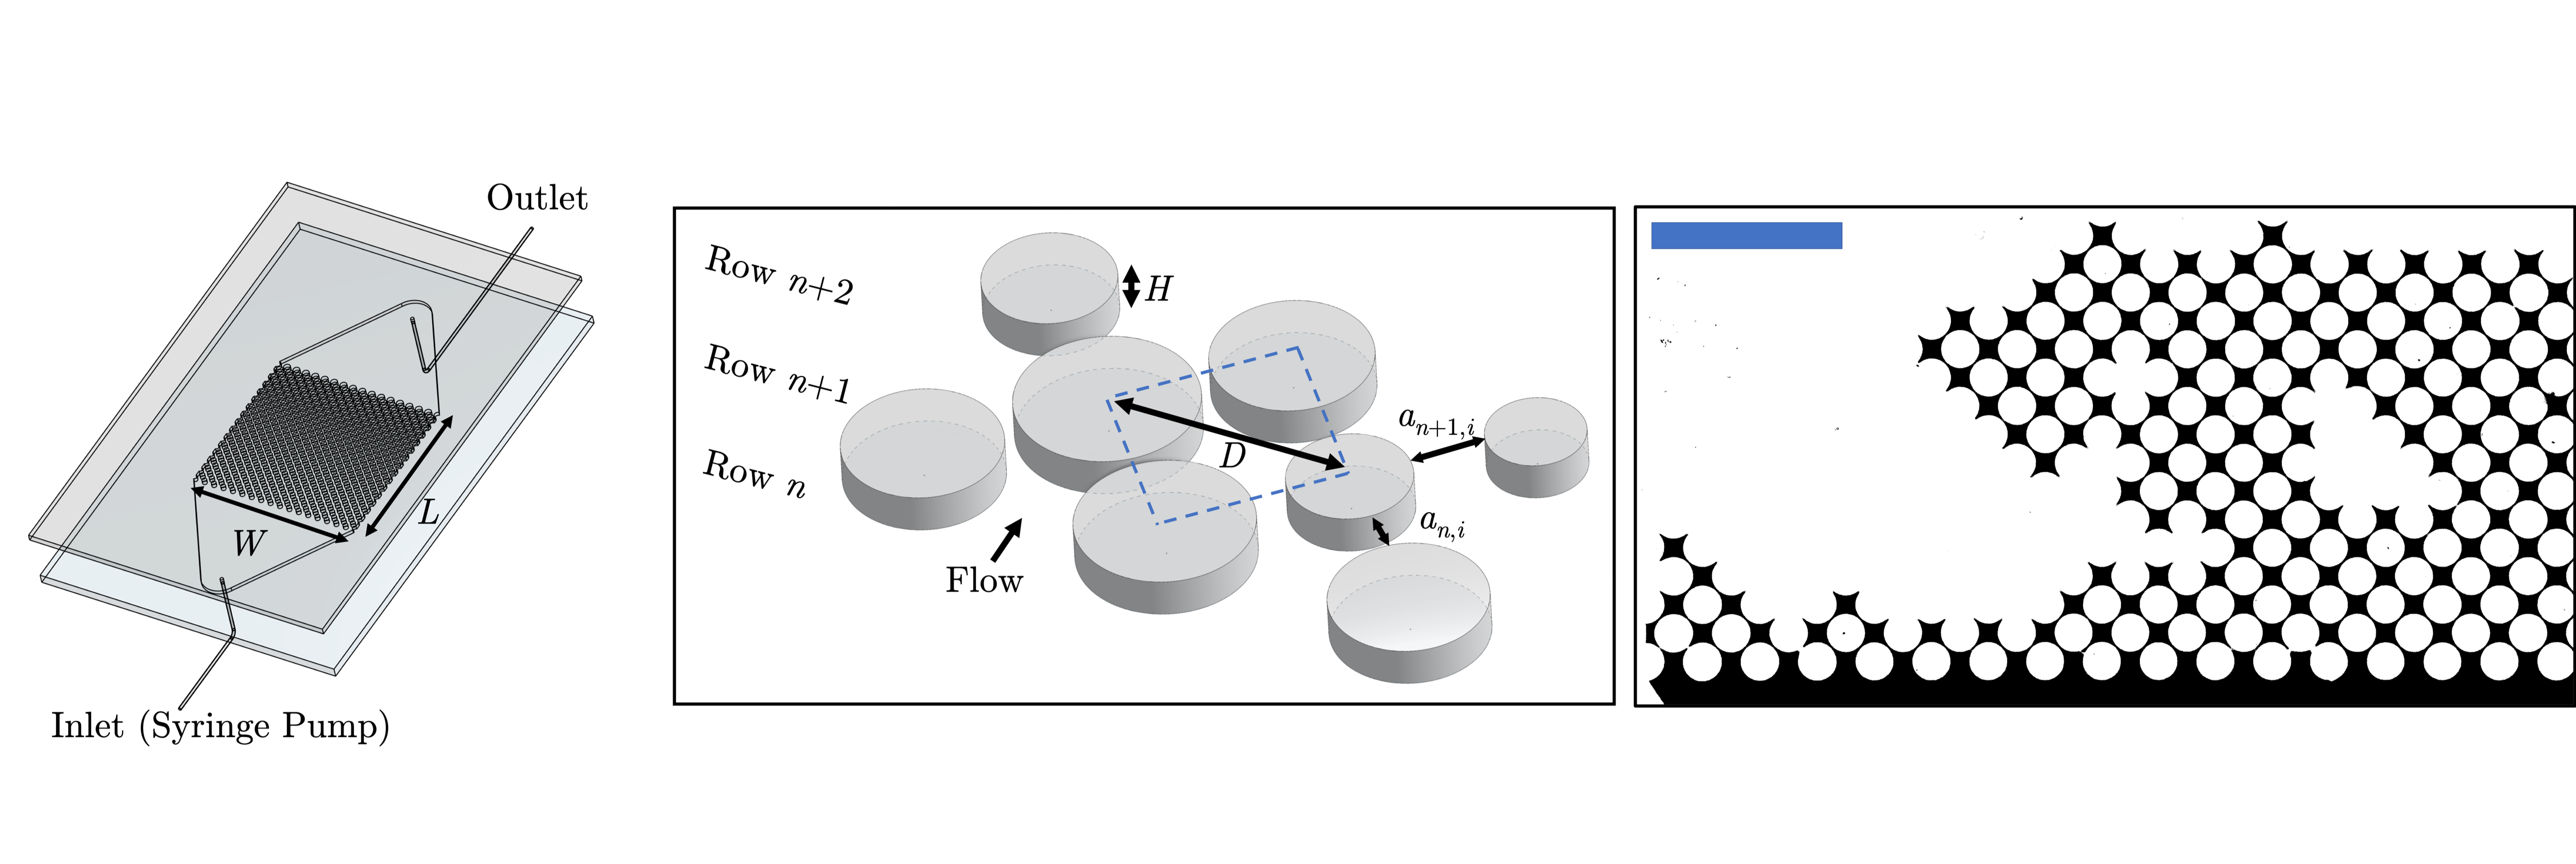
To systematically study the influence of pore size gradients and disorder on drainage, we design polydimethylsiloxane (PDMS) microfluidic devices with controlled pore geometries. The devices are comprised of a rectangular channel of width and length containing a two-dimensional (2D) array of cylindrical pillars that span the channel height , where the uncertainty reflects experimental variations in device fabrication. Importantly, because , the fluid flow is effectively 2D. We arrange the pillars on a square diagonal lattice with a diagonal length of , as shown in Figure 1. The lattice has 31 rows with either 17 or 18 pillars per row. The pillar diameters determine the pore diameters: the diagonal distances between neighboring pillars represent the pore throats. We denote the diameters of the pores throats in row by , where indexes the pores along the row, and the mean diameter by . Our experiments explore the range , with an uncertainty of due to experimental variability in device fabrication. We also introduce a triangular area at the inlet of each device to ensure that the flow is uniform before it reaches the first set of pillars rabbani2018suppressing .
We fabricate the devices using standard soft lithography. First, we design silicon molds for the devices using photolithography with a positive photoresist and deep reactive ion etching. We then cast the devices using PDMS (Dow Corning Sylgard 184), with a cross-linker to elastomer ratio of 1.5 to 10. We heat the castings for 20 minutes at and treat them for 30 seconds using a Corona treatment. Finally, we attach a glass slide to each casting and leave them to bond further overnight at . The finished PDMS surfaces are hydrophobic and oleophilic, as previously described rabbani2018suppressing ; our images (e.g. in Figs. 2-3) indicate that interactions with the PDMS primarily dictate the mean curvature of the fluid-fluid interface in the experiments.
Prior to each experiment, we saturate the device with the wetting fluid, silicone oil of viscosity = . We then inject the non-wetting fluid, 76.5 vol glycerol in water colored with food dye; the interfacial tension between the wetting and non-wetting fluids is . The non-wetting fluid has viscosity = ; therefore, our experiments probe . We use a Harvard Apparatus Pump 11 Elite syringe pump to impose a constant injection flow rate mL/h, which corresponds to , well in the capillary fingering regime for homogeneous disordered media. Our experiments confirm this expectation: we observe that the non-wetting fluid invades the pore space sequentially, one pore invasion at a time.
As the non-wetting fluid flows, we image the evolution of the flow pathway using a mounted digital camera taking 4K resolution images between 1 and 2 frames per minute. To characterize the structure of the resulting displacement pathway, we use the binarized images to determine the fraction of the pore space volume that is occupied by the non-wetting fluid, , focusing on a field of view four rows away from the lateral boundaries and the entrance of the medium to minimize boundary effects. Moreover, to minimize exit effects, we measure when the non-wetting fluid first reaches the halfway point of the medium.
III Influence of a gradient on drainage behavior
We first test a disordered, gradient-free porous medium. To incorporate a controlled amount of disorder in the medium, we fabricate porous media with pillars whose diameters are chosen from a normal distribution. We choose the pillar diameters such that the pore diameters are also given by a normal distribution with a mean of and with a standard deviation = , such that the difference between the maximum and minimum pore diameters equals . Hence, the quantity provides a measure of the disorder in the medium. Because , we expect the drainage to proceed via capillary fingering. Consistent with this expectation, the fluid displacement proceeds one pore invasion at a time, resulting in a ramified and disordered pathway with 0.45 as shown in the rightmost panel of Fig. 1. This pathway is morphologically similar to previous observations of capillary fingering pathways, which can have ranging from to 0.7 lenormand1988numerical ; chen2017 .
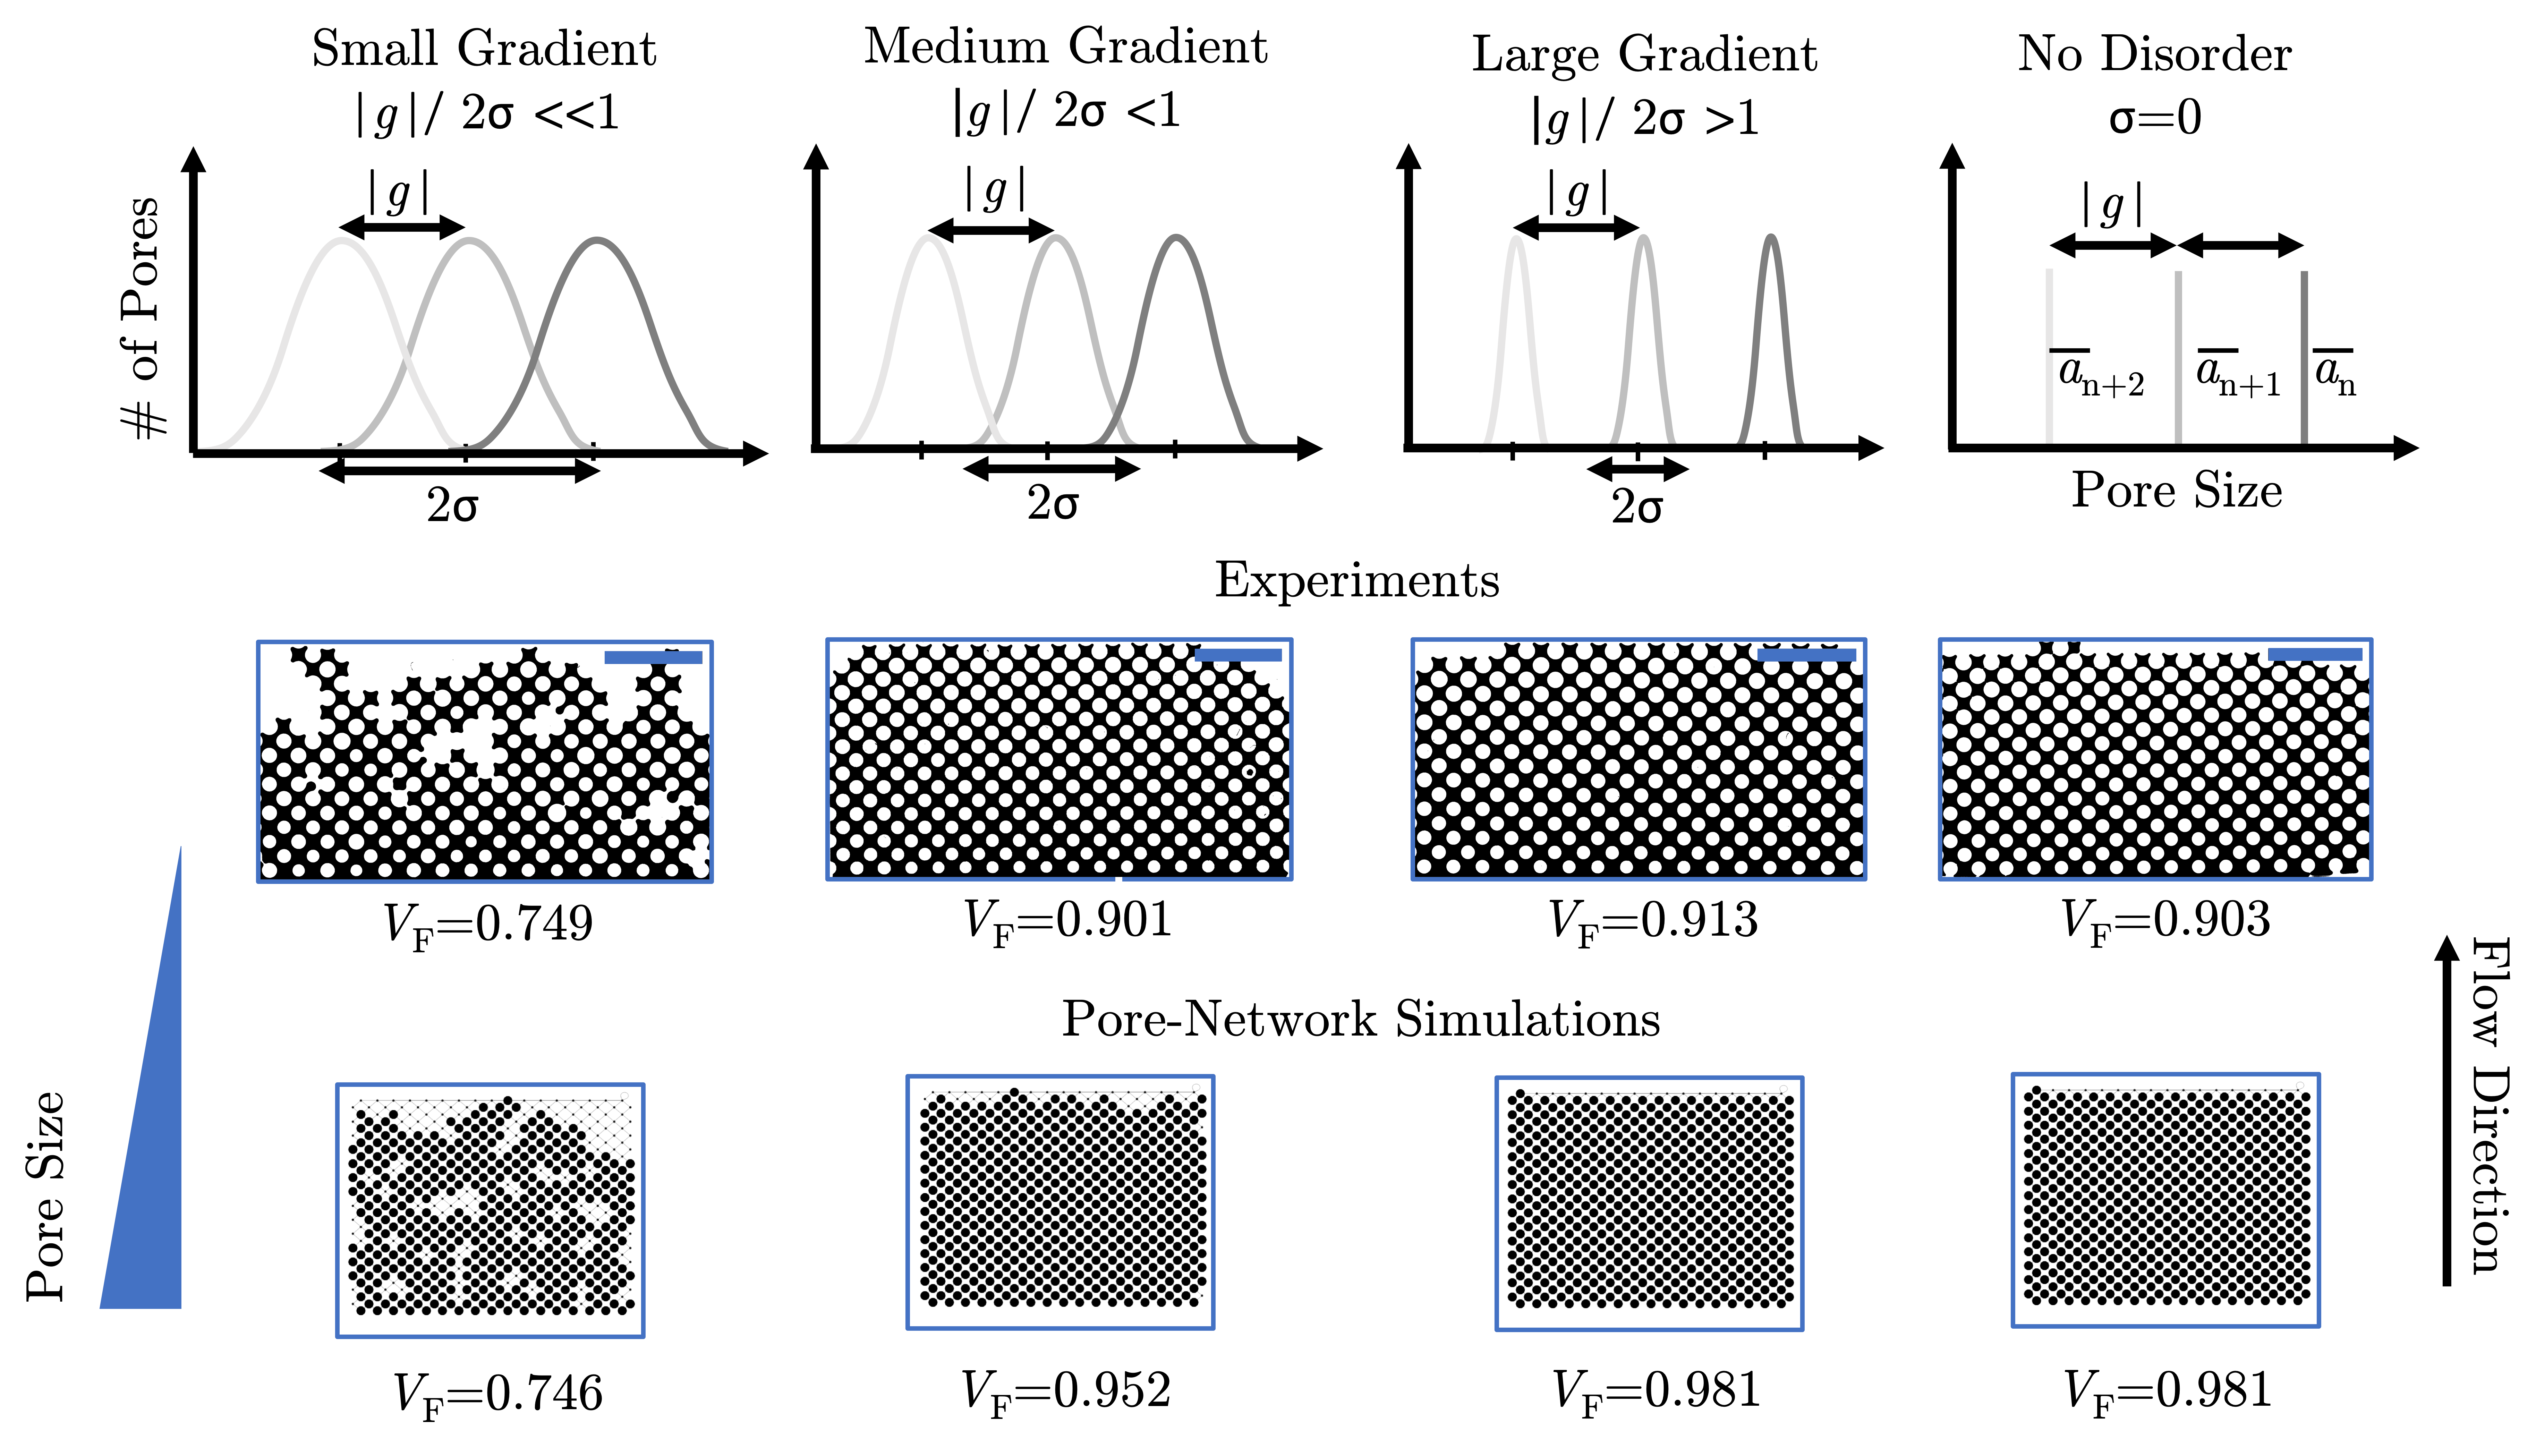
We next test the influence of a pore size gradient on the fluid displacement. To define a gradient, we fabricate porous media with pillars whose diameters, averaged across each row, increase by a fixed amount per row along the imposed flow direction. As a result, the mean pore diameter decreases by from one row to the next, as schematized in the top row of Fig. 3 chung2017enhancing ; chaouche1994invasion ; rabbani2018suppressing . The mean pore diameter in row is thus given by , where the parameter quantifies the gradient; in general, a negative or positive value of indicates that the pore diameters are decreasing or increasing along the flow direction, respectively. We maintain a controlled amount of disorder in the medium by choosing the size of each pore in a given row from a normal distribution of sizes centered around and with the difference between the maximum and minimum pore diameters again equal to . To isolate the influence of the gradient, we fix = and test four different values of : and .
Remarkably, although , well within the capillary fingering regime for homogeneous media, the addition of the pore size gradient completely suppresses capillary fingering. Instead, we observe two distinct flow pathways. In both cases, the non-wetting fluid displaces the wetting fluid sequentially, one pore invasion at a time; however, the macroscopic flow pathway is starkly different from the ramified and disordered pathway characteristic of capillary fingering. For , the non-wetting fluid propagates via a uniform, stabilized front, as shown in the left panel of Fig. 2, ultimately yielding a non-wetting fluid volume fraction . We term this displacement behavior stable displacement. By contrast, for , the non-wetting fluid propagates through a single, unstable, fingered channel, as shown in the right panel of Fig. 2, ultimately yielding a non-wetting fluid volume fraction . We term this displacement behavior unstable fingering. Interestingly, these displacement behaviors arise for both values of , and the final appears to only depend on the sign of , not its magnitude, in this range of .
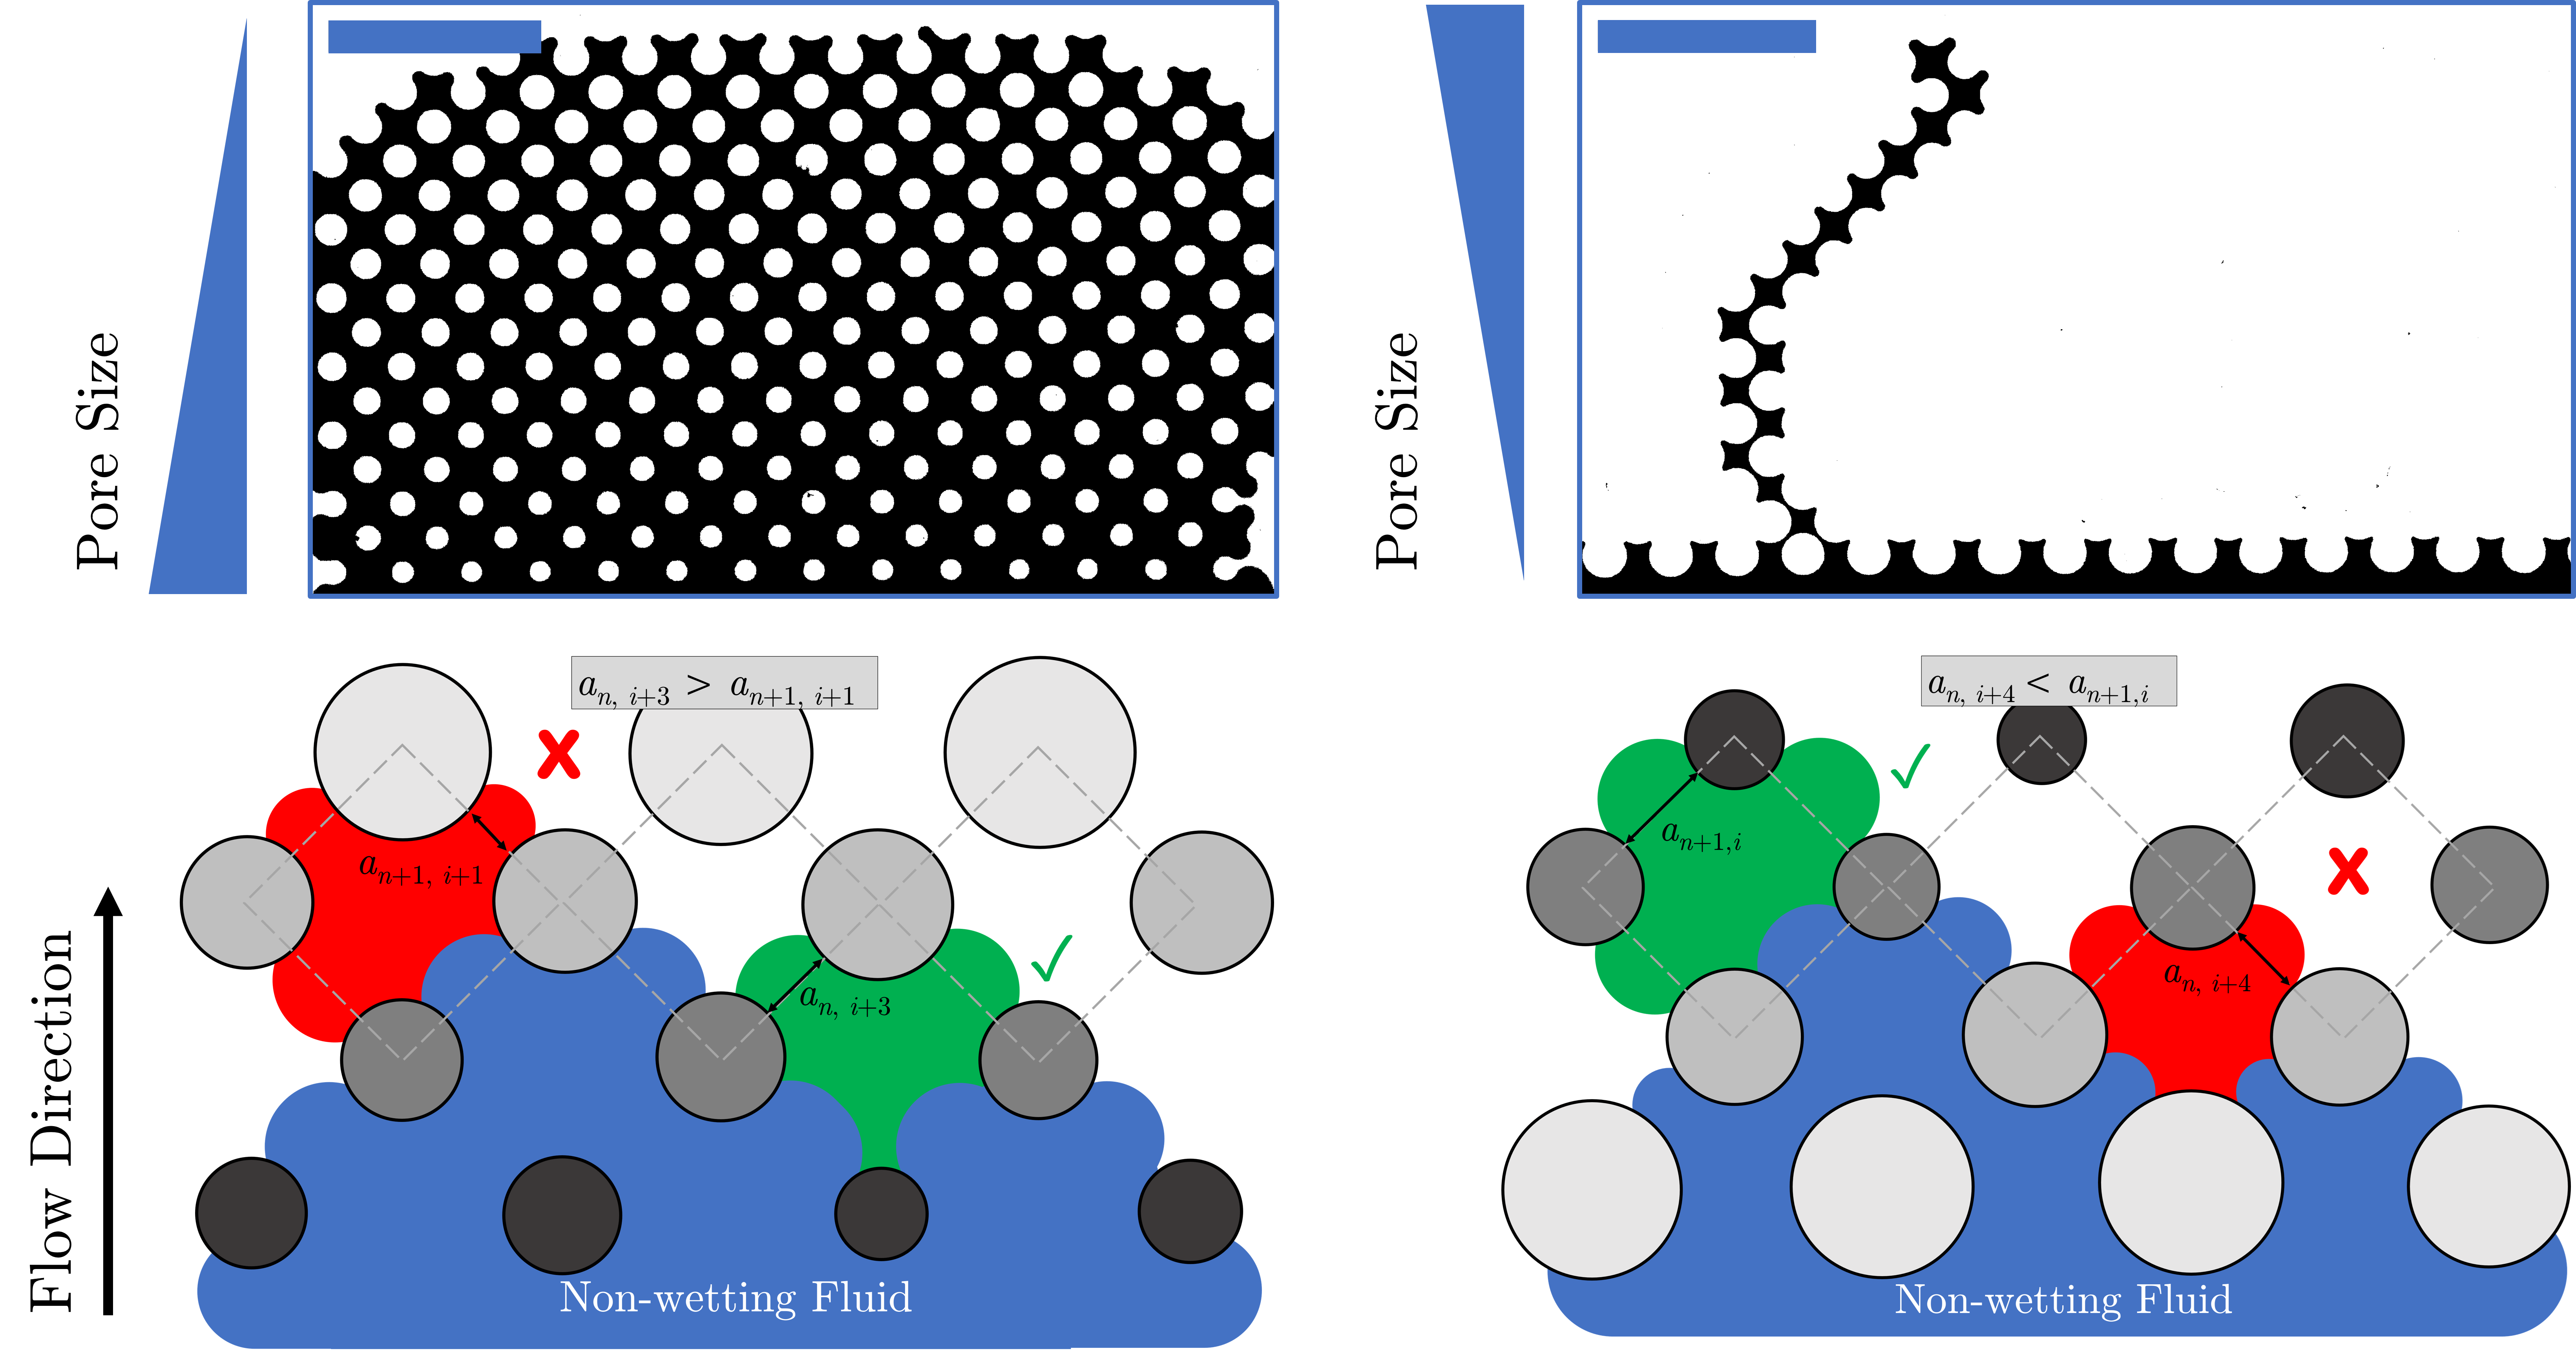
We can understand the origin of these displacement behaviors by analyzing the pore-scale capillary forces for a fluid interface trapped within a pore in a given row. Because , the non-wetting fluid pressure must exceed the capillary pressure threshold to enter a pore of diameter . For the media with a pore size gradient, the smallest pore in row , characterized by the largest capillary pressure threshold, has diameter ; by contrast, the largest pore in row , with the smallest capillary pressure threshold, has diameter . Because , the smallest pore in row is larger than the largest pore in row when , as in the experiments, which have and 2.6. Hence, when this macroscopic criterion holds—independent of the exact value of —the pores along each row remain separated in diameter from those in the adjacent rows. Consequently, the capillary pressure threshold is lower for pores in row compared to pores in row . The pore size gradient therefore dominates over disorder in determining the non-wetting fluid pathway: the non-wetting fluid fills all pores in a given row before proceeding to the next, ultimately leading to stable displacement as observed experimentally (Fig. 2, left).
A converse argument holds for the case of : when , the largest pore in a given row is smaller than the smallest pore in row , independent of the exact value of . The magnitudes of the corresponding capillary pressure thresholds again remain separated between adjacent rows; the pressure threshold is then higher for pores in row compared to pores in row . The pore size gradient thus dominates over disorder in determining the non-wetting fluid pathway again: in this case, instead of laterally filling a given row, the non-wetting fluid successively fills neighboring pores in adjacent rows along the flow direction. As a result, the fluid propagates through the medium in a single thin channel approximately one pore wide, ultimately leading to unstable fingering as observed experimentally (Fig. 2, right).
IV Competition between a gradient and disorder
This geometric argument predicts that the fluid displacement pathway only depends on the sign of , not its magnitude, when the non-dimensional parameter —resulting in stable displacement or unstable fingering, as observed in the experiments. The threshold accordingly represents a macroscopic geometric criterion describing when capillary fingering is completely suppressed, even under conditions in which capillary fingering would typically be predicted for homogeneous disordered media. By contrast, the fluid displacement must proceed by capillary fingering in the limit that approaches zero, in which pore size disorder solely determines the displacement pathway. We thus expect a transition between these displacement behaviors as increases from zero: the pore size distributions and the corresponding capillary pressure thresholds characterizing adjacent rows overlap less and less (top row of Fig. 3, left to right). The gradient then plays an increasing role in determining the displacement pathway, with stable displacement or unstable fingering increasingly dominating for increasing values of , depending on the sign of , up to the threshold .
We quantitatively test this prediction by performing experiments on devices with different values of and spanning over three decades in the non-dimensional parameter . Representative images showing the morphology of the fluid displacement pathway for are shown in the middle row of Fig. 3. Consistent with our hypothesis, we find that as the relative magnitude of the gradient increases, the non-wetting fluid displacement becomes increasingly uniform for , ultimately leading to a stabilized front (Fig. 3, left to right). Conversely, for , we find that as the relative magnitude of the gradient increases, the fluid displacement becomes increasingly unstable, ultimately leading to propagation through a single fingered channel.
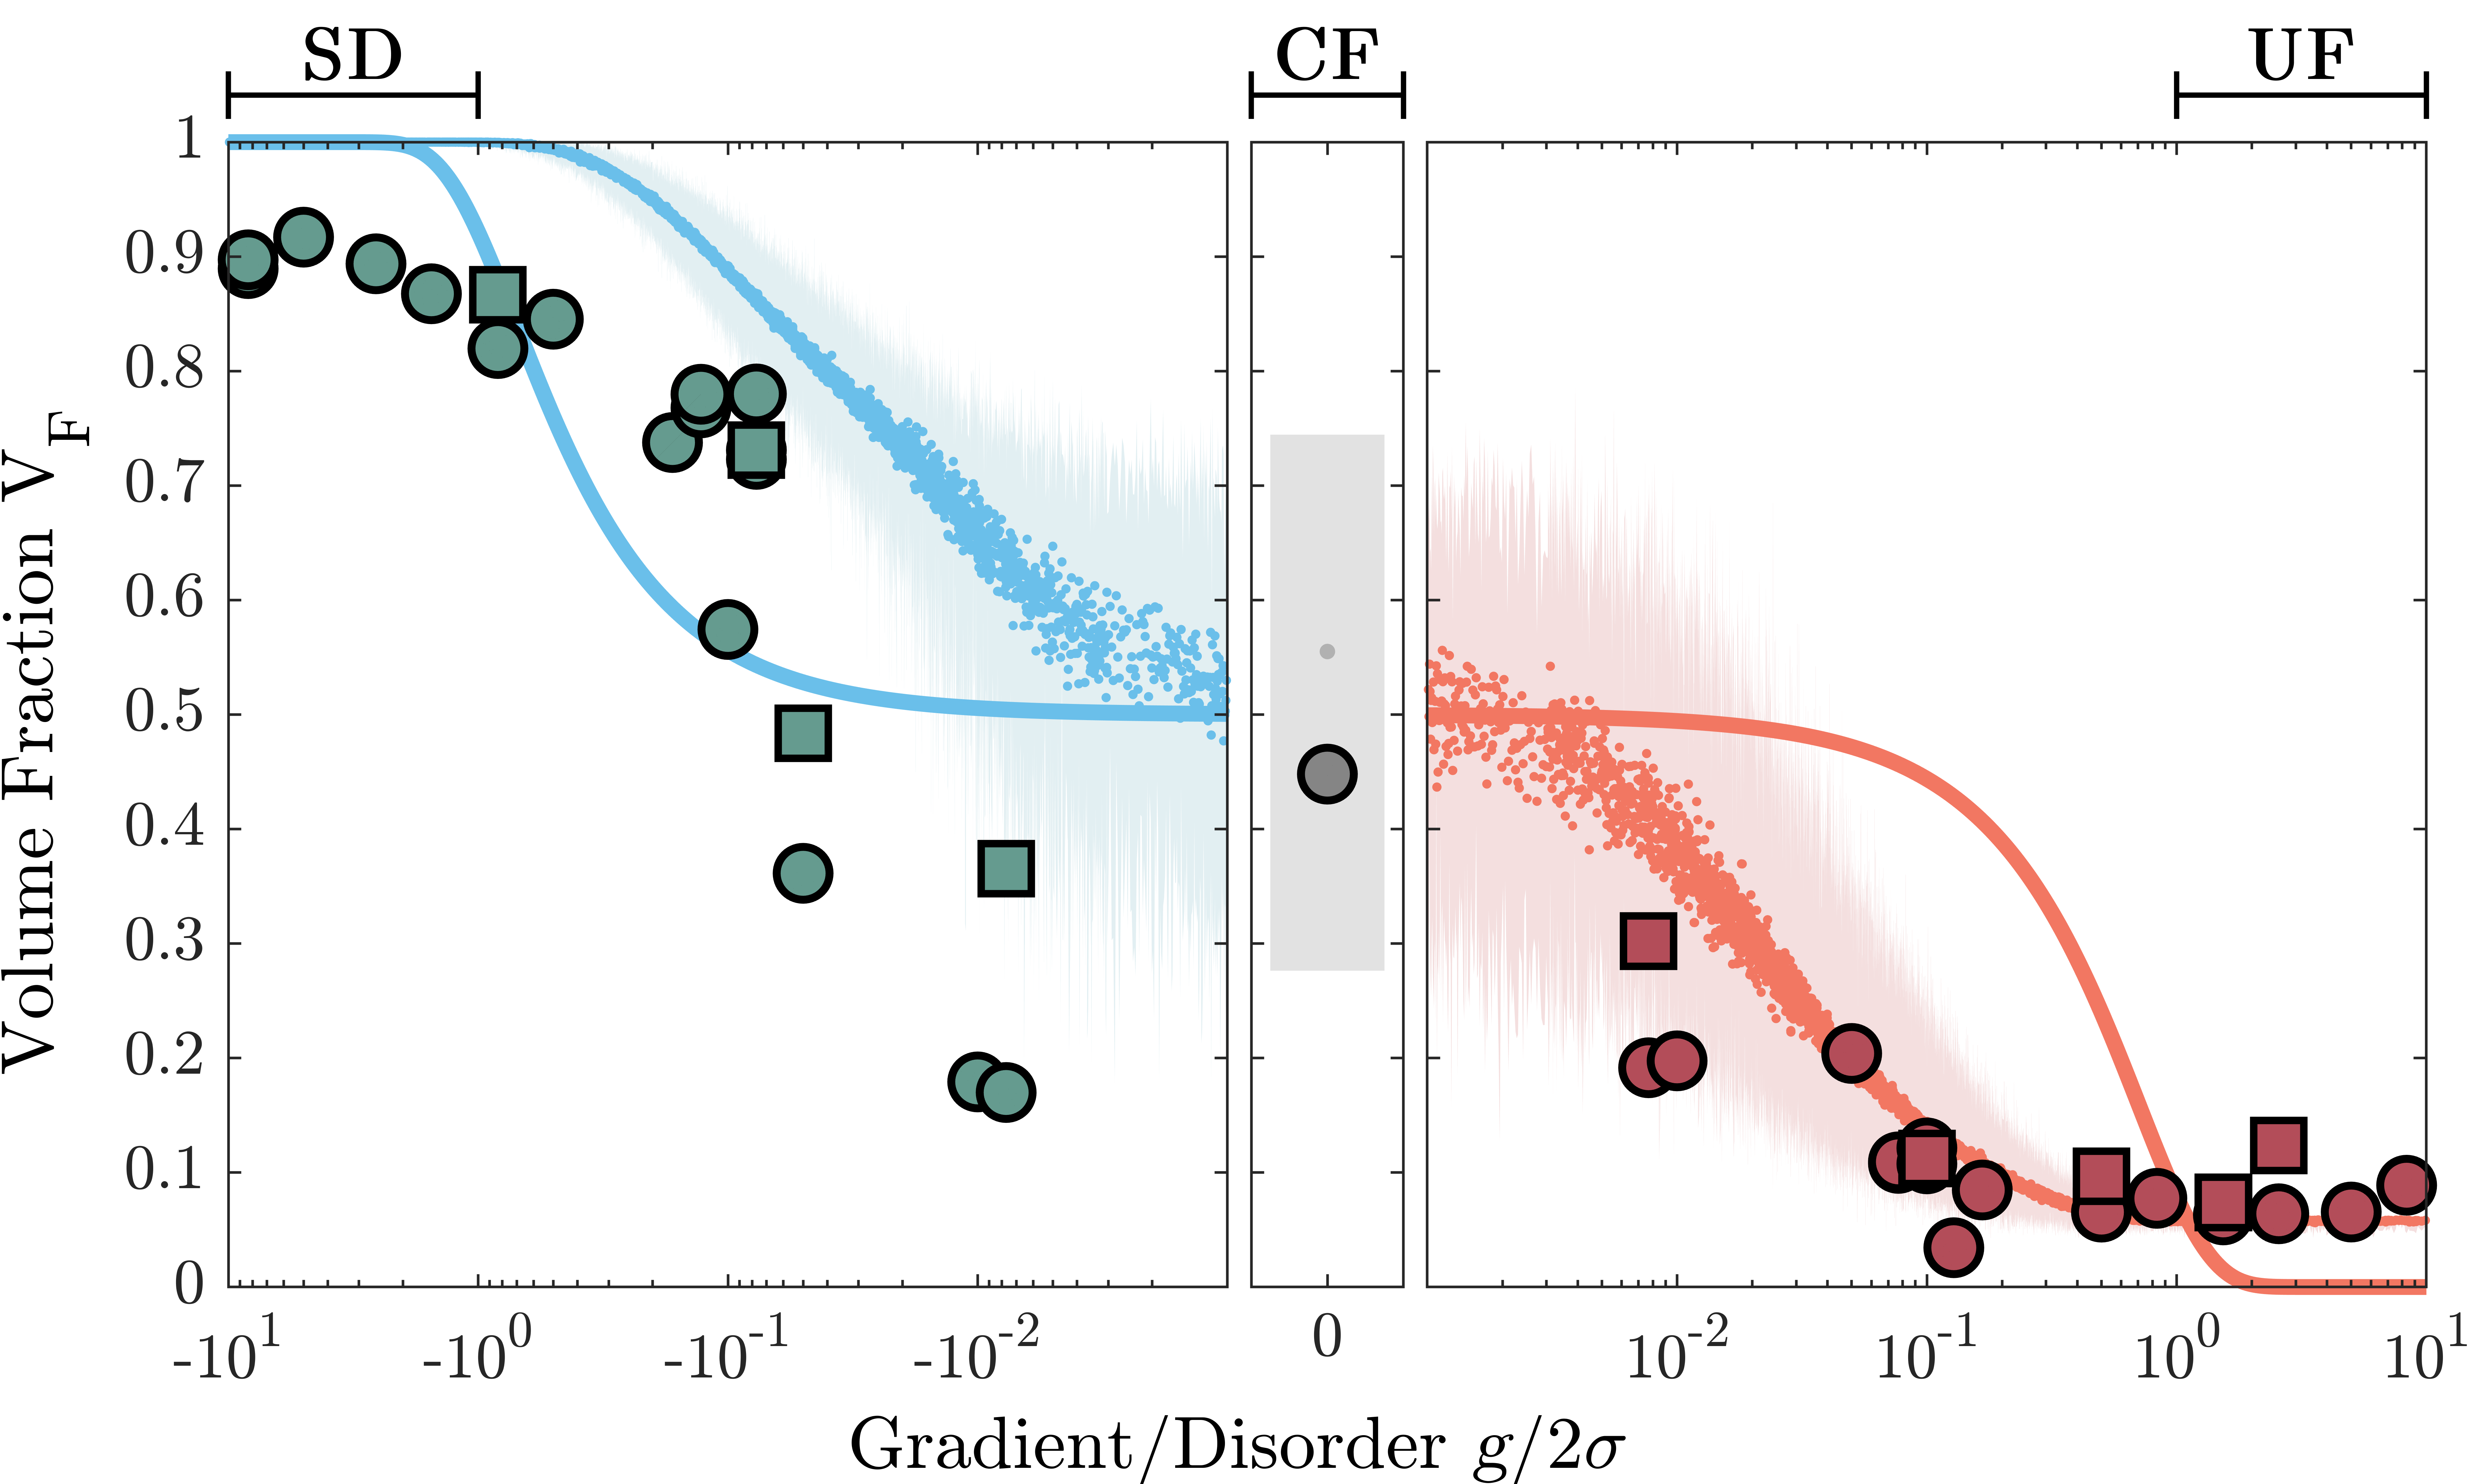
The full set of our measurements of are shown by the large symbols in Fig. 4. Consistent with our hypothesis, increases or decreases as increases above zero for and , respectively. Surprisingly, these transitions are highly sensitive to the magnitude of the gradient: the non-wetting fluid volume fraction begins to appreciably deviate from the capillary fingering value when is as small as , as shown in Fig. 4. Moreover, consistent with our hypothesis, the flow pathway eventually reaches the stable displacement and unstable fingering limits—which we measure to have and —for and respectively, as increases above one. We confirm these limiting values by also testing media with a pore size gradient () but no disorder (). Additionally, to confirm that the results are insensitive to the choice of M in this regime of , we test different viscosity ratios and 40 using and vol glycerol as the non-wetting fluid, respectively. In both cases, the gradient completely suppresses capillary fingering, as exemplified for the case of in Fig. 3, and we measure and for and and for , respectively. Finally, we find qualitatively similar results using different image analysis protocols as indicated by the squares and circles in Fig. 4, further indicating that our findings are robust. The slight discrepancy between the measured volume fraction in the stable displacement limit and the expected value of arises from experimental boundary effects. These are exemplified in Fig. 2 (Left) and in Fig. 3 (Middle Row), which show unfilled pores that occur at the boundary of the medium.
To describe the variation of with , we extend the geometric argument presented in Section II. We again analyze the pore-scale capillary forces for a fluid interface trapped within a pore in row , which represents the downstream tip of the non-wetting fluid interface. However, to more generally represent the pore structure, we describe the distribution of pore diameters in the row by the probability density function . We denote the minimum and maximum pore diameters in row by and , and the cumulative distribution function of by ; then represents the probability that a pore in row has size , while represents the fraction of pores in row that are smaller than . For a gradient-free medium, all the are the same and are thus independent of , while as increases from zero, and begin to overlap less and less. We assume that the non-wetting fluid randomly samples pores as it invades the pore space, and that pore invasion only occurs at the downstream tip of the fluid interface. The non-wetting fluid volume fraction can then be approximated by the probability that a pore randomly selected from row is larger than a pore randomly and independently selected from row :
| (1) |
For comparison with the experiments, we represent by the normal distribution and thereby obtain a full analytic prediction for the non-wetting fluid volume fraction:
| (2) |
Here, is an integration variable and thus, Equation 2 demonstrates the central role of the non-dimensional parameter in describing the flow dynamics. We numerically solve Eq. 2 by replacing and by and , respectively. This solution is shown by the solid lines in Fig. 4.
The comparison between the solution to Eq. 2 and the experimental data indicates that our geometric argument qualitatively captures the transition from capillary fingering at low to stable displacement () or unstable fingering () as increases to above one. However, this argument underpredicts the sensitivity to the magnitude of the gradient: the predicted begins to appreciably deviate from the capillary fingering value only when , an order of magnitude larger than in the experiments. This discrepancy reflects the simplifying assumptions made in this model—specifically, that the non-wetting fluid randomly samples pores as it invades the pore space, and that pore invasion only occurs at the downstream tip of the fluid interface. These assumptions neglect the sizes of and the connectivity between individual adjacent pores; they also neglect the possibility of pore invasion upstream from the downstream tip of the fluid interface, as well as wetting fluid trapping throughout the pore space, which decreases the accessibility of pores. Fully describing the influence of a pore size gradient therefore requires a more accurate description of the pore space structure and the pore-scale displacement dynamics.
V Pore-scale computational model
We hypothesize that considering pore-scale capillary forces can describe the transition to capillary fingering with increasing disorder, but only when the sizes and connectivity between individual pairs of pores in the full medium are taken into account. To test this idea, we use a computational pore-network model of invasion percolation with trapping that explicitly considers the pore-to-pore variation in capillary pressure thresholds for a specified medium geometry lenormand1985invasion ; birovljev1991gravity ; masson2016fast ; wilkinson1986percolation ; yortsos2001delineation ; xu1998invasion .
We first generate a grid of pores arranged on a square diagonal lattice with the same structure as the experimental devices. Using this grid, we use a graph object for the pore network. Pore bodies become nodes that are either “filled” by the non-wetting fluid or are “not filled”—that is, filled with the wetting fluid instead—and pore throats become edges connecting two bodies/nodes. The pore body and throat sizes are generated statistically, using specified values of and , in a manner similar to the experiments. Importantly, the pore throat sizes define the capillary pressure thresholds such that larger pore throats are more easily invaded than smaller ones due to the resultant differences in their capillary pressure thresholds.
At the beginning of each simulation, all the pores in the first row are filled with the non-wetting fluid. At each time step, we determine the connected component clusters of “not filled” pore bodies; the boundaries with these clusters delineate the invading non-wetting fluid interface or trapped wetting fluid regions. We then find the largest pore throat along the invading non-wetting fluid interface and fill the corresponding pore body, keeping trapped wetting fluid regions unchanged to model an incompressible fluid. The model then iterates through time steps until the non-wetting fluid reaches the outlet. Similar to the experiments, we characterize the resultant flow pathway by calculating the fraction of the pore space that is occupied by the non-wetting fluid, , including both pore bodies and pore throats as in the experiments.
The non-wetting fluid pathways obtained using the pore-network simulations show excellent agreement with the experimental observations. Similar to the experimental observations described in Fig. 3, we find that for and increasing , the non-wetting fluid displacement becomes increasingly uniform for , ultimately leading to a stabilized front as shown in the bottom row of Fig. 3. Moreover, the flow pathway is insensitive to the choice of for . Conversely, for , we find that as the relative magnitude of the gradient increases, the fluid displacement becomes increasingly unstable, ultimately leading to propagation through a single fingered channel.
As a final test of our hypothesis, we run pore-network simulations for geometries with different values of and spanning over three decades in , similar to the experiments. The mean value of obtained for each is shown by the small symbols in Fig. 4, while the full range of determined in the simulations is shown by the light shaded regions. As observed in the experiments, as increases, quickly varies from the two-dimensional capillary fingering value , appreciably increasing () or decreasing () when . Moreover, as observed in the experiments, the flow pathway eventually reaches the stable displacement and unstable fingering limits and for and , respectively, as increases above 1. The pore-network simulations thus establish that the macroscopic geometric criterion (dashed line in Fig. 4), which does not explicitly consider the pore-scale connectivity of the medium or the full pore invasion dynamics, can still describe when capillary fingering is completely suppressed.
Intriguingly, the values of obtained in the simulations are highly variable, similar to the experiments, which show a considerable amount of scatter. We do not observe any apparent correlation between and the value of or used in a simulation (Appendix, Fig. A.1), confirming the governing role of the non-dimensional parameter in describing the displacement behavior. Instead, the variability in reflects the different possible pore structures that can be generated for a given value of ; these pore structures individually determine the different non-wetting fluid displacement pathways. Given this variability, we find good agreement between the experimental measurements and the pore-network simulations. Moreover, the variability in decreases as increases for both the experiments and the simulations: the pore size gradient increasingly dominates over disorder in determining the non-wetting fluid pathway. Together, these results support our hypothesis that for , pore-scale capillary forces can describe the non-wetting fluid pathway, but only when the full pore space structure and the pore-scale displacement dynamics are taken into account.
VI Conclusion
Using experiments with microfluidic porous media and simulations with pore-network models, we demonstrate how capillary fingering is influenced by the competition between a pore size gradient and pore-scale disorder. We find that as the non-dimensional parameter increases, the non-wetting fluid displacement behavior quickly transitions away from the gradient-free limit of capillary fingering, even under flow conditions in which capillary fingering would typically be predicted for homogeneous disordered media. Capillary fingering is eventually completely suppressed when , above which the non-wetting fluid flows via either stable displacement or unstable fingering, depending on the direction of the gradient. By analyzing capillary forces at the pore scale, we develop a geometric criterion to predict these limiting behaviors. Indeed, because the displacement behaviors studied here are controlled by capillary forces at the pore scale, we expect that our results are also applicable to porous media with wettability gradients. This work thus expands our understanding of drainage in porous media, which is typically described only by the two non-dimensional parameters, M and Ca lenormand1988numerical . It also suggests a way to control flow behavior in homogeneous porous media through the introduction of a pore size or wettability gradient—for example, via the controlled deposition of solute through the pore space bradford2008 .
Acknowledgements.
Correspondence should be addressed to S.S.D. at ssdatta@princeton.edu. It is a pleasure to acknowledge N. Bizmark and H. J. Cho for helpful feedback on the manuscript, and R. K. Prud’homme and H. A. Stone for stimulating discussions. We acknowledge use of the Princeton Institute for the Science and Technology of Materials (PRISM) cleanroom, and the Princeton Institute for Computational Science and Engineering for computer cluster access. This work was supported by start-up funds through Princeton University. N.B.L. was supported in part by the Mary and Randall Hack Graduate Award of the Princeton Environmental Institute. This material is also based upon work supported by the National Science Foundation Graduate Research Fellowship Program (to C.A.B.) under Grant No. DGE-1656466. Any opinions, findings, and conclusions or recommendations expressed in this material are those of the authors and do not necessarily reflect the views of the National Science Foundation.Appendix A Influence of gradient and disorder on
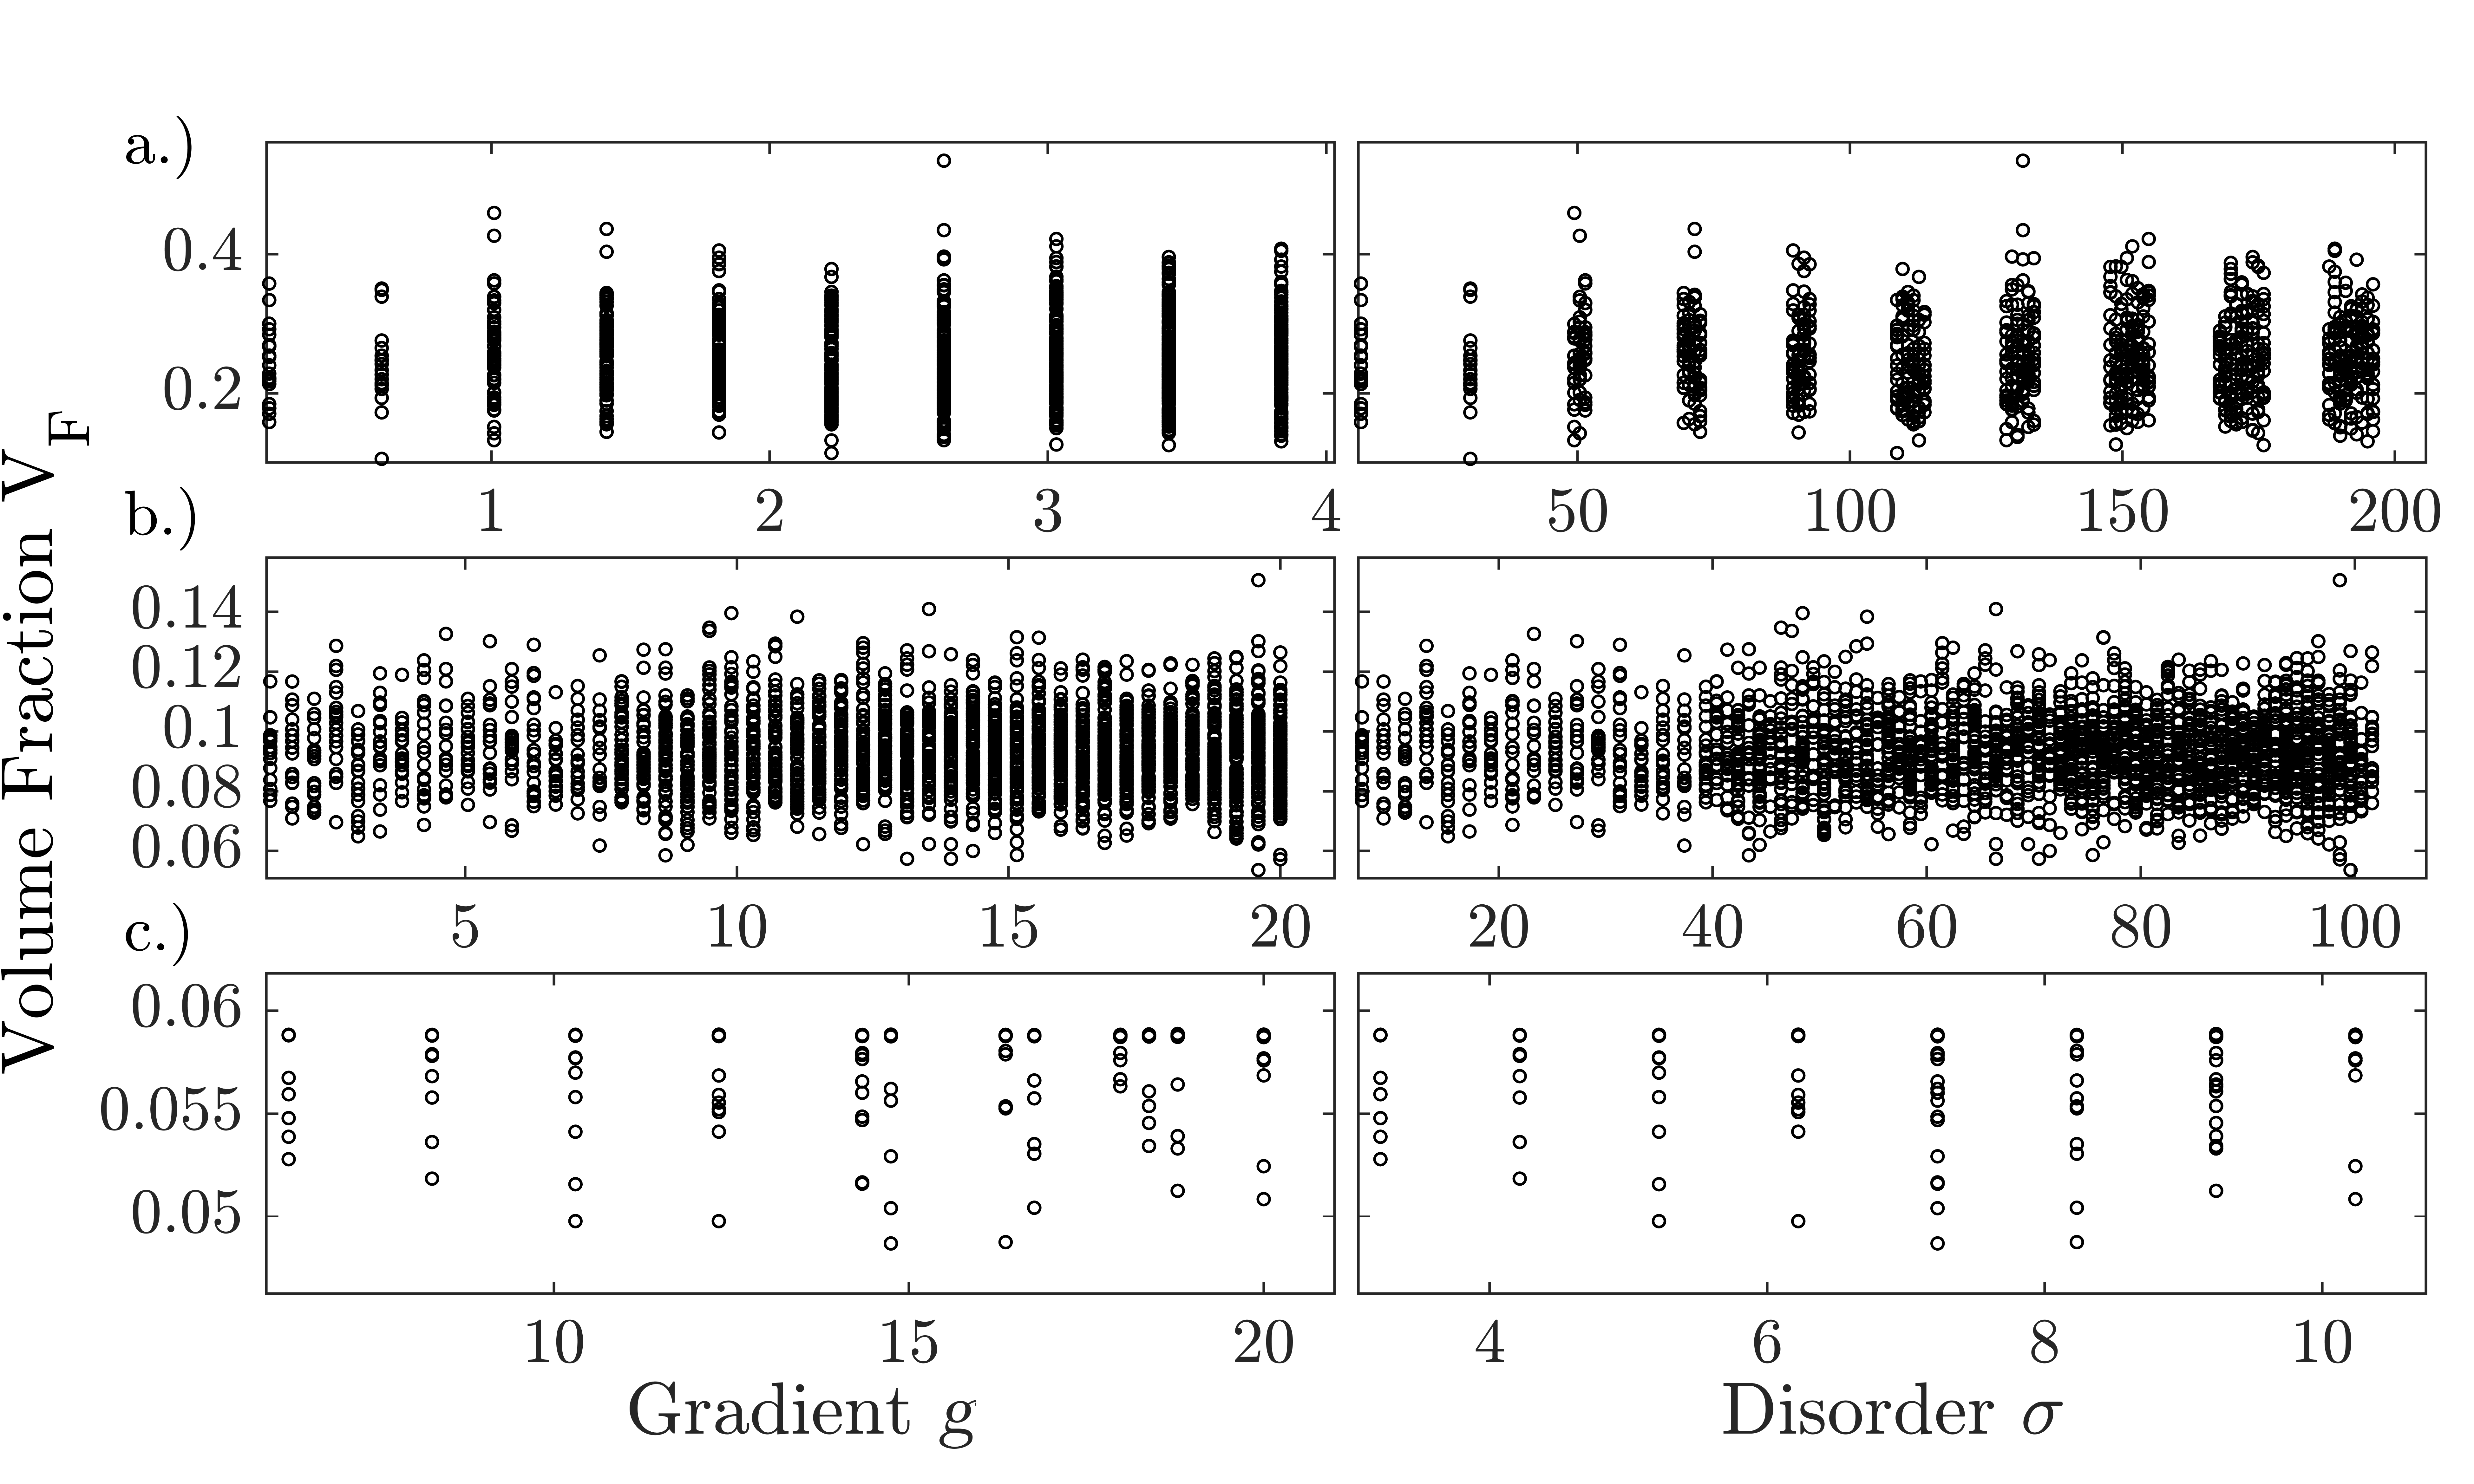
To verify that is an appropriate nondimensional parameter, we show that the volume fraction obtained in the simulations does not independently depend on or for a given value of . This finding is exemplified in Figure A.1: is not correlated with either (left column) or (right column) for three different values of , , and (rows a, b, and c respectively). Furthermore, we calculate the Pearson correlation coefficient , which is zero when variables and are uncorrelated and when they are perfectly correlated or anti-correlated. For columns a, b, and c, we find , , and , and , , and , indicating a lack of correlation.
References
- (1) L. Cueto-Felgueroso and R. Juanes, “Nonlocal interface dynamics and pattern formation in gravity-driven unsaturated flow through porous media,” Physical Review Letters, vol. 101, no. 24, p. 244504, 2008.
- (2) H. Bazyar, P. Lv, J. A. Wood, S. Porada, D. Lohse, and R. G. Lammertink, “Liquid–liquid displacement in slippery liquid-infused membranes (SLIMs),” Soft Matter, vol. 14, no. 10, pp. 1780–1788, 2018.
- (3) M. Sahimi, Flow and Transport in Porous Media and Fractured Rock: From classical methods to modern approaches. John Wiley & Sons, 2011.
- (4) S. Berg and H. Ott, “Stability of CO2–brine immiscible displacement,” International Journal of Greenhouse Gas Control, vol. 11, pp. 188–203, 2012.
- (5) C. M. Bethke, J. D. Reed, and D. F. Oltz, “Long-range petroleum migration in the Illinois Basin (1),” AAPG Bulletin, vol. 75, no. 5, pp. 925–945, 1991.
- (6) A. Y. Dandekar, Petroleum Reservoir Rock and Fluid Properties. CRC press, 2013.
- (7) S. M. Benson and F. M. Orr, “Carbon dioxide capture and storage,” MRS Bulletin, vol. 33, no. 4, pp. 303–305, 2008.
- (8) C. W. MacMinn, M. L. Szulczewski, and R. Juanes, “CO2 migration in saline aquifers. Part 1. Capillary trapping under slope and groundwater flow,” Journal of Fluid Mechanics, vol. 662, pp. 329–351, 2010.
- (9) E. Saadatpoor, S. L. Bryant, and K. Sepehrnoori, “New trapping mechanism in carbon sequestration,” Transport in Porous Media, vol. 82, no. 1, pp. 3–17, 2010.
- (10) U. C. Bandara, A. M. Tartakovsky, and B. J. Palmer, “Pore-scale study of capillary trapping mechanism during CO2 injection in geological formations,” International Journal of Greenhouse Gas Control, vol. 5, no. 6, pp. 1566–1577, 2011.
- (11) J. A. Neufeld and H. E. Huppert, “Modelling carbon dioxide sequestration in layered strata,” Journal of Fluid Mechanics, vol. 625, pp. 353–370, 2009.
- (12) J. Bear and A. H.-D. Cheng, Modeling Groundwater Flow and Contaminant Transport, vol. 23. Springer Science & Business Media, 2010.
- (13) H. E. Dawson and P. V. Roberts, “Influence of viscous, gravitational, and capillary forces on DNAPL saturation,” Groundwater, vol. 35, no. 2, pp. 261–269, 1997.
- (14) L. C. Levy, P. J. Culligan, and J. T. Germaine, “Modelling of DNAPL behavior in vertical fractures,” International Journal of Physical Modelling in Geotechnics, vol. 3, no. 1, pp. 01–18, 2003.
- (15) B. H. Kueper and E. O. Frind, “Two-phase flow in heterogeneous porous media: 1. Model development,” Water Resources Research, vol. 27, no. 6, pp. 1049–1057, 1991.
- (16) C. H. Lee, R. Banerjee, F. Arbabi, J. Hinebaugh, and A. Bazylak, “Porous transport layer related mass transport losses in polymer electrolyte membrane electrolysis: A review,” in Proceedings of the ASME 2016 14th International Conference on Nanochannels, Microchannels, and Minichannels, American Society of Mechanical Engineers, 2016.
- (17) M. Carmo, D. L. Fritz, J. Mergel, and D. Stolten, “A comprehensive review on PEM water electrolysis,” International Journal of Hydrogen Energy, vol. 38, no. 12, pp. 4901–4934, 2013.
- (18) H. S. Rabbani, D. Or, Y. Liu, C.-Y. Lai, N. B. Lu, S. S. Datta, H. A. Stone, and N. Shokri, “Suppressing viscous fingering in structured porous media,” Proceedings of the National Academy of Sciences, vol. 115, no. 19, pp. 4833–4838, 2018.
- (19) C. Cottin, H. Bodiguel, and A. Colin, “Influence of wetting conditions on drainage in porous media: A microfluidic study,” Physical Review E, vol. 84, no. 2, p. 026311, 2011.
- (20) M. Singh and K. K. Mohanty, “Dynamic modeling of drainage through three-dimensional porous materials,” Chemical Engineering Science, vol. 58, no. 1, pp. 1–18, 2003.
- (21) S. S. Datta, T. Ramakrishnan, and D. A. Weitz, “Mobilization of a trapped non-wetting fluid from a three-dimensional porous medium,” Physics of Fluids, vol. 26, no. 2, p. 022002, 2014.
- (22) S. S. Datta and D. A. Weitz, “Drainage in a model stratified porous medium,” EPL (Europhysics Letters), vol. 101, no. 1, p. 14002, 2013.
- (23) R. Lenormand, E. Touboul, and C. Zarcone, “Numerical models and experiments on immiscible displacements in porous media,” Journal of Fluid Mechanics, vol. 189, pp. 165–187, 1988.
- (24) Y. C. Yortsos, B. Xu, and D. Salin, “Phase diagram of fully developed drainage in porous media,” Physical Review Letters, vol. 79, no. 23, p. 4581, 1997.
- (25) B. Xu, Y. Yortsos, and D. Salin, “Invasion percolation with viscous forces,” Physical Review E, vol. 57, no. 1, p. 739, 1998.
- (26) R. Lenormand and C. Zarcone, “Capillary fingering: Percolation and fractal dimension,” Transport in Porous Media, vol. 4, no. 6, pp. 599–612, 1989.
- (27) R. Lenormand, C. Zarcone, and A. Sarr, “Mechanisms of the displacement of one fluid by another in a network of capillary ducts,” Journal of Fluid Mechanics, vol. 135, pp. 337–353, 1983.
- (28) R. Lenormand and C. Zarcone, “Invasion percolation in an etched network: Measurement of a fractal dimension,” Physical Review Letters, vol. 54, no. 20, p. 2226, 1985.
- (29) R. P. Mayer and R. A. Stowe, “Mercury porosimetry-breakthrough pressure for penetration between packed spheres,” Journal of Colloid Science, vol. 20, no. 8, pp. 893–911, 1965.
- (30) L. Xu, S. Davies, A. B. Schofield, and D. A. Weitz, “Dynamics of drying in 3D porous media,” Physical Review Letters, vol. 101, no. 9, p. 094502, 2008.
- (31) A. T. Krummel, S. S. Datta, S. Münster, and D. A. Weitz, “Visualizing multiphase flow and trapped fluid configurations in a model three-dimensional porous medium,” AIChE Journal, vol. 59, no. 3, pp. 1022–1029, 2013.
- (32) P. G. Toledo, L. Scriven, H. T. Davis, et al., “Pore-space statistics and capillary pressure curves from volume-controlled porosimetry,” SPE Formation Evaluation, vol. 9, no. 01, pp. 46–54, 1994.
- (33) G. Mason and N. Morrow, “Meniscus displacement curvatures of a perfectly wetting liquid in capillary pore throats formed by spheres,” Journal of Colloid and Interface Science, vol. 109, no. 1, pp. 46–56, 1986.
- (34) V. Joekar-Niasar and S. Hassanizadeh, “Analysis of fundamentals of two-phase flow in porous media using dynamic pore-network models: A review,” Critical Reviews in Environmental Science and Technology, vol. 42, no. 18, pp. 1895–1976, 2012.
- (35) K. J. Måløy, L. Furuberg, J. Feder, and T. Jøssang, “Dynamics of slow drainage in porous media,” Physical Review Letters, vol. 68, no. 14, p. 2161, 1992.
- (36) N. Martys, M. Cieplak, and M. O. Robbins, “Critical phenomena in fluid invasion of porous media,” Physical Review Letters, vol. 66, no. 8, p. 1058, 1991.
- (37) P. Ringrose, K. Sorbie, P. Corbett, and J. Jensen, “Immiscible flow behaviour in laminated and cross-bedded sandstones,” Journal of Petroleum Science and Engineering, vol. 9, no. 2, pp. 103–124, 1993.
- (38) R. J. Schaetzl and M. L. Thompson, Soils. Cambridge university press, 2015.
- (39) S. Ashraf and J. Phirani, “Capillary displacement of viscous liquids in a multi-layered porous medium,” Soft Matter, vol. 15, no. 9, pp. 2057–2070, 2019.
- (40) Y. Yokoyama, L. W. Lake, et al., “The effects of capillary pressure on immiscible displacements in stratified porous media,” in SPE Annual Technical Conference and Exhibition, Society of Petroleum Engineers, 1981.
- (41) L. W. Lake, G. J. Hirasaki, et al., “Taylor’s dispersion in stratified porous media,” Society of Petroleum Engineers Journal, vol. 21, no. 04, pp. 459–468, 1981.
- (42) L. Chatzis and S. Ayalollahi, “Investigation of the GAIGI process in stratified porous media for the recovery of waterflood residual oil,” in Technical Meeting/Petroleum Conference of The South Saskatchewan Section, Petroleum Society of Canada, 1995.
- (43) P. Meakin, A. Birovljev, V. Frette, J. Feder, and T. Jossang, “Gradient stabilized and destabilized invasion percolation,” Physica A, vol. 191, pp. 227–239, 1991.
- (44) P. Meakin, J. Feder, V. Frette, and T. Jossang, “Invasion percolation in a destabilizing gradient,” Physical Review A, vol. 46, no. 6, pp. 3357–3368, 1992.
- (45) M. Chaouche, N. Rakotomalala, D. Salin, B. Xu, and Y. Yortsos, “Invasion percolation in a hydrostatic or permeability gradient: Experiments and simulations,” Physical Review E, vol. 49, no. 5, pp. 4133–4139, 1994.
- (46) B. Xu, Y. Yortsos, and D. Salin, “Invasion percolation with viscous forces,” Physical Review E, vol. 57, no. 1, pp. 739–751, 1998.
- (47) Y. Yortsos, B. Xu, and D. Salin, “Delineation of microscale regimes of fully-developed drainage and implications for continuum models,” Computational Geosciences, vol. 5, pp. 257–278, 2001.
- (48) T. T. Al-Housseiny, P. A. Tsai, and H. A. Stone, “Control of interfacial instabilities using flow geometry,” Nature Physics, vol. 8, no. 10, p. 747, 2012.
- (49) S. Jackson, H. Power, D. Giddings, and D. Stevens, “The stability of immiscible viscous fingering in Hele-Shaw cells with spatially varying permeability,” Computer Methods in Applied Mechanics and Engineering, vol. 320, pp. 606–632, 2017.
- (50) D. Pihler-Puzović, P. Illien, M. Heil, and A. Juel, “Suppression of complex fingerlike patterns at the interface between air and a viscous fluid by elastic membranes,” Physical Review Letters, vol. 108, no. 7, p. 074502, 2012.
- (51) S. Biswas, P. Fantinel, O. Borgman, R. Holtzman, and L. Goehring, “Drying and percolation in spatially correlated porous media,” Physical Review Fluids, vol. 3, p. 124307, 2018.
- (52) Y. Chen, S. Fang, D.-S. Wu, and R. Hu, “Visualizing and quantifying the crossover from capillary fingering to viscous fingering in a rough fracture,” Water Resources Research, vol. 53, no. 9, pp. 7756–7772, 2017.
- (53) C. Chung and H.-Y. Lin, “Enhancing immiscible fluid displacement in porous media by capillary pressure discontinuities,” Transport in Porous Media, vol. 120, no. 2, pp. 309–325, 2017.
- (54) M. Chaouche, N. Rakotomalala, D. Salin, B. Xu, and Y. Yortsos, “Invasion percolation in a hydrostatic or permeability gradient: Experiments and simulations,” Physical Review E, vol. 49, no. 5, p. 4133, 1994.
- (55) A. Birovljev, L. Furuberg, J. Feder, T. Jssang, K. Mly, and A. Aharony, “Gravity invasion percolation in two dimensions: Experiment and simulation,” Physical Review Letters, vol. 67, no. 5, p. 584, 1991.
- (56) Y. Masson, “A fast two-step algorithm for invasion percolation with trapping,” Computers & Geosciences, vol. 90, pp. 41–48, 2016.
- (57) D. Wilkinson, “Percolation effects in immiscible displacement,” Physical Review A, vol. 34, no. 2, p. 1380, 1986.
- (58) Y. C. Yortsos, B. Xu, and D. Salin, “Delineation of microscale regimes of fully-developed drainage and implications for continuum models,” Computational Geosciences, vol. 5, no. 3, pp. 257–278, 2001.
- (59) S. Bradford and S. Torkzaban, “Colloid transport and retention in unsaturated porous media: A review of interface-, collector-, and pore-scale processes and models,” Vadose Zone Journal, vol. 7, no. 2, pp. 667–681, 2008.