On the disc reflection spectroscopy of NS LMXB Serpens X-1: analysis of a recent NuSTAR observation
Abstract
We present NuSTAR observation of the atoll type neutron star (NS) low-mass X-ray binary (LMXB) Serpens X-1 (Ser X-1) performed on 17 February 2018. We observed Ser X-1 in a soft X-ray spectral state with luminosity of erg s-1 ( of the Eddington luminosity), assuming a distance of 7.7 kpc. A positive correlation between intensity and hardness ratio suggests that the source was in the banana branch during this observation. The broadband NuSTAR energy spectrum can be well described either by a three-component continuum model consisting of a disk blackbody, a single temperature blackbody and a power-law or by a two-component continuum model consisting of a disk blackbody and a Comptonization component. A broad iron line keV and the Compton back-scattering hump peaking at band are clearly detected in the X-ray spectrum. These features are best interpreted by a self-consistent relativistic reflection model. Fits with relativistically blurred disc reflection model suggests that the inner disc radius is truncated prior to the ISCO at ( km) and the accretion disc is viewed at an low inclination of . The disc is likely to be truncated either by a boundary layer or by the magnetosphere. Based on the measured flux and the mass accretion rate, the maximum radial extension for the boundary layer is estimated to be from the NS surface. The truncated inner disc in association with pressure from a magnetic field sets an upper limit of G.
keywords:
accretion, accretion discs - stars: neutron - X-rays: binaries - stars: individual Ser X-11 introduction
A Neutron Star Low Mass X-ray Binary (NS LMXB) is a compact system composed of an NS and a low-mass () companion star. NS LMXBs are classified into two main groups based on their X-ray luminosity along with the spectral and the timing properties in X-rays (Hasinger & van der Klis, 1989). Those are the so-called “Z” sources, with luminosities close to or above the Eddington luminosity () and the “atoll” sources, with luminosities up to (Homan et al., 2010). The names of the Z and the atoll sources are related to the shape traced in the color-color diagram (CD). The Z sources show three-branches (the horizontal, the normal and the flaring branches) whereas the atoll sources show two main regions in the CD, the island state and isolated from it, the so-called banana branch. The X-ray spectra of the Z sources are soft in all branches and those of the atoll sources are soft at high luminosities and hard at low luminosities. The harder one is related to the island state and the softer one is related to the banana state which can be further divided into lower banana and upper banana states. However, the relation between the atoll and the Z-track sources is not well understood. Our understanding has improved with the discovery of the transient source XTE J1701-462 (Remillard et al., 2006) which shows all the characteristics of a Z source as well as an atoll source during the decaying phase of the outburst (Homan et al., 2010). This implies that whether an NS is an atoll or a Z type is mainly determined by the mass accretion rate (Lin et al., 2007).
In NS LMXBs, a geometrically thin, optically thick accretion disc is formed around the NS when it accretes matter from the companion star (Shakura & Sunyaev, 1973). The radiation from an accretion disc generates a quasi-thermal spectrum. The accretion discs are usually accompanied by a hot corona (Shakura & Sunyaev, 1973) and the coronal emission of such source generates a (cutoff) power-law spectrum by inverse Compton scattering of the thermal disc photon. It is well known that the spectrum from an accretion disc is a multicolor blackbody. At the same time, another hot single-temperature blackbody may potentially arise due to the emission from the boundary layer between the inner accretion disc and the NS surface. This hard X-ray emission (either a cutoff power-law in the hard state or a blackbody component in the soft state) can irradiate the accretion disc to produce a reflection spectrum. High energy photons tend to Compton scatter back out of the disc, resulting in a broad hump-like shape in the reflection spectrum (Ballantyne et al., 2001; Ross & Fabian, 2007). In addition, several narrow emission lines are produced among which Fe K fluorescent line is the most prominent one because of its high fluorescent yield and large cosmic abundance (Bhattacharyya & Strohmayer, 2007; Cackett et al., 2008; Pandel et al., 2008; Reis et al., 2009; Degenaar et al., 2015). The intrinsically narrow Fe K lines when appear in the X-ray spectra of LMXBs show a broad, asymmetric profile due to Doppler and gravitational shift (Fabian et al., 2000). Studies of Fe K line profile provide an independent view of the inner accretion flow in NS LMXBs which led to constraints to the inner disc structure and inclination. The accretion disc in NS systems could be truncated by the boundary layer between the disc and the NS surface or by a strong stellar magnetic field. Thus the inner disc radius may give an upper limit to the radius of the NS and hence can constrain the NS equation of state (Piraino et al., 2000; Cackett et al., 2008; Bhattacharyya, 2011). Alternatively, Fe K line profiles can also be used to obtain an upper limit on the strength of the magnetic field associated with the NS (Ludlam et al., 2019; Degenaar et al., 2016a; King et al., 2016).
The bright persistent atoll type NS LMXB Ser X-1 was discovered in 1965 (Bowyer et al., 1965). Type-1 thermonuclear X-ray bursts have been detected from the source in 1976 (Swank et al., 1976; Li et al., 1977) and it confirms that the compact object in this source is an NS. A super-burst with a duration of approximately 4-hours has also been reported (Cornelisse et al., 2002). The source is located at a distance of kpc (Galloway et al., 2008). The counterpart of Ser X-1 was identified with a main-sequence K-dwarf star (Cornelisse et al., 2013). After its discovery, it has been observed with all major X-ray missions like ASCA (Church & Balucińska-Church, 2001), BeppoSAX (Oosterbroek et al., 2001), RXTE (Oosterbroek et al., 2001), XMM-Newton (Bhattacharyya & Strohmayer, 2007), Suzaku (Cackett et al., 2010; Chiang et al., 2016b), Chandra (Chiang et al., 2016a) and NuSTAR (Miller et al., 2013; Matranga et al., 2017). Several continuum models were used in the previous works, using different combinations of disc blackbody, single temperature blackbody and power-law. Broadband observations preferred a continuum model consisting of all three components (Cackett et al., 2008, 2010; Miller et al., 2013; Chiang et al., 2016b). On the contrary, observations with limited energy ranges preferred two component continuum models, either a disc blackbody and a single temperature blackbody or a single temperature blackbody and a power-law (Bhattacharyya & Strohmayer, 2007; Chiang et al., 2016a). There are little spectral changes in this source as it is usually found in the soft state. Relativistic broad iron lines have been reported from almost all the previous observations (Bhattacharyya & Strohmayer, 2007; Cackett et al., 2010; Miller et al., 2013; Chiang et al., 2016b). Different self-consistent reflection models have been used to fit the reflection component. Matranga et al. (2017) stated that different results in different observations are probably due to different modelling of the continuum and/or the reflection component. Optical spectroscopy and some other X-ray reflection studies point towards a low binary inclination (Miller et al., 2013; Cornelisse et al., 2013), although some studies reported the inclination angle in between (Chiang et al., 2016a; Matranga et al., 2017; Cackett et al., 2010). Ser X-1 gives us an oppurtunity to detect multiple reflection features because of the low-amount of absorping material in the line of sight of Ser X-1 (corresponding to low neutral hydrogen column density cm-2 Dickey & Lockman 1990).
In the present work, we analyze the latest ks pile-up free NuSTAR observation of Ser X-1 with the main aim to study the reflection component and put constraints on the inner disk parameters. This observation also allows us to study the source broadband spectrum which is also important to constrain the reflection component such as the broad Fe emission line along with the Compton hump. In this NuSTAR observation, the source was captured with a lower luminosity compared to the previous NuSTAR observation performed in 2013 ( times more luminous than the present observation). So, this observation can be useful to test any possible disc truncation scenario at lower luminosity or lower Eddington fraction. This paper is organized in the following manner. First, we describe the observations and the details of data reduction in sec .2. In sec. 3 and sec. 4, we describe the temporal and spectral analysis, respectively. Finally, in sec.5, we discuss our findings.
2 observation and data reduction
After observing twice on 2013 July 12 and 13, NuSTAR observed the source Ser X-1 again on 2018 February 17 for a total exposure time of ks (Obs. ID: ). The two observations taken in 2013 have been analyzed by Miller et al. (2013) and Matranga et al. (2017). NuSTAR data of the source Ser X-1 were collected with the two co-aligned grazing incidence hard X-ray imaging Focal Plane Module telescopes (FPMA and FPMB) in the energy band.
We reprocessed the data with the standard NuSTAR data analysis software (NuSTARDAS v1.7.1) and CALDB (). Using the nupipeline tool (version v 0.4.6), we filtered the event lists. We used a circular extraction region with a radius of 100 arcsec centered around the source position to produce a source spectrum for both the telescopes, the FPMA and the FPMB. We used another 100 arcsec circular region away from the source position for the purpose of background subtraction. We created lightcurve, spectra and response files for the FPMA and the FPMB using the nuproducts tool. We grouped the FPMA and the FPMB spectral data with a minimum of 500 counts per bin (as the source is relatively bright) and fitted the two spectra simultaneously.
3 Temporal Analysis
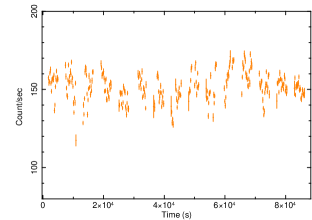
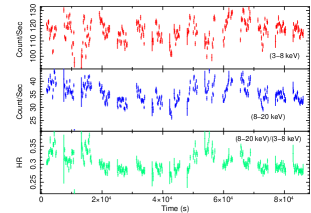
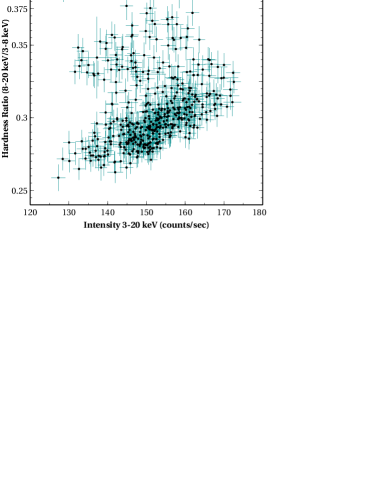
Left panel of Figure 1 shows the NuSTAR/FPMA light curve of Ser X-1 with a binning of 100 sec and spans ks. Ser X-1 is a bright X-ray source and in this observation it was detected at an average intensity of counts s-1. Ser X-1 is also known for the bursting behaviour but no X-ray bursts were observed during this observation. We also extracted the light curves in the and energy ranges, with a bin size of 100 s and presented those seperately in the right panel of Figure 1. We generated the hardness ratio (HR) between the photon counts in the above mentioned energy bands and displayed it in the right panel of Figure 1. The HR value, which is a broad measure of the spectral shape, remained fairly constant with a mean value of . Although a small count rate variability is observed in the and energy band, it is not associated with any significant change in the HR. It suggests that the spectral shape of the source remain stable during the whole span of this particular observation. Additionally, we generated the hardness-intensity diagram (HID), in which the HR ( to photon count ratio) is plotted as a function of the source intensity (), shown in Figure 2. In this observation, the HID shows that the HR is positively correlated with intensity for this source. In the case of atoll sources, the positive correlation between the hardness and the intensity is characteristic to the banana branch (Asai et al., 1993; Hasinger & van der Klis, 1989). This means that the source remained in the banana branch rather than in the island branch or in any other period of extreme or unusual behaviour during this observation. Previous NuSTAR observation was also found to sample the usual banana branch (Miller et al., 2013). However, it may be noted that the island state has so far not been observed from Ser X-1.
4 spectral analysis
We fitted both the NuSTAR FPMA and FPMB spectra simultaneously as initial fits revealed a good agreement between these two spectra. An initial inspection of the FPMA and the FPMB spectra also suggests that the source is detected significantly upto . We therefore performed the spectral analysis over the energy band using XSPEC v 12.9. We added a constant between the spectra to account for uncertainties in the flux calibration of the detectors. The constant was set 1 for the FPMA and left it free for the FPMB. A value of was measured for the FPMB. We modelled the interstellar absorption along the line of sight using the tbabs model with vern cross sections (Verner et al., 1996)and wilm abundances (Wilms et al., 2000). For each fit, we fixed the absorption column density to the Dickey & Lockman (1990) value of cm-2 as the NuSTAR data only extends down to and found it difficult to constrain from the spectral fits. All the uncertainties in this paper are quoted at of the confidence level if not stated otherwise in particular.
4.1 Continuum modeling
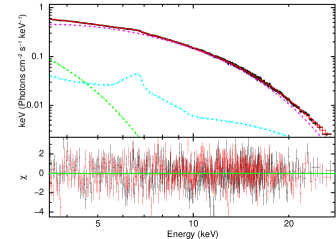
We fitted NuSTAR continuum to a model consisting of a disc blackbody component (diskbb in XSPEC), a single-temperature blackbody component (bbody in XSPEC) and a power-law component (powerlaw in XSPEC). This combination of models can be interpreted in terms of the emission from the accretion disc, the emission likely caused by the boundary layer/NS surface and the hard emission that may arise through the Comptonization of soft photons from high energy (thermal or non-thermal) electrons in the corona. This combination of models describes the shape of the continuum very well although the (=) is not acceptable because of the presence of the strong disc reflection features in the spectrum as it is evident in Figure 3. We note that, if we eliminate the powerlaw component from this continuum model, we get a worse fit, corresponding to a decrease of for the addition of two parameters when the powerlaw component is included in this fit. So, powerlaw component remains significant as it required to fit high-energy residuals of the atoll sources in the soft state (see e.g. Pintore et al. 2015; Iaria et al. 2001; Paizis et al. 2006; Tarana et al. 2007; Piraino et al. 2007; Fiocchi et al. 2006) and also for the Z-sources (e.g. Di Salvo et al. 2000). This combination of continuum model has been frequently used for the soft state spectra of many atoll type NS LMXBs (Lin et al., 2007; Cackett et al., 2010; Miller et al., 2013).
Emission from the boundary layer can also be modelled via low-temperature, optically thick Comptonization. To test this, we replaced the single-temperature blackbody component by the Comptonization model nthcomp (Zdziarski et al., 1996; Życki et al., 1999) in XSPEC, setting the seed photon spectral shape to a blackbody. Such replacement gives a similar quality fit (=) in comparison with the simpler continuum model. It may be noted that, the norm of the powerlaw component becomes remarkably small () which indicates that the powerlaw component appears to be much weaker in this case. Moreover, the elimination of the powerlaw component from the fit does not lead to any notable change in the value of the . Therefore, we remove this component from this fit as it is not statistically required. As both the models, a simpler continuum tbabs(diskbb+bbody+powerlaw) and a continuum consisting of a Comptonized component and a disc blackbody tbabs(diskbb+nthcomp) represent the continuum fairly well, we proceed with both choices of the continuum models and use those in all the following analyses.

4.2 Reflection Model
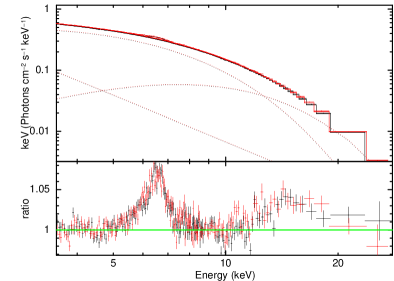
There are two strong emission features around and (see Figure 3), indicating the presence of a reflection component in the Fe K region and the corresponding Compton back-scattering hump.
In NS systems, the accretion disc may be illuminated by the thermal emission coming from the boundary layer of the NS or by the Comptonization continuum, resulting in reflected emission. In this observation the continuum of Ser X-1 is dominated by the blackbody component. We therefore included a modified version of the reflionx 111https://www-xray.ast.cam.ac.uk/~mlparker/reflionx_models
/reflionx_bb.mod model (reflionxbb) that assumes that the disc is illuminated by a blackbody, rather than a power-law (see e.g. Cackett et al. 2010; King et al. 2016; Degenaar et al. 2016b). As the replacement of the hot blackbody component with the Comptonization model provides similar description of the continuum, we have used in this case the standard reflionx model although modified in order to mimic a Comptonization input spectrum (see below). The parameters of the reflionxbb model include the disc ionization parameter (), the iron abundance (), the temperature of the ionizing black body flux and a normalization . In order to account for relativistic Doppler shifts and the gravitational redshifts, we convolved reflionxbb with relconv (Dauser et al., 2010). Its parameters include the inner and the outer disc emissivity indices (), break radius (), the inner and outer disk radii and , the disk inclination () and the dimensionless spin parameter (). In our fits, we used a constant emissivity index (fixed slope) by fixing which essentially obviates the meaning of .
We imposed a few reasonable conditions when making fits with reflection models. We set the emissivity to , in agreement with a Newtonian geometry far from the NS (Cackett et al., 2010). We set a redshift of since Ser X-1 is a Galactic source. We fixed the spin parameter since most NS in LMXBs have (Galloway et al., 2008; Miller et al., 2011). The difference of measurement of the position of the between and is less than (where . The dimensionless spin parameter can be approximated as (Braje et al., 2000) where is the spin period in ms. The spin period of the source Ser X-1 is unknown as kHz quasi-periodic oscillations (QPOs) and burst oscillations have not been detected so far. We therefore performed the fit with as well as and found that both the fit yielded similar results. The outer disc radius was fixed to . In order to get a consistent result, we linked the reflected blackbody temperature in the reflionxbb model to the temperature of the blackbody component .
The addition of the relativistic reflection model improves the spectral fits significantly (=). The best-fitting parameters for the continuum and the reflection spectrum are reported in Table 1. Our fits suggest that the inner disc is truncated prior to the ISCO at ( km), in agreement with Matranga et al. (2017). The inclination angle is found to be in agreement with the fact that neither dips nor eclipses have been observed in the light curve of Ser X-1. This result is in line with a general agreement that the inclination angle in this source is relatively low () as observed by other authors (see e.g. Matranga et al. 2017; Cackett et al. 2010; Ludlam et al. 2018), although Miller et al. (2013) and Optical observations (Cornelisse et al., 2013) pointed to a very low inclination angle of the system ( or less). The reflection component has an intermediate disc ionization of erg s-1 cm which is consistent with seen in other NS LMXBs (see e.g. Cackett et al. 2010). The iron abundance is found to be . The fitted spectrum with relativistically blurred reflection model and the residuals are shown in the left panel of Figure 4.
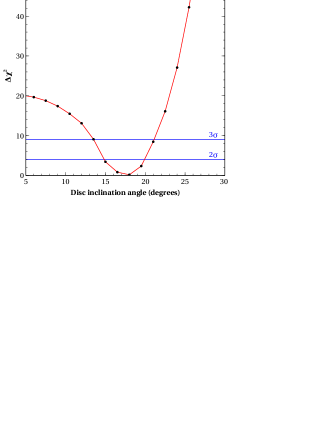
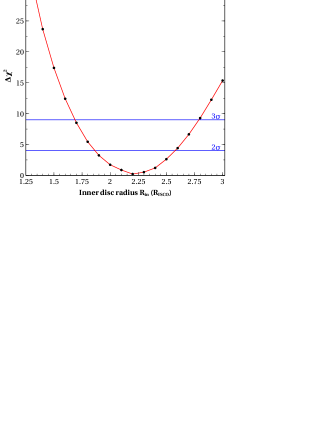
We computed for the parameters inner disc radius () and disc inclination angle () using steppar command in xspec to determine how the goodness-of-fit changed as a function of these parameters. The plots of versus and for the best-fit model are shown in the left and right panel of Figure 5, respectively. These plots illustrate the sensitivity of the spectra to the inner extent of the disc as well as to the disc inclination angle. This suggests that the inner disc is truncated prior to the ISCO and this result is in agreement with what is found by Matranga et al. (2017).
Considering the fact that the reflection parameters are mostly constrained by the iron line, we have attempted to fit the data with a relativistic line profile, relline model which excludes the broadband features such as the Compton hump seen around . We measured a line centroid energy of keV. The value for the inner disc radius, is consistent with our above estimation. We have found a small inclination of which is also comparable to the previous NuSTAR observation. However, the relline model, with =, is not as good a fit as the broadband reflection model described above (=). It suggests that the broadband reflection spectrum does make a significant contribution. It may be noted that the line centroid energy is quite inconsistent with a relatively low ionization parameter ( erg s-1 cm) found with the reflection model. This may be caused by the fact that the model relline does not contain the iron edge that is also present in the reflection component. The lack of this feature may shift the energy of the line to higher values, and produce different best-fit values of the parameters.
We note that, Matranga et al. (2017) re-analysed the same NuSTAR dataset (obsID: and )
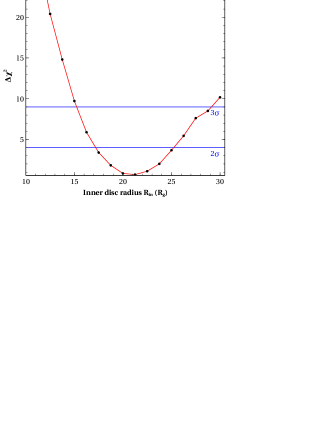
analysed by Miller et al. (2013) using a different choice of the continuum and reflection models. They found that the use of the Comptonization model as a continuum component changed the disc parameters recovered from the reflection component. In the present NuSTAR observation, we have already established that a continuum model consisting of a Comptonized component represents the continuum very well. With this continuum model, we tried to fit the reflection component with the standard reflionx (Ross & Fabian, 2005) model that assumes a high energy exponential cutoff power-law irradiating the accretion disc. As cutoff energy of the illuminating power law in the reflionx model is set to , we have modified reflionx in such a manner that it mimics the nthcomp continuum. In doing so, we followed exactly the method described by Matranga et al. (2017). In order to consider the high-energy rollover of the Comptonization spectrum, we multiplied reflionx by a high energy cutoff, highecut in XSPEC, with the low-energy cutoff () fixed to keV. The folding energy was initially set to times of the electron temperature (). We fixed the photon index () of the illuminating spectrum to that of the nthcomp component. Thus, we have modified the reflection model reflionx in order to reproduce the nthcomp continuum by introducing the model component highecut (for details see Matranga et al. 2017). To take relativistic blurring into account, we have convolved reflionx with rdblur component. Since relativistic effects are not extreme for this source, for sake of simplicity we used the rdblur component instead of relconv in this case. The rdblur component depends on the values of the inner and outer disc radii, the inclination angle of the disc and the emissivity index (Betor) which is the index of the power-law dependence of the emissivity of the illuminated disk (scales as ). We have performed this fit setting Betor=, outer disc radius to and to . This has improved the fit significantly to =. This fit changes the results for important parameter to but inclination remains quite similar () to the previous estimation. All the other best-fit parameter values are listed in Table 2. The fitted spectrum with this modified relativistically blurred reflection model and the residuals are shown in the right panel of Figure 4. We have computed the variation of as a function of inner disc radius in between and and plotted it in Figure 6. We have compared the final results of the reflection component when the simpler continuum or a continuum consisting of a Comptonized component are used.
Reflection features are better explained by the utilization of the self-consistent reflection model RELXILL. Different new flavors of the RELXILL model are available today. RELXILLCP, a flavor of RELXILL, allows one to use reflection from a Comptonized disc component. This model has a hard-coded seed photon temperature of keV. Since we found a higher seed photon temperature of keV in our continuum fit with nthcomp, we did not attempt to use RELXILLCP. Probably this model is not appropriate to describe this particular spectral state. We do not comment on it further.
| Component | Parameter (unit) | Value |
|---|---|---|
| tbabs | () | |
| diskbb | () | |
| norm [(km/10 kpc)cos] | ||
| bbody | ||
| norm () | ||
| powerlaw | ||
| norm | ||
| relconv | (degrees) | |
| () | ||
| reflionx | (erg cm s-1) | |
| (keV) | ||
| ( | ||
| norm | ||
| ( ergs/s/cm2) | ||
| ( ergs/s/cm2) | ||
| ( ergs/s/cm2) | ||
| ( ergs/s/cm2) | ||
| ( ergs/s/cm2) | ||
| ( ergs/s) | ||
Note: Here we have used a modified version of the reflionx (reflionxbb) that assumes that the disc is illuminated by a blackbody rather than a power-law. The outer radius of the relconv spectral component was fixed to . The dimensionless spin parameter () and redshift () were set to zero. We fixed emissivity index , assumed a distance of 7.7 kpc and a mass of for calculating the luminosity. The diskbb and bbody normalizations imply radii of km and km respectively, after applying color corrections.
∗All the unabsorbed fluxes are calculated in the energy band .
| Component | Parameter (unit) | Value |
|---|---|---|
| tbabs | () | |
| diskbb | () | |
| norm [(km/10 kpc)cos] | ||
| nthcomp | ||
| norm | ||
| highecut | () | |
| () | ||
| rdblur | (degrees) | |
| () | ||
| reflionx | (erg cm s-1) | |
| ( | ||
| norm () | ||
Note: Here we have used the standard reflionx model that assumes a high energy exponential cutoff power-law irradiating the accretion disc, modified in such a manner that it mimics the nthcomp continuum (see text). The outer radius of the rdblur spectral component was fixed to . We fixed emissivity index (betor) to . The parameter is fitted to be 3 times the . The diskbb normalization implies a radius of km after applying color corrections.
| Observation | L/ | Radius |
|---|---|---|
| XMM1 (2004, Obs ID 0084020401) | ||
| XMM1 (2004, Obs ID 0084020501) | ||
| XMM1 (2004, Obs ID 0084020601) | ||
| Suzaku1 (2006) | ||
| NuSTAR2 (2013) | ||
| NuSTAR3 (2013) | ||
| Chandra4 (2014) | ||
| Suzaku5 (2014) | ||
| NuSTAR6 (2018) |
Information collected from 1Cackett et al. (2010), 2Miller et al. (2013), 3Matranga et al. (2017), 4Chiang et al. (2016a), 5Chiang et al. (2016b), 6present work. The luminosity was calculated based on the absorption-corrected flux and a distance of kpc. For more details see Table 4 of Chiang et al. (2016b).
5 Discussion
We present here a new NuSTAR observation of the bright atoll type NS LMXB Ser X-1. The source displayed a particularly soft spectrum with the luminosity of ergs s-1 which corresponds to of the Eddington luminosity assuming a distance of 7.7 kpc. The hardness-intensity diagram suggests that the source was in the so-called banana branch during this observation. The broad-band NuSTAR energy spectrum can be well described either by a three-component continuum model consisting of a disk blackbody (diskbb), a single temperature blackbody (bbody) and a power-law (powerlaw) or by a two-component continuum model consisting of a disk blackbody (diskbb) and a Comptonization spectrum (nthcomp). Thermal emission from the accretion disc is prominently detected in the X-ray spectrum. In the X-ray spectrum, we clearly detected a broad iron line keV and the Compton back-scattering hump peaking at band, indicating the signature of disc reflection phenomenon. The emission from the boundary layer (modelled either by a single temperature hot blackbody or the Comptonization spectrum) provides most of the hard X-ray flux that illuminates the accretion disc and produces the reflection spectrum. Reflection features are best interpreted by a relativistically blurred self-consistent disc reflection model. We have tested different type of reflection models in which the illuminating continuum is different. The shape of the resulting reflection spectrum is determined by the nature of the illuminating continuum that provides the hard X-rays. The major difference between the reflection models used is that one (reflionx) assumes a blackbody irradiating the disc and another (reflionx) using a cutoff power-law input spectrum. Studies on reflection spectra provides valuable insight into the accretion geometry, such as the inner radius and the inclination of the accretion disc and the upper limit on the radius of the NS.
From the reflection fit that assumes a blackbody input spectrum, we found that the inner edge of the accretion disc is truncated prior to the ISCO at , given that for an NS spinning at . This would correspond to or km for a NS. The inner disc radius of the source Ser X-1 has been measured by different authors (Ludlam et al., 2018; Chiang et al., 2016b, a; Bhattacharyya & Strohmayer, 2007; Matranga et al., 2017; Cackett et al., 2010; Miller et al., 2013) in different flux states using data taken from different satellite missions (see Table 3). The inner disc radius spans a range between and the luminosity between erg s-1 (corresponding to . Therefore, our estimated inner disc radius for Ser X-1 lies within the range obtained from different X-ray missions. The inclination of the system measured from the reflection fit is which is expected as comparatively low inclination has been reported in a series of past work (Matranga et al. 2017; Cackett et al. 2010; Ludlam et al. 2018). From the previous NuSTAR observation, Miller et al. (2013) derived an inner radius of the disc broadly compatible with the disc extending to the ISCO and an inclination angle , whereas Matranga et al. (2017) re-analyzed the same NuSTAR observation with a different combination of the continuum and reflection model and reported the inner disc radius to be with an inclination angle . Therefore, the inferred values of the inner disc radius () and the inclination angle () from our analysis are not as extreme as reported by Miller et al. (2013) but instead are more in line with what is reported by Matranga et al. (2017).
We found that a continuum model, composed of a disk blackbody (diskbb), a single temperature blackbody (bbody) and a power-law (powerlaw) provided a good description of the spectrum. Additionally, we model the continuum emission with a Comptonized continuum (nthcomp) along with a diskbb. This combination of the continuum model also represents the spectrum fairly well. Reflection features were prominent for both the continuum models. We applied a different relativistically blurred self-consistent disc reflection model according to the nature of the continuum modeling. We wanted to examine how the choice of continuum and reflection models can affect the important disc parameters ( and ) inferred from the reflection component. For the continuum containing a Comptonization component, we used a modified version of reflionx in order to mimic the nthcomp continuum by introducing the model component highecut (for details see Matranga et al. 2017). With this choice of continuum and reflection model, we estimated an inner radius of the disc ranging from to and an inclination angle of the system of . We note that the inclination angle is consistent with our previous estimation but we found a higher value of the inner disc radius. The inferred values are also in broad agreement with what is reported by other authors.
In order to see how the inner disc radius evolves with luminosity, we plotted all the inner radius obtained from different observations taken at different flux states and displayed it in Figure 7.
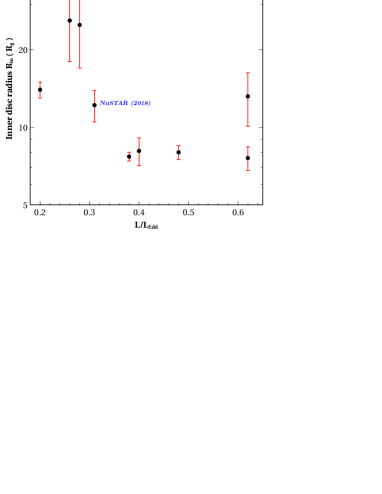
It is suggested from Figure 7 that comparatively larger values of the inner disc radius are obtained in the lower luminosity states when . At the same time, inner disc radius does not appear to change much when except for the last point which reflects the result of Matranga et al. (2017). So, the accretion disc is likely to be truncated at larger radius at fluxes (see also Chiang et al. 2016b). This statement is driven by the two higher points with large errors bars and with the exception of the last point. The larger inner radii are mainly obtained from the XMM-Newton observations which are less reliable in comparison to other archival data due to short exposure and calibration issues of EPIC-PN timing mode data (Walton et al., 2012). From the previous NuSTAR observation, Miller et al. (2013) found the inner disc radius to be when the luminosity of the source was erg s-1 ( of the Eddington luminosity) based on flux and assuming a distance of kpc. From this observation, we found an inner disc radius when the source luminosity was erg s-1 ( of the Eddington luminosity) based on flux and a assuming the same distance of kpc. Moreover, it may be noted that Matranga et al. (2017) have re-analyzed the same NuSTAR observation as done by Miller et al. (2013) with a slightly different continuum and reflection models and found the inner disc radius to be which is consistent with our estimation. Therefore, if we compare the inner disc radius obtained by us with that obtained by Miller et al. (2013), it seems that the disc appears to move outward during the low luminosity state. But contradiction comes if we compare it with Matranga et al. (2017) as our result is consistent with their estimation. So, the commonly assumed fact that the accretion disc in LMXBs moves away from the NS when the X-ray luminosity decays (Ludlam et al., 2017) is not clearly seen based on the NuSTAR observations. This is in agreement with previous results based on the source 4U 1705–44 (see e.g. Egron et al. 2013; Di Salvo et al. 2015).
The ISCO of a gravitating source depends on the mass and radius of the NS. The value of ISCO lie somewhere between for some reasonable parameters. Our measured inner disc radius of is therefore larger than the expected ISCO and the NS surface. The disc could therefore be truncated by either the boundary layer which lies between the disc and the NS surface or by the associated NS magnetic field. From the persistent flux () and the distance () of the source, we estimate the mass accretion rate () per unit area at the NS surface (Galloway et al., 2008). Here we used Equation (2) of Galloway et al. (2008)
| (1) |
where is the bolometric correction which is for the nonpulsing sources (Galloway et al., 2008). and are the mass and radius of the NS, respectively. is the surface redshift and for a NS with mass 1.4 and radius 10 km. We determine the mass accretion rate using erg s-1 cm-2 to be during this observation. Similar mass accretion rates are usually observed when the atoll sources lie in the banana branch. From the inferred mass accretion rate, we estimate the maximum radial extent () of the boundary layer region using Equation (2) of Popham & Sunyaev (2001)
| (2) |
It gives a maximum radial extent of for the boundary layer (assuming and km). So, the radial extent of the boundary layer is indeed in agreement with the position of the inner disk.
There is also the possibility that the magnetic field is responsible for the disc truncation in this source. If the disc is truncated by the magnetosphere, we can estimate an upper limit on the strength of the magnetic field of the NS using the upper limit of measured from the reflection fit. We used Equation (1) of Cackett et al. (2009) to calculate the magnetic dipole moment (). Assuming a mass of , taking the distance to be kpc and using the unabsorbed flux from of erg cm-2 s-1 as the bolometric flux (), we determine G cm3 (assuming which is a factor depending on the geometry, spherical or disk-like, of the accretion flow, which is known as the anisotrophy correction factor and accretion efficiency in the Schwarzschild metric ). This corresponds to a magnetic field strength of G at the magnetic poles for a NS of radius 10 km. This order of magnetic field has the potential to truncate an accretion disc far from the stellar surface (Mukherjee et al., 2015). NSs can produce coherent pulsations from the polar caps if the magnetic field truncates the disc. Although, coherent pulsations have never been observed in this source so far, the source could still be magnetically accreting. Pulsations would be undetectable if either the hot spot is nearly aligned with the spin axis or the modulated emission is scattered by the circumstellar gas. For a comprehensive discussion over the issue we refer to Lamb et al. (1985).
Another possibility of disc truncation may be due to the state transition associated with a receding disc which is related with a low luminosity and hard power-law dominated X-ray spectra (Esin et al., 1997). The Ser X-1 spectra presented here are taken in a soft, high luminosity state. Moreover, no state transition has been observed from the HR or HID. Significant disc truncation only occurs at a high enough magnetic field and low mass accretion rate, although there are examples where disc truncation occurs at higher luminosities too (King et al., 2016). Therefore, a significant disc truncation scenario can only be tested if the source Ser X-1 is observed in a low luminosity and hard spectral state. So, the evolution of the inner disc radius remains unclear as the source has only been observed in the high luminosity and soft spectral state.
6 Acknowledgements
We thank the anonymous referee for their thoughtful comments which have improved the quality of the paper considerably. This research has made use of data and/or software provided by the High Energy Astrophysics Science Archive Research Centre (HEASARC). This research also has made use of the NuSTAR data analysis software (NuSTARDAS) jointly developed by the ASI science center (ASDC, Italy) and the California Institute of Technology (Caltech, USA). ASM and BR like to thank Inter-University Centre for Astronomy and Astrophysics (IUCAA) for their hospitality and facilities extended to them under their Visiting Associate Programme.
References
- Asai et al. (1993) Asai K., Dotani T., Nagase F., Mitsuda K., Kitamoto S., Makishima K., Takeshima T., Kawabata K., 1993, PASJ, 45, 801
- Ballantyne et al. (2001) Ballantyne D. R., Ross R. R., Fabian A. C., 2001, MNRAS, 327, 10
- Bhattacharyya (2011) Bhattacharyya S., 2011, MNRAS, 415, 3247
- Bhattacharyya & Strohmayer (2007) Bhattacharyya S., Strohmayer T. E., 2007, ApJl, 664, L103
- Bowyer et al. (1965) Bowyer S., Byram E. T., Chubb T. A., Friedman H., 1965, Science, 147, 394
- Braje et al. (2000) Braje T. M., Romani R. W., Rauch K. P., 2000, ApJ, 531, 447
- Cackett et al. (2009) Cackett E. M., Altamirano D., Patruno A., Miller J. M., Reynolds M., Linares M., Wijnands R., 2009, ApJl, 694, L21
- Cackett et al. (2010) Cackett E. M. et al., 2010, ApJ, 720, 205
- Cackett et al. (2008) Cackett E. M. et al., 2008, ApJ, 674, 415
- Chiang et al. (2016a) Chiang C.-Y. et al., 2016a, ApJ, 821, 105
- Chiang et al. (2016b) Chiang C.-Y., Morgan R. A., Cackett E. M., Miller J. M., Bhattacharyya S., Strohmayer T. E., 2016b, ApJ, 831, 45
- Church & Balucińska-Church (2001) Church M. J., Balucińska-Church M., 2001, A&A, 369, 915
- Cornelisse et al. (2013) Cornelisse R., Casares J., Charles P. A., Steeghs D., 2013, MNRAS, 432, 1361
- Cornelisse et al. (2002) Cornelisse R., Kuulkers E., in’t Zand J. J. M., Verbunt F., Heise J., 2002, A&A, 382, 174
- Dauser et al. (2010) Dauser T., Wilms J., Reynolds C. S., Brenneman L. W., 2010, MNRAS, 409, 1534
- Degenaar et al. (2016a) Degenaar N. et al., 2016a, MNRAS, 461, 4049
- Degenaar et al. (2016b) Degenaar N., Koljonen K. I. I., Chakrabarty D., Kara E., Altamirano D., Miller J. M., Fabian A. C., 2016b, MNRAS, 456, 4256
- Degenaar et al. (2015) Degenaar N., Miller J. M., Chakrabarty D., Harrison F. A., Kara E., Fabian A. C., 2015, MNRAS, 451, L85
- Di Salvo et al. (2015) Di Salvo T. et al., 2015, MNRAS, 449, 2794
- Di Salvo et al. (2000) Di Salvo T. et al., 2000, ApJl, 544, L119
- Dickey & Lockman (1990) Dickey J. M., Lockman F. J., 1990, ARAA, 28, 215
- Egron et al. (2013) Egron E. et al., 2013, A&A, 550, A5
- Esin et al. (1997) Esin A. A., McClintock J. E., Narayan R., 1997, ApJ, 489, 865
- Fabian et al. (2000) Fabian A. C., Iwasawa K., Reynolds C. S., Young A. J., 2000, PASP, 112, 1145
- Fiocchi et al. (2006) Fiocchi M., Bazzano A., Ubertini P., Jean P., 2006, ApJ, 651, 416
- Galloway et al. (2008) Galloway D. K., Muno M. P., Hartman J. M., Psaltis D., Chakrabarty D., 2008, ApJS, 179, 360
- Hasinger & van der Klis (1989) Hasinger G., van der Klis M., 1989, A&A, 225, 79
- Homan et al. (2010) Homan J. et al., 2010, ApJ, 719, 201
- Iaria et al. (2001) Iaria R., Di Salvo T., Burderi L., Robba N. R., 2001, ApJ, 548, 883
- King et al. (2016) King A. L. et al., 2016, ApJl, 819, L29
- Lamb et al. (1985) Lamb F. K., Shibazaki N., Alpar M. A., Shaham J., 1985, Nature, 317, 681
- Li et al. (1977) Li F. K., Lewin W. H. G., Clark G. W., Doty J., Hoffman J. A., Rappaport S. A., 1977, MNRAS, 179, 21P
- Lin et al. (2007) Lin D., Remillard R. A., Homan J., 2007, ApJ, 667, 1073
- Ludlam et al. (2018) Ludlam R. M. et al., 2018, ApJl, 858, L5
- Ludlam et al. (2019) Ludlam R. M. et al., 2019, ApJ, 873, 99
- Ludlam et al. (2017) Ludlam R. M., Miller J. M., Degenaar N., Sanna A., Cackett E. M., Altamirano D., King A. L., 2017, ApJ, 847, 135
- Matranga et al. (2017) Matranga M., Di Salvo T., Iaria R., Gambino A. F., Burderi L., Riggio A., Sanna A., 2017, A&A, 600, A24
- Miller et al. (2011) Miller J. M., Maitra D., Cackett E. M., Bhattacharyya S., Strohmayer T. E., 2011, ApJl, 731, L7
- Miller et al. (2013) Miller J. M. et al., 2013, ApJl, 779, L2
- Mukherjee et al. (2015) Mukherjee D., Bult P., van der Klis M., Bhattacharya D., 2015, MNRAS, 452, 3994
- Oosterbroek et al. (2001) Oosterbroek T., Barret D., Guainazzi M., Ford E. C., 2001, A&A, 366, 138
- Paizis et al. (2006) Paizis A. et al., 2006, A&A, 459, 187
- Pandel et al. (2008) Pandel D., Kaaret P., Corbel S., 2008, ApJ, 688, 1288
- Pintore et al. (2015) Pintore F. et al., 2015, MNRAS, 450, 2016
- Piraino et al. (2007) Piraino S., Santangelo A., di Salvo T., Kaaret P., Horns D., Iaria R., Burderi L., 2007, A&A, 471, L17
- Piraino et al. (2000) Piraino S., Santangelo A., Kaaret P., 2000, A&A, 360, L35
- Popham & Sunyaev (2001) Popham R., Sunyaev R., 2001, ApJ, 547, 355
- Reis et al. (2009) Reis R. C., Fabian A. C., Young A. J., 2009, MNRAS, 399, L1
- Remillard et al. (2006) Remillard R. A., Lin D., ASM Team at MIT, NASA/GSFC, 2006, The Astronomer’s Telegram, 696, 1
- Ross & Fabian (2005) Ross R. R., Fabian A. C., 2005, MNRAS, 358, 211
- Ross & Fabian (2007) Ross R. R., Fabian A. C., 2007, MNRAS, 381, 1697
- Shakura & Sunyaev (1973) Shakura N. I., Sunyaev R. A., 1973, A&A, 500, 33
- Swank et al. (1976) Swank J. H., Becker R. H., Pravdo S. H., Serlemitsos P. J., 1976, IAUC, 2963, 1
- Tarana et al. (2007) Tarana A., Bazzano A., Ubertini P., Zdziarski A. A., 2007, ApJ, 654, 494
- Verner et al. (1996) Verner D. A., Ferland G. J., Korista K. T., Yakovlev D. G., 1996, ApJ, 465, 487
- Walton et al. (2012) Walton D. J., Reis R. C., Cackett E. M., Fabian A. C., Miller J. M., 2012, MNRAS, 422, 2510
- Wilms et al. (2000) Wilms J., Allen A., McCray R., 2000, ApJ, 542, 914
- Zdziarski et al. (1996) Zdziarski A. A., Johnson W. N., Magdziarz P., 1996, MNRAS, 283, 193
- Życki et al. (1999) Życki P. T., Done C., Smith D. A., 1999, MNRAS, 309, 561