MIMIC-Extract: A Data Extraction, Preprocessing, and Representation Pipeline for MIMIC-III
Abstract.
Machine learning for healthcare researchers face challenges to progress and reproducibility due to a lack of standardized processing frameworks for public datasets. We present MIMIC-Extract, an open source pipeline for transforming the raw electronic health record (EHR) data of critical care patients from the publicly-available MIMIC-III database into data structures that are directly usable in common time-series prediction pipelines. MIMIC-Extract addresses three challenges in making complex EHR data accessible to the broader machine learning community. First, MIMIC-Extract transforms raw vital sign and laboratory measurements into usable hourly time series, performing essential steps such as unit conversion, outlier handling, and aggregation of semantically similar features to reduce missingness and improve robustness. Second, MIMIC-Extract extracts and makes prediction of clinically-relevant targets possible, including outcomes such as mortality and length-of-stay, as well as comprehensive hourly intervention signals for ventilators, vasopressors, and fluid therapies. Finally, the pipeline emphasizes reproducibility and is extensible to enable future research questions. We demonstrate the pipeline’s effectiveness by developing several benchmark tasks for outcome and intervention forecasting and assessing the performance of competitive models.
Introduction
Applying modern machine learning to observational health data holds the potential to improve healthcare in many ways, such as delivering better patient treatments, improving hospital operations, and answering fundamental scientific questions (Ghassemi et al., 2018). To realize this potential, there have been efforts to make healthcare data available to credentialed researchers with human subjects training. A widely-used public data source is the Medical Information Mart for Intensive Care (MIMIC-III) dataset (Johnson et al., 2016), which makes available the de-identified electronic health records (EHRs) of 53,423 patients admitted to critical care units at a Boston-area hospital from 2001–2012. While MIMIC-III’s availability has catalyzed many research studies, working with MIMIC-III data remains technically challenging, which presents a barrier to entry. The primary difficulties rest in the complexity of EHR data and the myriad choices that must be made to extract a clinically-relevant cohort for analysis. These same difficulties hinder the reproducibility of studies that apply machine learning to MIMIC-III data, because researchers develop code independently to extract and preprocess task-appropriate cohorts. The majority of papers do not share code used to extract study-specific data (Johnson et al., 2017a), resulting in expensive yet redundant efforts to build upon existing work and creating the potential for hard-to-explain differences in results.
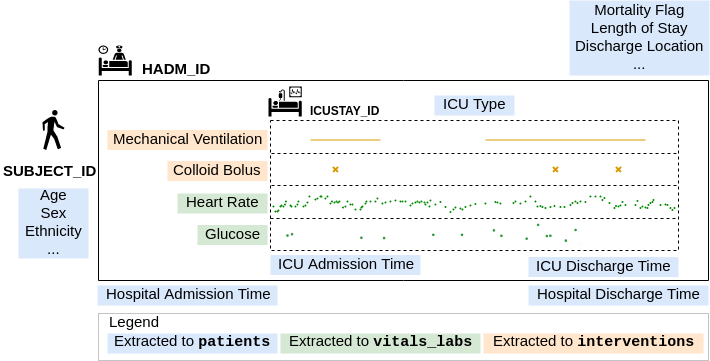
In this paper, we introduce MIMIC-Extract,111https://github.com/MLforHealth/MIMIC_Extract an open source pipeline to extract, preprocess, and represent data from MIMIC-III v1.4, including static demographic information available at admission, time-varying vital signs and laboratory measurements, time-varying intervention signals, and static outcomes such as length-of-stay or mortality. Figure 1 gives a visual summary of the data we extract from the observed records of an individual patient stay available in MIMIC-III. Our principled approach yields a comprehensive cohort of time-series data that is well-suited for several clinically-meaningful prediction tasks — several of which we profile in this paper — while simultaneously providing flexibility in cohort selection and variable selection.
We intend this pipeline to serve as a foundation for both benchmarking the state-of-the-art and enabling progress on new research tasks. Several other recent works have developed, in parallel, extraction pipelines and prediction benchmark tasks for MIMIC-III data (Harutyunyan et al., 2019; Purushotham et al., 2018; Sjoding et al., 2019). However, compared to these we advance the field with three primary contributions:
-
•
Robust Representations of Labs and Vitals Time Series. The primary difficulty of using the raw MIMIC-III data is the noisy nature of clincal data. We present a comprehensive procedure designed with clinical validity in mind to standardize units of measurement, detect and correct outliers, and select a curated set of features that reduce data missingness. Importantly, we offer data representations that are resilient to concept drift over time, by aggregating semantically similar raw features. The robustness of this “clinically aggregated” representation is demonstrated by recent work on feature robustness in non-stationary health records (Nestor et al., 2019).
i
-
•
Clinically Meaningful Interventions and Outcomes. Our pipeline focuses on making hourly-observed treatment signals available for several actionable critical care interventions, including ventilation, vasopressors (for blood pressure management), and fluid bolus therapies (for managing sepsis and other conditions). No other recent pipeline makes interventions a primary focus. We also support several common outcomes of interest, such as mortality and length of stay. We intentionally avoid tasks of questionable clinical utility appearing in some prior works, such as diagnosis billing code prediction, because they have poor diagnostic value (Agniel et al., 2018). In later benchmark task design, we further emphasize realistic settings such as predictions that occur every hour rather than after a single 24-hour duration. We are careful to include meaningful temporal gaps between measurement and outcome, in order to minimizes label leakage and thus improve the utility of models in real clinical deployment.
-
•
Focus on Usability, Reproducibility, and Extensibility. Finally, we have designed the entire pipeline with usability and extensibility in mind. Our patient selection criteria can be easily adjusted to support future research questions, requiring changes to only keyword arguments rather than source code. Extracted data can be read directly into a Pandas DataFrame (McKinney et al., 2010) with appropriate data typing, enabling immediate computational analysis. We also provide Jupyter Notebooks (Pérez and Granger, 2007) that demonstrate the use of the data produced by our MIMIC-Extract pipeline in benchmark prediction tasks, including steps for data loading and preprocessing, and baseline model building.
We emphasize that our pipeline has been used as the foundation for reproducing many recent machine learning studies of MIMIC-III data (Ghassemi et al., 2014, 2015, 2016, 2017; Suresh et al., 2017; Raghu et al., 2017; McDermott et al., 2018; Nestor et al., 2019). While none of these released their own extraction code, they nevertheless utilized similar cohort selection and variable selection processes.
The rest of this paper provides an overview of the extraction system design, a detailed comparison to other extraction systems and their corresponding benchmark tasks, and a careful analysis of several benchmark prediction tasks developed using our pipeline to showcase its potential.
Data Pipeline Overview
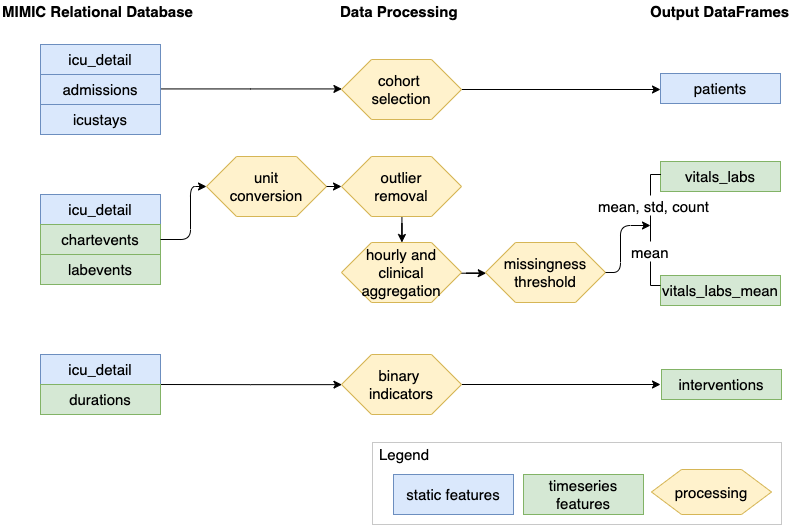
Figure 2 summarizes the data extraction and processing steps involved in MIMIC-Extract. From the MIMIC relational database, SQL query results are processed to generate four output tables. These tables, as summarized in Table 1, maintain the time series nature of clinical data and also provide an aggregated featurization of the cohort selected.
| Table Name | Index | Variables |
|---|---|---|
| patients | subject_id, hadm_id, icustay_id | static demographics, static outcomes |
| vitals_labs | subject_id, hadm_id, icustay_id, hours_in | time-varying vitals and labs (hourly mean, count and standard deviation) |
| vitals_labs_mean | subject_id, hadm_id, icustay_id, hours_in | time-varying vitals and labs (hourly mean only) |
| interventions | subject_id, hadm_id, icustay_id, hours_in | hourly binary indicators for administered interventions |
Cohort Selection
The MIMIC-III database captures over a decade of intensive care unit (ICU) patient stays at Beth Israel Deaconess Medical Center. An individual patient might be admitted to the ICU at multiple times over the years, and even within a single hospital stay could be moved in and out of the ICU multiple times. We choose to focus on each subject’s first ICU visit only, since those who make repeat visits typically require additional considerations with respect to modeling and providing useful treatment. Our proposed pipeline thus includes all patient ICU stays in the MIMIC-III database that meet the following criteria: the subject is an adult (age of at least 15 at time of admission), the stay is the first known ICU admission for the subject, and the total duration of the stay is at least 12 hours and less than 10 days. This cohort selection is consistent with many previous papers using MIMIC-III (Ghassemi et al., 2014, 2015, 2016, 2017; Suresh et al., 2017; Raghu et al., 2017; McDermott et al., 2018).
Variable Selection
Static Variables
By default, our extraction code extracts all 10 static demographic variables listed in Table 2, along with static outcomes including in-ICU mortality, in-hospital mortality, and the patient’s total ICU length-of-stay (LOS), in hours. Our pipeline presents values for static variables as they originally appear in MIMIC-III raw data with no additional outlier removal. For example, age for patients older than eighty-nine is masked as 300 in MIMIC-III for privacy reasons, and our pipeline preserves this sentinel value to allow downstream handling of these subjects.
| Variable | Concept |
|---|---|
| age | patient age (masked as 300 for patients |
| older than 89 years old in MIMIC-III) | |
| ethnicity | patient ethnicity |
| gender | patient gender |
| insurance | patient insurance type |
| admittime | hospital admission time |
| dischtime | hospital discharge time |
| intime | ICU admission time |
| outtime | ICU discharge time |
| admission_type | type of hospital admission |
| first_careunit | type of ICU when first admitted |
Time-Varying Vitals and Labs
By default, our extraction code extracts 104 clinically aggregated time-series variables (listed in Appendix A) related to vital signs (e.g., heart rate or blood pressure) and laboratory test results (e.g., white blood cell counts). These were selected as a comprehensive set of possible signals for prediction algorithms with input from clinical care teams. Practitioners can optionally choose to output only a subset of these variables that meet certain minimum percentages of non-missingness, as explained in later sections.
When comparing our selected features to previous work, we find that we include all 12 time-varying features in the small curated set of 17 features considered by Purushotham et al. (2018) (the other 5 include two static features we use, age and admission type, and three diagnosis code features we intentionally omit). We include 13 of the 17 time-varying vitals and labs featured in Harutyunyan et al. (2019)’s recent pipeline (we omit capillary refill rate due to high missingness rates as do all the feature sets surveyed by Purushotham et al. (2018); we further do not consider the separate eye, motor and verbal Glascow coma scores, only the total score). Importantly, unlike the large set of 136 “raw” features advocated by Purushotham et al. (2018), we do not include any prescription drugs such as aspirin — this is an intentional omission, because of the unclear quality of the prescription signals in the MIMIC-III database. Without additional insight into the prescriptions a patient actually took, which may differ from all prescriptions ordered for a patient, we feel the inclusion of prescriptions can induce significant confounding effects on the resulting models.
Unit Conversion and Outlier Detection
Sometimes vitals and labs are recorded with different measuring units in EHR data. Our data pipeline standardizes measurements into consistent units, including weight into kilograms, height into centimeters, and temperature into degrees Celsius. This process is easily extensible if any additional unit-classes are added by downstream users which need conversion.
To handle outliers, we make use of a list of clinically reasonable variable ranges provided in the source code repository of Harutyunyan et al. (2019),222https://github.com/YerevaNN/mimic3-benchmarks/blob/master/mimic3benchmark/resources/variable_ranges.csv. Accessed 2019-03-29. which was developed in conversation with clinical experts, based on their knowledge of valid clinical measure ranges. Each numerical variable is associated with upper and lower thresholds for detecting unusable outliers. If the raw observed value falls outside these thresholds, it is treated as missing. Additionally, each variable is associated with more refined upper and lower thresholds for defining the physiologically valid range of measurements. Any non-outlier value that falls outside the physiologically valid range is replaced with the nearest valid value. In generating the default cohort, we replace 35,251 (0.05%) measurements classified as non-valid outliers with nearest valid values and remove 5,402 (0.008%) measurements classified as extreme outliers. Appendix A lists the proportion of outliers detected at an aggregated feature level.
At the time of writing, this standardized process of outlier detection and removal is unique to our benchmarking system. In contrast, the public pipeline of Harutyunyan et al. (2019) does not perform any outlier detection and replacement333Note in README: “**Outlier detection is disabled in the current version**” https://github.com/YerevaNN/mimic3-benchmarks/commit/2da632f0d#diff-04c6e90faac2675aa89e2176d2eec7d8. Similarly, the pipeline of Purushotham et al. (2018) does not use outlier removal for its recommended set of 136 raw features, while for their comparison small set of 17 features involved in the SAPS score (including 5 non-time-varying ones) they do remove outliers “according to medical knowledge” but provide few reproducible details. We emphasize that updating the outlier handling of either pipeline would be a labor-intensive change (requiring editing source code).
Hourly Aggregation
The raw data in MIMIC-III provides fine-grained timestamps (with resolution in units of seconds or finer) for each laboratory measurement and recorded vital sign. However, most measurements are infrequent (e.g. blood tests of interest may be run every few hours at most), meaning each variable’s raw time-series is quite sparse. To obtain a denser representation that is easier to reason about and readily applied to modern machine learning methods for time-series that expect discretized time representations, we aggregate the observations from each ICU stay’s time-series into hourly buckets.
Semantic Grouping of Raw Features into Clinical Aggregates
Each measurements in the MIMIC-III database is associated with a unique ItemID, as specified by the original EHR software. These raw ItemIDs are not robust to changes in software or human data entry practices. For example, “HeartRate” may be recorded under ItemID 211 (using CareVue EHR systems before 2008) or under ItemID 220045 (using MetaVision EHR software after 2008). We thus developed a manually curated clinical taxonomy designed to group semantically equivalent ItemIDs together into more robust “clinical aggregate” features. These aggregate representations reduce overall data missingness and the presence of duplicate measures. Appendix A details the proposed clinical taxonomy about the MIMIC-Extract featurization. Parallel work by Nestor et al. (2019) shows that aggregating via this kind of clinical taxonomy yields significant benefits to the robustness of downstream models with respect to clinical concept drift over time. Our proposed software pipeline makes this useful taxonomy accessible to researchers and enables reproducibility.
Time-Varying Treatment Labels
Our code extracts hourly binary indicators of when (if ever) common treatments were provided to each patient over time. We include device treatments such as mechanical ventilation, as well as drug treatments such as vasopressors and fluid boluses.
We target these interventions because they are commonly used in the ICU (Yang and Tobin, 1991; Müllner et al., 2004) and, despite medical necessity, they can present notable harms to patients (Tobin, 2006; D’Aragon et al., 2015). We include fluid boluses of two types as interventions, crystalloid and colloid, but do not predict them because they are often considered less aggressive alternatives to vasopressors (Malbrain et al., 2014). The output stores binary indicators of whether an intervention was applied (1) or not applied (0) within a given hour; any missing data is considered a non-treatment (0).
Note that we extract both individual vasopressors (e.g., adenosine, dopamine, norepinephrine, vasopressin, etc.) and overall vasopressor usage, consistent with the MIMIC-III codebase (Johnson et al., 2017b). A comprehensive list of extracted interventions is provided in Table 3.
| Intervention | Concept | Mean Hours |
|---|---|---|
| vent | mechanical ventilation | 12.20 |
| vaso | vasopressor | 8.10 |
| adenosine | adenosine | 0.00 |
| dobutamine | dobutamine | 0.36 |
| dopamine | dopamine | 0.95 |
| epinephrine | epinephrine | 0.60 |
| isuprel | isuprel | 0.01 |
| milrinone | milrinone | 0.87 |
| norepinephrine | norepinephrine | 2.72 |
| phenylephrine | phenylephrine | 4.06 |
| vasopressin | vasopressin | 0.90 |
| colloid_bolus | colloid bolus | 0.16 |
| crystalloid_bolus | crystalloid bolus | 1.93 |
| nivdurations | non-invasive ventilation | 25.81 |
Extensibility of Data Pipeline
While MIMIC-Extract promotes reproducibility by providing a default cohort for common benchmark tasks, it is also able to to extract data tailored to specific research questions. In this section, we demonstrate four possible modifications and extensions of this pipeline to enable customized extraction.
Keywords
Functions in MIMIC-Extract use keywords to control admission cohort and time-varying features selection. Overwriting default values for the following keywords allows researchers to modify default extraction:
- min_age:
-
specifies a floor on patients’ age to be included in the cohort,
- min_duration & max_duration:
-
specify restrictions on ICU length of stay,
- group_by_level2:
-
specifies whether the ‘raw’ or ‘clinically aggregated’ labs and vitals should be extracted, and
- min_percent:
-
excludes vital and lab variables that contain high proportions of missing values.
Configurable Resource Files
The extraction code relies on information in associated resource files for variable grouping and extraction (itemid_to_variable_map.csv) and outlier correction (variable_ranges.csv). By modifying these files, researchers can extract sets of variables that are best suited for specific studies and adjust custom outlier detection thresholds for their task.
Embedded SQL Queries
Researchers can modify the code or add SQL queries in the extraction code to include additional static variables, vitals and labs measurements and treatment labels in the output tables. For example, acuity score can be queried and added to the patients table, and treatment fluid amount can be extracted to the interventions table by querying respective tables in the MIMIC relational database. We plan to maintain and update this codebase regularly to reflect additional research needs and improve the extensibility and ease of adding new SQL queries.
Additional Dataframes
By using a consistent cohort for all output dataframes, MIMIC-Extract reduces the workload on subsequent data processing in downstream tasks. While it currently extracts static variables, vital signs, lab measurements, and treatment interventions, MIMIC-III contains more clinical information such as prescriptions or diagnostic codes. Researchers can extend the pipeline to output additional groups of variables. This pipeline can also be extended to extracting unstructured data such as caregiver notes to enable multi-modal learning.
Comparison to Other Extraction Systems
| MIMIC-Extract | Harutyunyan et al. (2019) | Purushotham et al. (2018) | Sjoding et al. (2019) | ||
| Prediction Target | Mortality | Y | Y | Y | Y |
| Length-of-Stay (LOS) | Y | Y | Y | ||
| Phenotyping (ICD code) | Y | Y | |||
| Physiological Shock | Y | ||||
| Acute Respiratory Failure (ARF) | Y | ||||
| Ventilator intervention | Y | ||||
| Vasopressor intervention | Y | ||||
| Fluid Bolus intervention | Y | ||||
| Prediction Framework | Fixed Input, Fixed Target | Y | Y | Y | Y |
| Dynamic Input, Dynamic Target | Y | Y | |||
| Cohort | Generic | Y | |||
| Task-Specific | Y | Y | Y | ||
| Time-Varying Feature Representation | Raw Features | 269 | n/a | 136 | ? |
| Clinical Aggregate Features | 104 | 17 | 12 | ? | |
| Unit Conversion | Y | Y | not for raw | ? | |
| Outlier Detection | Y | disabled | not for raw | ? | |
| Missingness Thresholding | Y | Y | Y | Y | |
| Output | Format | .h5 | .csv | .npy | .npz |
| Presentation | Cohort | Patient | Cohort | Cohort |
A particular reproducibility challenge that the machine learning for health community faces is the lack of standardized data preprocessing and cohort specification (McDermott et al., 2019). We focus here on the three most similar efforts to ours in addressing this challenge with MIMIC-III: the benchmarks released recently by Harutyunyan et al. (2019), Purushotham et al. (2018), and Sjoding et al. (2019). While all these efforts have released public code that transforms MIMIC-III into feature and label sets suitable for supervised machine learning prediction tasks that take multivariate time-series input, they differ from our work in several important dimensions, including the following:
-
•
Prediction Target: Which variables (e.g. mortality, LOS) the task intends to predict.
-
•
Prediction Framework: What format input and output data take in the prediction task (see Figure 3).
-
•
Patient Cohort: Whether the output cohort is generic or task-specific.
-
•
Time-varying Feature Representation: What feature representation is chosen for the time-varying variables and what feature transformation is applied.
-
•
Output: The format used for output storage and presentation.
All works also differ with regard to which patient-specific features are exported and used in prediction, though we do not consider these differences in detail here. Table 4 summarizes the comparison of MIMIC-Extract to these works444While the comparisons to Harutyunyan et al. (2019) and Purushotham et al. (2018) are based on full journal papers, the comparison to Sjoding et al. (2019) is based on a one-page abstract due to publication availability at the time of writing.. As demonstrated in the comparison, MIMIC-Extract is the only pipeline that generates a generic cohort that can be directly read as Pandas DataFrame. It is also the only pipeline that uses clinical aggregation, unit conversion, and outlier detection on a large set of raw MIMIC-III data.
Prediction Targets
Mortality and length-of-stay (LOS) are very common targets in relevant benchmark works and are also included in this work. In addition, MIMIC-Extract is the only work demonstrating an intervention prediction task through predicting the onset, offset, stay on, and stay off of mechanical ventilation and vasopressors. This task requires the model to handle the decisions needed in a real ICU where subjects may go on and off treatments throughout their stay using most recently observed data.
While we do not demonstrate phenotype classification, ICD-9 group classification or acute respiratory failure (ARF) and shock predictions in this work, these prediction targets can be derived either using default MIMIC-Extract output or with slight extensions to the pipeline.
Prediction Framework
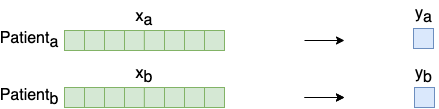
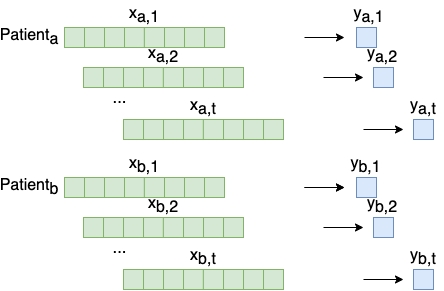
A typical clinical prediction task usually uses one of the two prediction frameworks illustrated in Figure 3:
-
•
Fixed Input, Fixed Target: A fixed period window of observations is taken from each patient (e.g. the first 24 hours of ICU) and a single target with a fixed temporal relationship to the chosen input window is predicted (e.g. in-hospital mortality or mortality within 30 days).
-
•
Dynamic Input, Dynamic Target: Multiple (potentially overlapping) subsequences are taken from each patient (e.g. the most recent 6 hours). Each input subsequence is used to predict a target variable at a known temporal delay (e.g. remaining LOS, mechanical ventilation onset one hour later). We will consider subsequences of fixed-length in all dynamic benchmarks here (e.g. 6 hour windows), but these could be variable-length in general.
In this work, we profile MIMIC-Extract for both “Fixed Input, Fixed Target" and “Dynamic Input, Dynamic Target" frameworks. In particular, we employ three classification tasks: binary mortality prediction (both in-hospital and in-ICU, given the first 24-hour window of patient history), binary long length-of-stay (LOS) prediction (both greater than three and seven days, given the same 24-hour window), and 4-class hourly intervention onset/offset prediction (for both mechanical ventilation and vasopressor administration).
The only other pipeline work that also handles “Dynamic Input, Dynamic Target" prediction is by Harutyunyan et al. (2019) where they predict hourly next-day mortality, which they call decompensation, and hourly remaining LOS. (Note that they use variable-length subsequences in both tasks, including at each hour information from all previous hours). However, since they generated task-specific cohorts, it is a more involved process to modify their source code to extract a different dynamic target.
In addition, to the best of our knowledge Harutyunyan et al.’s work does not employ greater-than-zero gap times when structuring in-hospital mortality prediction, risking temporal leakage of label information when training models. For example, with fixed 48-hour input windows, suppose a patient died at hour 48.5. It is likely that some signals of imminent decline (e.g. last-minute aggressive treatments) would be present before hour 48 and thus included as input, leading the predictor to identify what the care team obviously already knows about the patient’s poor health. This is a limitation of these tasks; in this work, all tasks presented use a non-zero temporal gap to ensure no such label leakage.
Cohort
Our system exports a single cohort, which can be used in a variety of ways under different paradigms for various tasks. In other words, MIMIC-Extract’s raw output does not specify the prediction input features or targets and do not impose task-specific inclusion criteria. All other three works establish either task-specific inclusion criteria or task-specific cohorts with different input features. As a result of producing a generic cohort, MIMIC-Extract is more extensible and easily adapted to different prediction tasks. The absence of task-specific inclusion criteria can also lead to more robust models. Lastly, by focusing more on the general data pipeline workflow rather than task specifics, MIMIC-Extract presents a framework that can be used by machine learning researchers using other clinical datasets.
Time-varying Feature Representation
Our system exports two possible featurizations: “raw” features which match the input representation schema of MIMIC (at the ItemID level), and “clinical aggregate” features, where outputs are grouped together according to a manual taxonomy based on clinical knowledge (see Appendix A). This representation induces a robustness to underlying temporal concept drift in the representation space (Nestor et al., 2019). Note that even though both Harutyunyan et al. (2019) and Purushotham et al. (2018) used ‘processed’ feature sets that involves clinical aggregation, unit conversion and outlier detection, they only considered a limited set of features for such transformation. MIMIC-Extract uses these processing techniques to a more comprehensive set of labs and vitals listed in Appendix A.
Output
Other than Harutyunyan et al. (2019), all pipelines generate cohort-level DataFrames or arrays that are easier for data exploration and visualization. MIMIC-Extract’s output can be read directly into a Pandas DataFrame that offers greater readability and easier querying.
Output Cohort Characterization
Our pipeline produces a cohort of 34,472 patients by default with diverse demographic and admission coverage, as summarized in Table 5. Alternative definitions of desired cohort properties (minimum age, etc.) can yield different cohorts. More details about the distribution of various features over this cohort can also be found in Appendix A, which details, among other things, the relative rates of missingness for both the individual raw ItemIDs and the grouped clinical aggregates over this cohort.
| Gender | Total | |||
| F | M | |||
| Ethnicity | Asian | 370 | 472 | 842 (2%) |
| Hispanic | 448 | 689 | 1,137 (3%) | |
| Black | 1,448 | 1,219 | 2,667 (8%) | |
| Other | 2,061 | 3,122 | 5,183 (15%) | |
| White | 10,651 | 13,992 | 24,643 (71%) | |
| Age | <30 | 748 | 1,084 | 1,832 (5%) |
| 31-50 | 2,212 | 3,277 | 5,489 (16%) | |
| 51-70 | 4,888 | 8,054 | 12,942 (38%) | |
| >70 | 7,130 | 7,079 | 14,209 (41%) | |
| Insurance Type | Self Pay | 125 | 352 | 477 (1%) |
| Government | 402 | 648 | 1,050 (3%) | |
| Medicaid | 1,186 | 1,596 | 2,782 (8%) | |
| Private | 4,415 | 7,431 | 11,846 (34%) | |
| Medicare | 8,850 | 9,467 | 18,317 (53%) | |
| Admission Type | Urgent | 409 | 528 | 937 (3%) |
| Elective | 2,282 | 3,423 | 5,705 (17%) | |
| Emergency | 12,287 | 15,543 | 27,830 (81%) | |
| First Careunit | TSICU | 1,777 | 2,725 | 4,502 (13%) |
| CCU | 2,185 | 3,008 | 5,193 (15%) | |
| SICU | 2,678 | 2,842 | 5,520 (16%) | |
| CSRU | 2,326 | 4,724 | 7,050 (20%) | |
| MICU | 6,012 | 6,195 | 12,207 (35%) | |
| Total | 14,978 (43%) | 19,494 (57%) | 34,472 (100%) | |
Benchmark Tasks and Models
In this section, we profile several benchmark tasks, ranging in complexity, across several types of models using data extracted with MIMIC-Extract, in an effort to both provide meaningful benchmarks and baseline results for the community, as well as to demonstrate the utility of this extraction system. Code to run these benchmarks is available in the form of accompanying Jupyter Notebooks.
We specifically endeavor to highlight tasks of varying complexity, each with a broad clinical intervention surface. Accordingly, we categorize our benchmarks as two low complexity tasks and one high complexity task. Our low complexity tasks are both static, binary classification tasks, each broken into two variants: mortality prediction (either in-hospital or in-ICU) and long length-of-stay (LOS) prediction (either day or day). Our high complexity task is the hourly prediction of the onset, offset, stay on and stay off of various interventions, as performed in, e.g., Suresh et al. (2017).
Notably, we do not include any tasks based on billing code prediction; while such tasks were included as benchmarks by Harutyunyan et al. (2019), and are commonly used as a target (Lipton et al., 2016; Choi et al., 2016; Choi et al., 2018), we argue that predicting diagnosis code is of minimal value clinically, given the lack of temporal association linking a diagnosis to a particular point in the record, and the fact that such codes are more associated with the billing of a patient than the treatment of said patients (Agniel et al., 2018).
We use a non-zero time gap between the most recent feature measurement time and a relevant forecasted event in all tasks. A gap is needed to allow practitioners time to respond to a predicted risk; suddenly warning that a patient is in instant critical need is not viable in medical practice. Additionally, time is needed to assemble care teams or fetch necessary drugs or equipment.
Mortality and Length-of-stay (LOS) Predictions
Risk prediction tasks like mortality and long LOS predictions are highlighted as benchmark tasks in both Purushotham et al. (2018) and Harutyunyan et al. (2019). Though common, they are known to be relatively easy prediction tasks, with performance saturating given only minimal data and even under relatively modest models, such as random forests (Che et al., 2018; Nestor et al., 2019)
Task Definitions
We consider several varieties of these tasks, including in-ICU mortality, in-hospital mortality, LOS days prediction, and LOS days prediction. For all tasks, we use clinically grouped time-varying labs and vitals features alone to predict these targets as binary classification task. In all cases, we use the first 24 hours of a patient’s data, only considering patients with at least 30 hours of present data. This 6 hour gap time is critical to prevent temporal label leakage, and must be included in any valid benchmark.
Data Pre-processing
Values were mean centered and scaled to unit variance, then missing data was imputed using a variant of the “Simple Imputation” scheme outlined in Che et al. (2018), in which we represent each variable via a mask (1 if the value is present at this timestep, 0 otherwise), the imputed variable, and the time since the last observation of this feature (with values which have never been observed being given a sentinel large value). In particular, variable values are first forward filled and then set to individual-specific mean if there are no previous values. If the variable is never observed for a patient, its value is set to training set global mean.
Models Benchmarked
For all tasks, we profiled logistic regression (LR), random forest (RF), and gated recurrent unit with delay (GRU-D) (Che et al., 2018) models. As the point of this work is not to make strong statements about the workings or efficacy of these models, but rather to introduce our extraction pipeline and demonstrate its use on benchmark tasks, we will not discuss the details of these models here, but refer the reader to external sources for more model details.
Models were tuned using random hyperparameter search (Bergstra and Bengio, 2012) under broad parameter distributions, with 60 hyperparameter samples for RF and LR models, and a variable number of samples for GRU-D (less than 60 in all cases) as GRU-D is significantly more computationally intensive. Note that this likely induces a small bias against GRU-D in these baseline results.
Results
Results for these models are shown in Table 6. Our AUROCs are very much in line with the literature for these tasks, showing robustly high performance for GRU-D and RF models, as expected. One interesting observation is that random forest models often have poor F1 scores, even while maintaining competitive AUPRC scores. This may indicate that these models are more sensitive to the initial choice of threshold than are other models. Similarly, GRU-D often displays stronger performance under the AUPRC metric than the AUROC metric relative to other models, which likely speaks in its favor here given the strong rates of class imbalance in these tasks.
| Task | Model | AUROC | AUPRC | Accuracy | F1 |
|---|---|---|---|---|---|
| In-ICU Mortality | LR | ||||
| RF | |||||
| GRU-D | |||||
| In-Hospital Mortality | LR | ||||
| RF | |||||
| GRU-D | |||||
| LOS 3 Days | LR | ||||
| RF | |||||
| GRU-D | |||||
| LOS 7 Days | LR | ||||
| RF | |||||
| GRU-D |
Clinical Intervention Prediction
We also use MIMIC-Extract for intervention prediction tasks. Well-executed intervention prediction can alert caregivers about administrating effective treatments while avoiding unnecessary harms and costs (Ghassemi et al., 2016, 2017). In a high-paced ICU, such decision-support systems could be a fail-safe against catastrophic errors. We argue that tasks like intervention prediction have a stronger time-series focus and are clinically actionable. Following prior work on clinical intervention prediction (Suresh et al., 2017; Ghassemi et al., 2017, 2016), we present models for predicting two target interventions, mechanical ventilation and vasopressors.
Task Definitions
To make clinically meaningful predictions, we extract from MIMIC-Extract clinically aggregated outputs a sliding window of size 6 hours as input features, then predict intervention onset/offset within a 4 hour prediction window offset from the input window by a 6 hour gap window. For each intervention at each prediction window, there are 4 possible outcomes:
- Onset:
-
When the intervention begins off and is turned on.
- Stay On:
-
When the intervention begins on and stays on.
- Wean:
-
When the intervention begins on and is stopped.
- Stay Off:
-
When the intervention begins off and stays off.
Data Pre-processing
Time-varying lab and vital data are preprocessed in a manner similar to that used in the mortality and LOS prediction, except that the “time since last measure” column is also centered and rescaled as this is found to improve performance for our neural models. We also include 5 static variables (gender, age bucket, ethnicity, ICU type, and admission type) and time-of-day as additional features.
Models Benchmarked
We profile LR, RF, convolutional neural network (CNN) models, and Long Short-Term Memory (LSTM) models for this task. Hyperparameters for RF and LR models were tuned via random search, whereas for CNN and LSTM models, parameters were replicated from prior work by Suresh et al. (2017).
Results
Model performance is summarized in Table 7.
| RF | LR | CNN | LSTM | |||||
|---|---|---|---|---|---|---|---|---|
| Vent. | Vaso. | Vent. | Vaso. | Vent. | Vaso. | Vent. | Vaso. | |
| Onset AUROC | 87.1 | 71.6 | 71.9 | 68.4 | 72.2 | 69.4 | 70.1 | 71.9 |
| Wean AUROC | 94.0 | 94.2 | 93.2 | 93.9 | 93.9 | 94.0 | 93.1 | 93.9 |
| Stay On AUROC | 98.5 | 98.5 | 98.4 | 98.2 | 98.6 | 98.4 | 98.3 | 98.3 |
| Stay Off AUROC | 99.0 | 98.3 | 98.3 | 98.5 | 98.4 | 98.1 | 98.4 | 98.1 |
| Macro AUROC | 94.6 | 90.7 | 90.4 | 89.8 | 90.8 | 90.0 | 90.0 | 90.1 |
| Accuracy | 79.7 | 83.8 | 78.5 | 72.9 | 61.8 | 77.6 | 84.3 | 82.6 |
| Macro F1 | 48.1 | 48.9 | 47.7 | 45.1 | 44.4 | 44.4 | 50.1 | 48.1 |
| Macro AUPRC | 42.7 | 42.0 | 43.1 | 40.2 | 42.4 | 38.9 | 44.4 | 41.7 |
We find that CNN and LSTM models perform very similarly to prior studies—this is notable given we do not include notes, whereas many prior studies do (Suresh et al., 2017). RF models perform surprisingly well, outperforming CNN and LSTM models and prior results reported in the literature.
Design Choices and Limitations
While MIMIC-Extract aims to be flexible in supporting a wide range of machine learning projects using MIMIC-III, we make several design choices that may render MIMIC-Extract less relevant to tasks that differ significantly from the benchmark tasks presented in this paper.
Most notable among these designed choices are the features we exclude. Notable such categories include prescriptions, certain labs and vitals, various treatments/interventions, and notes. Many of these features can be externally extracted and joined to our pipeline’s output (as we demonstrate in ‘Extensibility of Data Pipeline’ Section for notes), and others we exclude intentionally due to concerns about their robustness (prescriptions), but other parties may wish to extend the pipeline to enable extraction of these features.
In addition, our time-series coarsening into hourly buckets can also be limiting for certain tasks. By bucketing data into hourly aggregates, we lose out on a level of granularity present in the raw data and force the irregular medical timeseries into a artificially regular representation. We also lose all granularity with regards to time-of-day, which has known effects on care delivery (Agniel et al., 2018). Similarly, our clinical groupings, while highly performant, are also manually curated and limit the extensibility of the pipeline to new labs and vitals.
Conclusion
MIMIC-Extract is an open source cohort selection and pre-processing pipeline for obtaining multivariate time-series for clinical prediction tasks. The system produces a single, large cohort and represents time-varying data according to manually-defined, clinically meaningful groupings. This representation shows strong performance and robustness to care practice drift. We demonstrate that this pipeline can be used in a diverse range of clinical prediction tasks. We hope its focus on usability, reproducibility, and extensibility will help spur development of machine learning methodology via clinically relevant and reproducible benchmark tasks. Ultimately, we hope MIMIC-Extract will enable easier and faster development of effective machine learning models that might drive improvements in delivering critical care.
Code availability
The full MIMIC-EXTRACT pipeline code, including SQL queries and configurable resource files, as well as Jupyter Notebooks walking through benchmark tasks and models are available at https://github.com/MLforHealth/MIMIC_Extract.
Acknowledgments
Matthew McDermott is funded in part by National Institutes of Health: National Institutes of Mental Health grant P50-MH106933 as well as a Mitacs Globalink Research Award. Geeticka Chauhan acknowledges the support of the Wistron Corporation in Taiwan. Dr. Marzyeh Ghassemi is funded in part by Microsoft Research, a CIFAR AI Chair at the Vector Institute, a Canada Research Council Chair, and an NSERC Discovery Grant. Dr. Michael C. Hughes acknowledges support in part from NSF Projects HDR-1934553 and IIS-1908617.
References
- (1)
- Agniel et al. (2018) Denis Agniel, Isaac S Kohane, and Griffin M Weber. 2018. Biases in electronic health record data due to processes within the healthcare system: retrospective observational study. bmj 361 (2018), k1479.
- Bergstra and Bengio (2012) James Bergstra and Yoshua Bengio. 2012. Random search for hyper-parameter optimization. Journal of Machine Learning Research 13, Feb (2012), 281–305.
- Che et al. (2018) Zhengping Che, Sanjay Purushotham, Kyunghyun Cho, David Sontag, and Yan Liu. 2018. Recurrent Neural Networks for Multivariate Time Series with Missing Values. Scientific Reports 8, 1 (2018).
- Choi et al. (2016) Edward Choi, Mohammad Taha Bahadori, Jimeng Sun, Joshua Kulas, Andy Schuetz, and Walter Stewart. 2016. RETAIN: An Interpretable Predictive Model for Healthcare using Reverse Time Attention Mechanism. In Advances in Neural Information Processing Systems. 3504–3512.
- Choi et al. (2018) Edward Choi, Cao Xiao, Walter Stewart, and Jimeng Sun. 2018. MiME: Multilevel Medical Embedding of Electronic Health Records for Predictive Healthcare. In Advances in Neural Information Processing Systems. 4552–4562.
- D’Aragon et al. (2015) Frederick D’Aragon, Emilie P Belley-Cote, Maureen O Meade, François Lauzier, Neill KJ Adhikari, Matthias Briel, Manoj Lalu, Salmaan Kanji, Pierre Asfar, Alexis F Turgeon, et al. 2015. Blood Pressure Targets For Vasopressor Therapy: A Systematic Review. Shock 43, 6 (2015), 530–539.
- Ghassemi et al. (2014) Marzyeh Ghassemi, Tristan Naumann, Finale Doshi-Velez, N. Brimmer, Rohit Joshi, Anna Rumshisky, and Peter Szolovits. 2014. Unfolding physiological state: Mortality modelling in intensive care units. In International Conference on Knowledge Discovery and Data Mining (KDD). ACM, 75–84.
- Ghassemi et al. (2018) Marzyeh Ghassemi, Tristan Naumann, Peter Schulam, Andrew L Beam, and Rajesh Ranganath. 2018. Opportunities in Machine Learning for Healthcare. arXiv preprint arXiv:1806.00388 (2018).
- Ghassemi et al. (2015) Marzyeh Ghassemi, Marco AF Pimentel, Tristan Naumann, Thomas Brennan, David A Clifton, Peter Szolovits, and Mengling Feng. 2015. A multivariate timeseries modeling approach to severity of illness assessment and forecasting in icu with sparse, heterogeneous clinical data. In Twenty-Ninth AAAI Conference on Artificial Intelligence.
- Ghassemi et al. (2016) Marzyeh Ghassemi, M. Wu, M. Feng, L.A. Celi, P. Szolovits, and F. Doshi-Velez. 2016. Understanding vasopressor intervention and weaning: Risk prediction in a public heterogeneous clinical time series database. Journal of the American Medical Informatics Association (2016), ocw138.
- Ghassemi et al. (2017) Marzyeh Ghassemi, Mike Wu, Michael Hughes, and Finale Doshi-Velez. 2017. Predicting Intervention Onset in the ICU with Switching State Space Models. In Proceedings of the AMIA Summit on Clinical Research Informatics (CRI), Vol. 2017. American Medical Informatics Association.
- Harutyunyan et al. (2019) Hrayr Harutyunyan, Hrant Khachatrian, David C Kale, and Aram Galstyan. 2019. Multitask learning and benchmarking with clinical time series data. Scientific Data (2019).
- Johnson et al. (2017a) Alistair EW Johnson, Tom J Pollard, and Roger G Mark. 2017a. Reproducibility in critical care: a mortality prediction case study. In Machine Learning for Healthcare Conference. 361–376.
- Johnson et al. (2016) Alistair EW Johnson, Tom J Pollard, Lu Shen, H Lehman Li-wei, Mengling Feng, Mohammad Ghassemi, Benjamin Moody, Peter Szolovits, Leo Anthony Celi, and Roger G Mark. 2016. MIMIC-III, a freely accessible critical care database. Scientific data 3 (2016), 160035.
- Johnson et al. (2017b) Alistair EW Johnson, David J Stone, Leo A Celi, and Tom J Pollard. 2017b. The MIMIC Code Repository: enabling reproducibility in critical care research. Journal of the American Medical Informatics Association 25, 1 (2017), 32–39.
- Lipton et al. (2016) Zachary C Lipton, David C Kale, Charles Elkan, and Randall Wetzel. 2016. Learning to diagnose with LSTM recurrent neural networks. In International Conference on Learning Representations.
- Malbrain et al. (2014) ML Malbrain, Paul E Marik, Ine Witters, Colin Cordemans, Andrew W Kirkpatrick, Derek J Roberts, and Niels Van Regenmortel. 2014. Fluid overload, de-resuscitation, and outcomes in critically ill or injured patients: a systematic review with suggestions for clinical practice. Anaesthesiol Intensive Ther 46, 5 (2014), 361–80.
- McDermott et al. (2018) M.B.A. McDermott, T. Yan, T. Naumann, N. Hunt, H. Suresh, P. Szolovits, and M. Ghassemi. 2018. Semi-supervised Biomedical Translation with Cycle Wasserstein Regression GANs. In Association for the Advancement of Artificial Intelligence. New Orleans, LA.
- McDermott et al. (2019) Matthew BA McDermott, Shirly Wang, Nikki Marinsek, Rajesh Ranganath, Marzyeh Ghassemi, and Luca Foschini. 2019. Reproducibility in Machine Learning for Health. In Submission. (2019).
- McKinney et al. (2010) Wes McKinney et al. 2010. Data structures for statistical computing in python. In Proceedings of the 9th Python in Science Conference, Vol. 445. Austin, TX, 51–56.
- Müllner et al. (2004) Marcus Müllner, Bernhard Urbanek, Christof Havel, Heidrun Losert, Gunnar Gamper, and Harald Herkner. 2004. Vasopressors for shock. The Cochrane Library (2004).
- Nestor et al. (2019) Bret Nestor, Matthew B. A. McDermott, Willie Boag, Gabriela Berner, Tristan Naumann, Michael C. Hughes, Anna Goldenberg, and Marzyeh Ghassemi. 2019. Feature Robustness in Non-stationary Health Records: Caveats to Deployable Model Performance in Common Clinical Machine Learning Tasks. In In Press: Machine Learning for Healthcare Conference (MLHC).
- Pérez and Granger (2007) Fernando Pérez and Brian E Granger. 2007. IPython: a system for interactive scientific computing. Computing in Science & Engineering 9, 3 (2007), 21–29.
- Purushotham et al. (2018) Sanjay Purushotham, Chuizheng Meng, Zhengping Che, and Yan Liu. 2018. Benchmarking deep learning models on large healthcare datasets. Journal of Biomedical Informatics 83 (2018). https://doi.org/10.1016/j.jbi.2018.04.007
- Raghu et al. (2017) A. Raghu, M. Komorowski, L.A. Celi, P. Szolovits, and M. Ghassemi. 2017. Continuous State-Space Models for Optimal Sepsis Treatment: a Deep Reinforcement Learning Approach. In Machine Learning for Healthcare Conference (MLHC). 147–163.
- Sjoding et al. (2019) Michael Sjoding, Shengpu Tang, Parmida Davarmanesh, Yanmeng Song, Danai Koutra, and Jenna Wiens. 2019. Democratizing EHR Analyses a Comprehensive Pipeline for Learning from Clinical Data. In Machine Learning For Healthcare (Clinical Abstracts Track).
- Suresh et al. (2017) Harini Suresh, Nathan Hunt, Alistair Johnson, Leo Anthony Celi, Peter Szolovits, and Marzyeh Ghassemi. 2017. Clinical Intervention Prediction and Understanding with Deep Neural Networks. In Proceedings of the 2nd Machine Learning for Healthcare Conference (Proceedings of Machine Learning Research), Vol. 68. PMLR, Boston, Massachusetts, 322–337.
- Tobin (2006) Martin J Tobin. 2006. Principles and practice of mechanical ventilation. McGraw-Hill Medical Pub. Division.
- Yang and Tobin (1991) Karl L Yang and Martin J Tobin. 1991. A prospective study of indexes predicting the outcome of trials of weaning from mechanical ventilation. New England Journal of Medicine 324 (1991).
Appendix A Feature Set
Columns “low”, “high”, and “strict” indicate the proportion of observations corrected under outlier detection. “NAN” indicates that there is no prescribed valid range for that variable. Columns “avg.”, “std.”, and “pres.” indicate the arithmetic mean, the standard deviation, and the percentage of present (non-missing) values for each variable. Columns “pres. cv” and “pres. mv” are the proportion of present (non-missing) values from patients whose data are recorded under Carevue and Metavision software systems, respectively.
| Grouping | low | high | strict | avg | std | pres. | pres. cv | pres. mv | ItemID | Table | DB | avg | std | pres. |
|---|---|---|---|---|---|---|---|---|---|---|---|---|---|---|
| alanine aminotransferase | 1.7E-04 | 1.9E-04 | 3.9E-04 | 282.3 | 916.4 | 2.0E-02 | 2.7E-02 | 1.5E-02 | 50861 | labevents | lab | 278.6 | 909.6 | 1.5E-02 |
| 769 | chartevents | cv | 335.1 | 984.9 | 6.7E-03 | |||||||||
| 220644 | chartevents | mv | 281.1 | 907.0 | 6.7E-03 | |||||||||
| albumin | 0.0E+00 | 1.9E-05 | 0.0E+00 | 3.1 | 0.7 | 1.3E-02 | 1.7E-02 | 1.1E-02 | 50862 | labevents | lab | 3.1 | 0.7 | 1.0E-02 |
| 772 | chartevents | cv | 2.9 | 0.6 | 4.9E-03 | |||||||||
| 1521 | chartevents | cv | 3.0 | 0.6 | 3.8E-03 | |||||||||
| 227456 | chartevents | mv | 3.1 | 0.7 | 4.1E-03 | |||||||||
| albumin ascites | NAN | NAN | NAN | 1.7 | 0.8 | 5.2E-05 | 5.8E-05 | 4.5E-05 | 50835 | labevents | lab | 1.7 | 0.8 | 5.2E-05 |
| albumin pleural | NAN | NAN | NAN | 1.7 | 0.6 | 6.6E-05 | 7.0E-05 | 6.6E-05 | 51046 | labevents | lab | 1.7 | 0.6 | 6.6E-05 |
| albumin urine | NAN | NAN | NAN | 46.0 | 93.1 | 6.0E-05 | 5.4E-05 | 6.1E-05 | 51069 | labevents | lab | 46.0 | 93.1 | 6.0E-05 |
| alkaline phosphate | 4.1E-04 | 1.6E-05 | 7.5E-05 | 122.3 | 143.6 | 1.9E-02 | 2.6E-02 | 1.5E-02 | 773 | chartevents | cv | 126.7 | 157.6 | 6.5E-03 |
| 225612 | chartevents | mv | 120.1 | 146.5 | 6.5E-03 | |||||||||
| 50863 | labevents | lab | 123.7 | 147.1 | 1.5E-02 | |||||||||
| anion gap | 1.7E-04 | 2.1E-05 | 1.4E-05 | 13.7 | 4.0 | 8.3E-02 | 1.1E-01 | 6.6E-02 | 50868 | labevents | lab | 13.8 | 4.0 | 6.5E-02 |
| 227073 | chartevents | mv | 13.3 | 3.8 | 2.9E-02 | |||||||||
| asparate aminotransferase | 2.1E-04 | 4.2E-05 | 4.7E-05 | 348.1 | 1239.6 | 2.0E-02 | 2.7E-02 | 1.5E-02 | 50878 | labevents | lab | 345.1 | 1236.4 | 1.5E-02 |
| 770 | chartevents | cv | 404.3 | 1299.0 | 6.7E-03 | |||||||||
| 220587 | chartevents | mv | 347.4 | 1239.9 | 6.7E-03 | |||||||||
| basophils | NAN | NAN | NAN | 0.4 | 0.5 | 8.4E-03 | 1.1E-02 | 7.0E-03 | 51146 | labevents | lab | 0.4 | 0.5 | 8.4E-03 |
| bicarbonate | 0.0E+00 | 0.0E+00 | 6.1E-06 | 24.2 | 4.7 | 8.8E-02 | 1.1E-01 | 7.0E-02 | 50882 | labevents | lab | 24.2 | 4.8 | 6.7E-02 |
| 227443 | chartevents | mv | 24.4 | 4.7 | 2.9E-02 | |||||||||
| 50803 | labevents | lab | 23.4 | 5.0 | 1.8E-03 | |||||||||
| bilirubin | 1.2E-03 | 4.1E-05 | 2.8E-05 | 2.6 | 5.2 | 2.0E-02 | 2.7E-02 | 1.5E-02 | 848 | chartevents | cv | 3.2 | 6.4 | 6.3E-03 |
| 50884 | labevents | lab | 1.7 | 2.3 | 1.2E-03 | |||||||||
| 225690 | chartevents | mv | 2.7 | 5.2 | 6.7E-03 | |||||||||
| 1538 | chartevents | cv | 3.3 | 6.4 | 5.0E-03 | |||||||||
| 50883 | labevents | lab | 3.2 | 4.8 | 1.3E-03 | |||||||||
| 225651 | chartevents | mv | 3.0 | 4.3 | 5.7E-04 | |||||||||
| 803 | chartevents | cv | 3.2 | 4.9 | 5.8E-04 | |||||||||
| 50885 | labevents | lab | 2.6 | 5.4 | 1.6E-02 | |||||||||
| blood urea nitrogen | 0.0E+00 | 2.1E-05 | 0.0E+00 | 26.2 | 21.8 | 8.8E-02 | 1.2E-01 | 7.1E-02 | 51006 | labevents | lab | 26.4 | 21.9 | 6.9E-02 |
| 781 | chartevents | cv | 26.6 | 22.1 | 3.5E-02 | |||||||||
| 1162 | chartevents | cv | 26.4 | 22.0 | 2.7E-02 | |||||||||
| 225624 | chartevents | mv | 25.9 | 21.4 | 3.0E-02 | |||||||||
| calcium | NAN | NAN | NAN | 8.3 | 1.9 | 7.0E-02 | 9.5E-02 | 5.4E-02 | 225625 | chartevents | mv | 8.3 | 2.9 | 2.5E-02 |
| 50893 | labevents | lab | 8.3 | 0.8 | 5.3E-02 | |||||||||
| 786 | chartevents | cv | 8.3 | 0.8 | 2.7E-02 | |||||||||
| 1522 | chartevents | cv | 8.3 | 0.8 | 2.2E-02 | |||||||||
| calcium ionized | NAN | NAN | NAN | 1.3 | 5.1 | 5.1E-02 | 5.3E-02 | 5.0E-02 | 50808 | labevents | lab | 1.1 | 0.6 | 4.2E-02 |
| 816 | chartevents | cv | 1.5 | 7.3 | 2.6E-02 | |||||||||
| 225667 | chartevents | mv | 1.1 | 0.9 | 1.5E-02 | |||||||||
| calcium urine | NAN | NAN | NAN | 5.4 | 8.9 | 9.2E-05 | 9.8E-05 | 8.6E-05 | 51077 | labevents | lab | 5.4 | 8.9 | 9.2E-05 |
| cardiac index | NAN | NAN | NAN | 2.9 | 0.8 | 3.5E-02 | 5.5E-03 | 6.0E-02 | 116 | chartevents | cv | 2.9 | 0.8 | 3.5E-02 |
| cardiac output fick | NAN | NAN | NAN | 5.7 | 2.0 | 7.3E-03 | 1.8E-03 | 1.2E-02 | 89 | chartevents | cv | 5.7 | 2.0 | 7.3E-03 |
| cardiac output thermodilution | NAN | NAN | NAN | 5.7 | 1.9 | 3.0E-02 | 4.2E-03 | 5.1E-02 | 90 | chartevents | cv | 5.7 | 1.9 | 3.0E-02 |
| central venous pressure | NAN | NAN | NAN | 11.6 | 16.1 | 2.0E-01 | 1.5E-01 | 2.3E-01 | 220074 | chartevents | mv | 13.7 | 27.8 | 6.0E-02 |
| 113 | chartevents | cv | 10.6 | 5.4 | 1.4E-01 | |||||||||
| chloride | 1.1E-05 | 1.7E-06 | 0.0E+00 | 105.2 | 6.3 | 9.6E-02 | 1.3E-01 | 7.4E-02 | 50806 | labevents | lab | 105.5 | 6.0 | 7.9E-03 |
| 220602 | chartevents | mv | 105.3 | 6.4 | 3.1E-02 | |||||||||
| 226536 | chartevents | mv | 106.2 | 5.9 | 2.9E-03 | |||||||||
| 1523 | chartevents | cv | 105.8 | 6.2 | 2.7E-02 | |||||||||
| 788 | chartevents | cv | 105.6 | 6.1 | 3.4E-02 | |||||||||
| 50902 | labevents | lab | 105.2 | 6.3 | 6.9E-02 | |||||||||
| chloride urine | NAN | NAN | NAN | 64.9 | 48.3 | 1.2E-03 | 2.0E-03 | 5.5E-04 | 51078 | labevents | lab | 64.9 | 48.3 | 1.2E-03 |
| cholesterol | 4.2E-04 | 9.4E-05 | 1.9E-04 | 161.9 | 51.3 | 1.8E-03 | 1.9E-03 | 1.7E-03 | 789 | chartevents | cv | 161.7 | 49.1 | 7.4E-04 |
| 1524 | chartevents | cv | 159.8 | 47.4 | 5.5E-04 | |||||||||
| 220603 | chartevents | mv | 160.1 | 52.0 | 4.9E-04 | |||||||||
| 50907 | labevents | lab | 162.2 | 50.8 | 1.5E-03 | |||||||||
| cholesterol hdl | NAN | NAN | NAN | 45.1 | 16.0 | 1.4E-03 | 1.2E-03 | 1.5E-03 | 50904 | labevents | lab | 45.1 | 16.0 | 1.4E-03 |
| cholesterol ldl | NAN | NAN | NAN | 90.3 | 39.5 | 1.3E-03 | 1.2E-03 | 1.5E-03 | 50905 | labevents | lab | 90.3 | 39.5 | 1.3E-03 |
| co2 | NAN | NAN | NAN | 24.1 | 4.8 | 3.4E-02 | 6.1E-03 | 5.8E-02 | 787 | chartevents | cv | 24.1 | 4.8 | 3.4E-02 |
| co2 (etco2, pco2, etc.) | NAN | NAN | NAN | 25.2 | 5.3 | 8.2E-02 | 8.5E-02 | 8.2E-02 | 857 | chartevents | cv | 25.8 | 8.2 | 4.6E-04 |
| 225698 | chartevents | mv | 25.2 | 5.2 | 2.4E-02 | |||||||||
| 777 | chartevents | cv | 25.2 | 5.3 | 4.2E-02 | |||||||||
| 50804 | labevents | lab | 25.2 | 5.3 | 6.9E-02 | |||||||||
| 223679 | chartevents | mv | 25.3 | 7.8 | 7.0E-04 | |||||||||
| creatinine | 1.4E-05 | 0.0E+00 | 8.5E-05 | 1.4 | 1.5 | 8.9E-02 | 1.2E-01 | 7.2E-02 | 791 | chartevents | cv | 1.4 | 1.5 | 3.5E-02 |
| 1525 | chartevents | cv | 1.4 | 1.5 | 2.7E-02 | |||||||||
| 220615 | chartevents | mv | 1.4 | 1.4 | 3.0E-02 | |||||||||
| 50912 | labevents | lab | 1.4 | 1.5 | 6.9E-02 | |||||||||
| creatinine ascites | NAN | NAN | NAN | 3.5 | 7.2 | 2.9E-05 | 2.7E-05 | 2.9E-05 | 50841 | labevents | lab | 3.5 | 7.2 | 2.9E-05 |
| creatinine body fluid | NAN | NAN | NAN | 7.8 | 14.0 | 1.8E-05 | 8.1E-06 | 2.5E-05 | 51032 | labevents | lab | 7.8 | 14.0 | 1.8E-05 |
| creatinine pleural | NAN | NAN | NAN | 1.8 | 4.3 | 1.9E-05 | 2.3E-05 | 1.7E-05 | 51052 | labevents | lab | 1.8 | 4.3 | 1.9E-05 |
| creatinine urine | NAN | NAN | NAN | 91.0 | 66.2 | 3.1E-03 | 3.5E-03 | 2.8E-03 | 51082 | labevents | lab | 91.0 | 66.2 | 3.1E-03 |
| diastolic blood pressure | 0.0E+00 | 0.0E+00 | 1.3E-05 | 60.9 | 14.1 | 8.7E-01 | 8.9E-01 | 8.6E-01 | 224643 | chartevents | mv | 66.0 | 16.2 | 1.6E-04 |
| 225310 | chartevents | mv | 59.3 | 14.4 | 1.1E-02 | |||||||||
| 220180 | chartevents | mv | 63.6 | 15.0 | 2.5E-01 | |||||||||
| 8555 | chartevents | cv | 57.4 | 12.6 | 2.7E-03 | |||||||||
| 220051 | chartevents | mv | 60.4 | 13.4 | 1.3E-01 | |||||||||
| 8368 | chartevents | cv | 60.2 | 13.5 | 2.5E-01 | |||||||||
| 8441 | chartevents | cv | 59.0 | 14.8 | 2.8E-01 | |||||||||
| 8440 | chartevents | cv | 62.1 | 14.5 | 4.5E-04 | |||||||||
| eosinophils | NAN | NAN | NAN | 3.4 | 6.0 | 1.8E-04 | 2.3E-04 | 1.4E-04 | 51444 | labevents | lab | 3.7 | 5.9 | 3.9E-05 |
| 51347 | labevents | lab | 2.4 | 3.3 | 3.7E-05 | |||||||||
| 51419 | labevents | lab | 3.9 | 6.9 | 7.3E-05 | |||||||||
| 51114 | labevents | lab | 3.0 | 7.2 | 3.0E-05 | |||||||||
| fibrinogen | NAN | NAN | NAN | 295.6 | 175.3 | 9.4E-03 | 1.2E-02 | 7.9E-03 | 227468 | chartevents | mv | 288.7 | 177.5 | 2.9E-03 |
| 1528 | chartevents | cv | 298.5 | 177.5 | 2.9E-03 | |||||||||
| 806 | chartevents | cv | 300.6 | 178.5 | 3.3E-03 | |||||||||
| 51214 | labevents | lab | 294.3 | 172.8 | 7.6E-03 | |||||||||
| fraction inspired oxygen | 4.6E-05 | 0.0E+00 | 2.1E-03 | 0.5 | 0.2 | 4.5E-02 | 9.6E-02 | 4.4E-03 | 189 | chartevents | cv | 0.6 | 0.2 | 1.7E-03 |
| 727 | chartevents | cv | 0.4 | 0.2 | 7.2E-05 | |||||||||
| 223835 | chartevents | mv | 0.5 | 0.2 | 4.3E-02 | |||||||||
| fraction inspired oxygen set | NAN | NAN | NAN | 0.5 | 0.2 | 6.5E-02 | 9.7E-03 | 1.1E-01 | 190 | chartevents | cv | 0.5 | 0.2 | 6.5E-02 |
| glascow coma scale total | NAN | NAN | NAN | 12.5 | 3.6 | 1.7E-01 | 2.7E-02 | 2.9E-01 | 198 | chartevents | cv | 12.5 | 3.6 | 1.7E-01 |
| glucose | 2.0E-04 | 0.0E+00 | 3.1E-06 | 140.5 | 57.2 | 2.3E-01 | 2.5E-01 | 2.2E-01 | 220621 | chartevents | mv | 136.2 | 61.5 | 2.9E-02 |
| 225664 | chartevents | mv | 150.2 | 60.7 | 4.6E-02 | |||||||||
| 50809 | labevents | lab | 138.4 | 53.3 | 3.5E-02 | |||||||||
| 811 | chartevents | cv | 135.8 | 53.8 | 6.8E-02 | |||||||||
| 807 | chartevents | cv | 144.5 | 57.8 | 6.2E-02 | |||||||||
| 50931 | labevents | lab | 137.9 | 65.6 | 6.5E-02 | |||||||||
| 226537 | chartevents | mv | 131.8 | 42.0 | 1.6E-02 | |||||||||
| 1529 | chartevents | cv | 132.8 | 52.1 | 5.1E-02 | |||||||||
| heart rate | 0.0E+00 | 0.0E+00 | 6.7E-07 | 85.0 | 17.3 | 9.0E-01 | 9.3E-01 | 8.8E-01 | 211 | chartevents | cv | 85.1 | 17.1 | 5.2E-01 |
| 220045 | chartevents | mv | 84.8 | 17.4 | 3.8E-01 | |||||||||
| height | 0.0E+00 | 8.8E-05 | 1.8E-04 | 168.8 | 13.8 | 3.5E-03 | 7.7E-03 | 2.0E-04 | 226707 | chartevents | mv | 168.8 | 13.8 | 3.4E-03 |
| 226730 | chartevents | mv | 168.8 | 13.9 | 3.4E-03 | |||||||||
| 1394 | chartevents | cv | 167.6 | 18.0 | 9.1E-07 | |||||||||
| hematocrit | 0.0E+00 | 0.0E+00 | 3.8E-06 | 31.0 | 5.4 | 1.2E-01 | 1.4E-01 | 1.0E-01 | 50810 | labevents | lab | 31.4 | 6.2 | 1.5E-02 |
| 813 | chartevents | cv | 30.7 | 4.9 | 5.1E-02 | |||||||||
| 220545 | chartevents | mv | 30.6 | 5.2 | 3.5E-02 | |||||||||
| 51221 | labevents | lab | 31.1 | 5.3 | 8.3E-02 | |||||||||
| hemoglobin | 0.0E+00 | 1.0E-06 | 6.0E-06 | 10.6 | 1.9 | 9.3E-02 | 1.1E-01 | 8.1E-02 | 220228 | chartevents | mv | 10.5 | 1.9 | 2.8E-02 |
| 51222 | labevents | lab | 10.7 | 1.9 | 6.4E-02 | |||||||||
| 50811 | labevents | lab | 10.5 | 2.1 | 1.5E-02 | |||||||||
| 814 | chartevents | cv | 10.6 | 1.7 | 3.4E-02 | |||||||||
| lactate | 1.1E-04 | 4.7E-06 | 4.7E-06 | 2.7 | 2.6 | 2.8E-02 | 3.3E-02 | 2.4E-02 | 50813 | labevents | lab | 2.7 | 2.6 | 2.8E-02 |
| lactate dehydrogenase | 3.4E-05 | 0.0E+00 | 8.5E-05 | 639.7 | 1535.6 | 8.8E-03 | 1.0E-02 | 7.9E-03 | 50954 | labevents | lab | 639.7 | 1535.6 | 8.8E-03 |
| lactate dehydrogenase pleural | NAN | NAN | NAN | 703.5 | 2205.8 | 1.7E-04 | 1.8E-04 | 1.6E-04 | 51054 | labevents | lab | 703.5 | 2205.8 | 1.7E-04 |
| lactic acid | NAN | NAN | NAN | 2.7 | 2.8 | 2.4E-02 | 3.0E-02 | 2.1E-02 | 818 | chartevents | cv | 3.0 | 3.3 | 1.2E-02 |
| 225668 | chartevents | mv | 2.5 | 2.3 | 1.3E-02 | |||||||||
| 1531 | chartevents | cv | 2.9 | 3.2 | 1.0E-02 | |||||||||
| lymphocytes | NAN | NAN | NAN | 13.5 | 11.6 | 1.2E-02 | 1.4E-02 | 1.0E-02 | 51244 | labevents | lab | 13.5 | 11.6 | 1.2E-02 |
| lymphocytes ascites | NAN | NAN | NAN | 23.6 | 21.0 | 1.9E-04 | 2.0E-04 | 1.7E-04 | 51116 | labevents | lab | 23.6 | 21.0 | 1.9E-04 |
| lymphocytes atypical | NAN | NAN | NAN | 2.7 | 3.9 | 9.1E-04 | 8.4E-04 | 9.5E-04 | 51143 | labevents | lab | 2.7 | 3.9 | 9.1E-04 |
| lymphocytes atypical csl | NAN | NAN | NAN | 2.7 | 4.5 | 1.9E-05 | 2.7E-05 | 1.2E-05 | 51343 | labevents | lab | 2.7 | 4.5 | 1.9E-05 |
| lymphocytes body fluid | NAN | NAN | NAN | 19.0 | 22.0 | 2.3E-04 | 2.8E-04 | 2.0E-04 | 51375 | labevents | lab | 9.4 | 13.2 | 2.7E-05 |
| 51427 | labevents | lab | 20.3 | 22.6 | 2.0E-04 | |||||||||
| lymphocytes percent | NAN | NAN | NAN | 17.0 | 14.6 | 6.4E-05 | 6.6E-05 | 6.0E-05 | 51245 | labevents | lab | 17.0 | 14.6 | 6.4E-05 |
| lymphocytes pleural | NAN | NAN | NAN | 29.8 | 26.1 | 1.7E-04 | 1.8E-04 | 1.6E-04 | 51446 | labevents | lab | 29.8 | 26.1 | 1.7E-04 |
| magnesium | 0.0E+00 | 5.9E-06 | 4.6E-05 | 2.1 | 0.4 | 8.2E-02 | 1.1E-01 | 6.7E-02 | 220635 | chartevents | mv | 2.1 | 0.4 | 2.8E-02 |
| 50960 | labevents | lab | 2.0 | 0.4 | 6.4E-02 | |||||||||
| 1532 | chartevents | cv | 2.1 | 0.4 | 2.7E-02 | |||||||||
| 821 | chartevents | cv | 2.0 | 0.4 | 3.5E-02 | |||||||||
| mean blood pressure | 2.2E-04 | 2.0E-05 | 6.1E-05 | 79.4 | 15.5 | 8.6E-01 | 8.9E-01 | 8.5E-01 | 456 | chartevents | cv | 78.3 | 14.7 | 2.8E-01 |
| 220181 | chartevents | mv | 77.2 | 15.0 | 2.5E-01 | |||||||||
| 224 | chartevents | cv | 81.5 | 14.5 | 7.4E-03 | |||||||||
| 225312 | chartevents | mv | 79.7 | 18.7 | 1.1E-02 | |||||||||
| 220052 | chartevents | mv | 81.1 | 18.6 | 1.3E-01 | |||||||||
| 52 | chartevents | cv | 81.5 | 16.8 | 2.5E-01 | |||||||||
| 6702 | chartevents | cv | 76.9 | 13.5 | 2.7E-03 | |||||||||
| 224322 | chartevents | mv | 79.6 | 15.2 | 2.1E-03 | |||||||||
| mean corpuscular hemoglobin | NAN | NAN | NAN | 30.4 | 2.4 | 6.4E-02 | 6.7E-02 | 6.2E-02 | 51248 | labevents | lab | 30.4 | 2.4 | 6.4E-02 |
| mean corpuscular hemoglobin concentration | NAN | NAN | NAN | 34.0 | 1.5 | 6.4E-02 | 6.7E-02 | 6.2E-02 | 51249 | labevents | lab | 34.0 | 1.5 | 6.4E-02 |
| mean corpuscular volume | NAN | NAN | NAN | 89.4 | 6.4 | 6.4E-02 | 6.7E-02 | 6.2E-02 | 51250 | labevents | lab | 89.4 | 6.4 | 6.4E-02 |
| monocytes | NAN | NAN | NAN | 4.6 | 3.8 | 1.2E-02 | 1.4E-02 | 1.0E-02 | 51254 | labevents | lab | 4.6 | 3.8 | 1.2E-02 |
| monocytes csl | NAN | NAN | NAN | 22.6 | 20.0 | 2.7E-04 | 3.2E-04 | 2.4E-04 | 51355 | labevents | lab | 22.6 | 20.0 | 2.7E-04 |
| neutrophils | NAN | NAN | NAN | 77.8 | 14.9 | 1.2E-02 | 1.4E-02 | 1.0E-02 | 51256 | labevents | lab | 77.8 | 14.9 | 1.2E-02 |
| oxygen saturation | 0.0E+00 | 6.6E-07 | 3.6E-06 | 96.7 | 3.6 | 8.6E-01 | 9.0E-01 | 8.3E-01 | 646 | chartevents | cv | 97.0 | 3.5 | 4.8E-01 |
| 50817 | labevents | lab | 88.5 | 13.7 | 2.9E-02 | |||||||||
| 834 | chartevents | cv | 96.7 | 3.4 | 1.6E-02 | |||||||||
| 220277 | chartevents | mv | 96.7 | 3.2 | 3.7E-01 | |||||||||
| 220227 | chartevents | mv | 96.1 | 4.1 | 7.3E-03 | |||||||||
| partial pressure of carbon dioxide | 0.0E+00 | 2.0E-06 | 2.0E-06 | 41.2 | 9.6 | 8.2E-02 | 8.5E-02 | 8.2E-02 | 226062 | chartevents | mv | 44.6 | 13.4 | 7.0E-04 |
| 778 | chartevents | cv | 40.8 | 9.1 | 4.2E-02 | |||||||||
| 220235 | chartevents | mv | 41.2 | 9.4 | 2.4E-02 | |||||||||
| 50818 | labevents | lab | 41.2 | 9.7 | 6.9E-02 | |||||||||
| partial pressure of oxygen | 2.8E-04 | 0.0E+00 | 0.0E+00 | 145.8 | 84.9 | 4.2E-02 | 5.9E-03 | 7.1E-02 | 779 | chartevents | cv | 145.8 | 84.9 | 4.2E-02 |
| partial thromboplastin time | 4.0E-04 | 0.0E+00 | 5.2E-06 | 41.2 | 24.6 | 6.2E-02 | 7.5E-02 | 5.3E-02 | 227466 | chartevents | mv | 42.0 | 25.0 | 2.0E-02 |
| 825 | chartevents | cv | 42.1 | 24.9 | 2.6E-02 | |||||||||
| 1533 | chartevents | cv | 41.4 | 24.3 | 2.0E-02 | |||||||||
| 51275 | labevents | lab | 41.1 | 24.6 | 5.0E-02 | |||||||||
| peak inspiratory pressure | 6.9E-02 | 3.2E-03 | 5.7E-03 | 22.8 | 6.6 | 5.2E-02 | 6.3E-02 | 4.4E-02 | 535 | chartevents | cv | 25.3 | 6.1 | 2.5E-02 |
| 224695 | chartevents | mv | 20.4 | 6.1 | 2.7E-02 | |||||||||
| ph | 0.0E+00 | 2.2E-06 | 4.5E-05 | 7.4 | 0.1 | 9.1E-02 | 9.4E-02 | 9.1E-02 | 860 | chartevents | cv | 7.4 | 0.1 | 1.7E-03 |
| 223830 | chartevents | mv | 7.4 | 0.1 | 2.5E-02 | |||||||||
| 1126 | chartevents | cv | 7.4 | 0.1 | 4.2E-02 | |||||||||
| 780 | chartevents | cv | 7.4 | 0.1 | 4.5E-02 | |||||||||
| 50831 | labevents | lab | 7.4 | 0.2 | 1.0E-04 | |||||||||
| 50820 | labevents | lab | 7.4 | 0.1 | 7.7E-02 | |||||||||
| 220274 | chartevents | mv | 7.4 | 0.1 | 1.7E-03 | |||||||||
| ph urine | NAN | NAN | NAN | 5.8 | 0.9 | 1.1E-02 | 1.2E-02 | 9.9E-03 | 51491 | labevents | lab | 5.8 | 0.9 | 1.1E-02 |
| 51094 | labevents | lab | 5.2 | 1.8 | 4.5E-05 | |||||||||
| phosphate | 1.2E-04 | 2.8E-06 | 1.9E-05 | 3.5 | 1.4 | 5.4E-02 | 5.9E-02 | 5.1E-02 | 50970 | labevents | lab | 3.5 | 1.4 | 5.4E-02 |
| phosphorous | NAN | NAN | NAN | 3.5 | 1.4 | 5.2E-02 | 6.0E-02 | 5.0E-02 | 1534 | chartevents | cv | 3.5 | 1.4 | 2.2E-02 |
| 225677 | chartevents | mv | 3.4 | 1.4 | 2.5E-02 | |||||||||
| 827 | chartevents | cv | 3.5 | 1.5 | 2.8E-02 | |||||||||
| plateau pressure | NAN | NAN | NAN | 20.2 | 5.7 | 3.1E-02 | 2.7E-02 | 3.5E-02 | 224696 | chartevents | mv | 19.3 | 5.0 | 1.1E-02 |
| 543 | chartevents | cv | 20.7 | 6.0 | 2.0E-02 | |||||||||
| platelets | 0.0E+00 | 2.3E-06 | 2.3E-06 | 205.0 | 113.4 | 8.5E-02 | 1.1E-01 | 7.1E-02 | 51265 | labevents | lab | 205.2 | 113.3 | 6.7E-02 |
| 828 | chartevents | cv | 196.8 | 108.9 | 3.5E-02 | |||||||||
| 227457 | chartevents | mv | 203.9 | 113.8 | 2.8E-02 | |||||||||
| positive end-expiratory pressure | 0.0E+00 | 1.6E-04 | 2.1E-04 | 7.2 | 3.5 | 1.6E-02 | 2.1E-02 | 1.2E-02 | 50819 | labevents | lab | 7.1 | 3.6 | 1.0E-02 |
| 224700 | chartevents | mv | 7.4 | 3.5 | 6.5E-03 | |||||||||
| positive end-expiratory pressure set | NAN | NAN | NAN | 6.2 | 2.9 | 7.4E-02 | 7.3E-02 | 7.5E-02 | 506 | chartevents | cv | 6.2 | 2.9 | 4.4E-02 |
| 220339 | chartevents | mv | 6.2 | 2.9 | 3.0E-02 | |||||||||
| post void residual | NAN | NAN | NAN | 205.6 | 135.0 | 1.4E-03 | 1.0E-05 | 2.3E-03 | 512 | chartevents | cv | 205.6 | 135.0 | 1.4E-03 |
| potassium | 0.0E+00 | 9.7E-06 | 1.6E-05 | 4.1 | 0.6 | 1.1E-01 | 1.1E-01 | 1.1E-01 | 829 | chartevents | cv | 4.1 | 0.6 | 5.7E-02 |
| 50971 | labevents | lab | 4.1 | 0.7 | 7.3E-02 | |||||||||
| 1535 | chartevents | cv | 4.1 | 0.6 | 4.3E-02 | |||||||||
| 227464 | chartevents | mv | 4.2 | 0.7 | 1.1E-02 | |||||||||
| 50822 | labevents | lab | 4.2 | 0.7 | 3.4E-02 | |||||||||
| potassium serum | NAN | NAN | NAN | 4.1 | 0.9 | 3.2E-02 | 7.0E-02 | 6.4E-03 | 227442 | chartevents | mv | 4.1 | 0.9 | 3.2E-02 |
| prothrombin time inr | NAN | NAN | NAN | 1.5 | 1.2 | 5.9E-02 | 7.2E-02 | 5.1E-02 | 227467 | chartevents | mv | 1.5 | 0.9 | 1.9E-02 |
| 1530 | chartevents | cv | 1.5 | 1.2 | 1.9E-02 | |||||||||
| 815 | chartevents | cv | 1.5 | 1.3 | 2.4E-02 | |||||||||
| 51237 | labevents | lab | 1.5 | 1.3 | 4.7E-02 | |||||||||
| prothrombin time pt | NAN | NAN | NAN | 16.0 | 7.0 | 5.9E-02 | 7.2E-02 | 5.1E-02 | 1286 | chartevents | cv | 15.6 | 5.8 | 1.9E-02 |
| 824 | chartevents | cv | 15.4 | 5.4 | 2.4E-02 | |||||||||
| 227465 | chartevents | mv | 16.5 | 7.5 | 1.9E-02 | |||||||||
| 51274 | labevents | lab | 15.8 | 6.8 | 4.7E-02 | |||||||||
| pulmonary artery pressure mean | NAN | NAN | NAN | 29.6 | 9.3 | 3.1E-02 | 1.9E-03 | 5.2E-02 | 491 | chartevents | cv | 29.6 | 9.3 | 3.1E-02 |
| pulmonary artery pressure systolic | NAN | NAN | NAN | 38.1 | 12.3 | 9.6E-02 | 6.0E-02 | 1.2E-01 | 492 | chartevents | cv | 38.4 | 12.6 | 7.3E-02 |
| 220059 | chartevents | mv | 37.0 | 11.1 | 2.3E-02 | |||||||||
| pulmonary capillary wedge pressure | NAN | NAN | NAN | 17.1 | 7.2 | 2.7E-03 | 5.9E-05 | 4.5E-03 | 504 | chartevents | cv | 17.1 | 7.2 | 2.7E-03 |
| red blood cell count | NAN | NAN | NAN | 3.5 | 0.7 | 6.4E-02 | 6.7E-02 | 6.2E-02 | 833 | chartevents | cv | 3.5 | 0.6 | 3.2E-02 |
| 51279 | labevents | lab | 3.5 | 0.7 | 6.4E-02 | |||||||||
| red blood cell count ascites | NAN | NAN | NAN | 11237.7 | 43047.3 | 1.9E-04 | 2.0E-04 | 1.7E-04 | 51127 | labevents | lab | 11237.7 | 43047.3 | 1.9E-04 |
| red blood cell count csf | NAN | NAN | NAN | 8973.0 | 43551.6 | 2.9E-04 | 3.2E-04 | 2.7E-04 | 51362 | labevents | lab | 8973.0 | 43551.6 | 2.9E-04 |
| red blood cell count pleural | NAN | NAN | NAN | 67484.9 | 585750.6 | 1.7E-04 | 1.7E-04 | 1.6E-04 | 51457 | labevents | lab | 67484.9 | 585750.6 | 1.7E-04 |
| red blood cell count urine | NAN | NAN | NAN | 49.8 | 121.7 | 2.6E-03 | 3.8E-03 | 1.6E-03 | 51493 | labevents | lab | 49.8 | 121.7 | 2.6E-03 |
| respiratory rate | 0.0E+00 | 3.6E-07 | 2.4E-06 | 19.1 | 5.7 | 8.8E-01 | 9.2E-01 | 8.6E-01 | 224422 | chartevents | mv | 20.8 | 6.9 | 2.5E-03 |
| 618 | chartevents | cv | 19.4 | 5.7 | 5.0E-01 | |||||||||
| 220210 | chartevents | mv | 19.2 | 5.5 | 3.8E-01 | |||||||||
| 224689 | chartevents | mv | 9.5 | 10.8 | 2.6E-02 | |||||||||
| 614 | chartevents | cv | 2.8 | 5.0 | 2.7E-02 | |||||||||
| 651 | chartevents | cv | 22.3 | 7.3 | 3.4E-03 | |||||||||
| 224690 | chartevents | mv | 18.9 | 5.7 | 2.1E-02 | |||||||||
| 615 | chartevents | cv | 18.6 | 6.2 | 4.3E-02 | |||||||||
| respiratory rate set | NAN | NAN | NAN | 15.6 | 8.0 | 4.6E-02 | 4.3E-02 | 4.9E-02 | 224688 | chartevents | mv | 16.8 | 10.7 | 1.8E-02 |
| 619 | chartevents | cv | 14.9 | 5.7 | 2.9E-02 | |||||||||
| sodium | 1.6E-05 | 1.6E-06 | 0.0E+00 | 138.6 | 5.3 | 1.0E-01 | 1.3E-01 | 8.1E-02 | 50983 | labevents | lab | 138.9 | 5.2 | 7.0E-02 |
| 837 | chartevents | cv | 138.9 | 5.1 | 3.9E-02 | |||||||||
| 1536 | chartevents | cv | 138.9 | 5.1 | 3.0E-02 | |||||||||
| 220645 | chartevents | mv | 138.8 | 5.4 | 3.1E-02 | |||||||||
| 226534 | chartevents | mv | 136.2 | 5.1 | 4.2E-03 | |||||||||
| 50824 | labevents | lab | 137.1 | 4.7 | 1.3E-02 | |||||||||
| systemic vascular resistance | NAN | NAN | NAN | 996.6 | 354.7 | 3.4E-02 | 5.3E-03 | 5.7E-02 | 626 | chartevents | cv | 996.6 | 354.7 | 3.4E-02 |
| systolic blood pressure | 0.0E+00 | 0.0E+00 | 1.1E-06 | 121.8 | 22.0 | 8.7E-01 | 8.9E-01 | 8.6E-01 | 442 | chartevents | cv | 120.3 | 24.7 | 4.7E-04 |
| 227243 | chartevents | mv | 123.7 | 26.5 | 1.4E-04 | |||||||||
| 224167 | chartevents | mv | 120.2 | 27.6 | 1.7E-04 | |||||||||
| 220179 | chartevents | mv | 121.1 | 21.4 | 2.5E-01 | |||||||||
| 225309 | chartevents | mv | 115.3 | 23.7 | 1.1E-02 | |||||||||
| 6701 | chartevents | cv | 109.3 | 22.3 | 2.7E-03 | |||||||||
| 220050 | chartevents | mv | 121.5 | 22.3 | 1.3E-01 | |||||||||
| 51 | chartevents | cv | 122.5 | 24.4 | 2.5E-01 | |||||||||
| 455 | chartevents | cv | 121.2 | 22.0 | 2.8E-01 | |||||||||
| temperature | 8.0E-06 | 0.0E+00 | 2.7E-04 | 37.0 | 0.8 | 2.9E-01 | 2.7E-01 | 3.1E-01 | 223761 | chartevents | mv | 36.8 | 0.7 | 9.7E-02 |
| 677 | chartevents | cv | 36.9 | 0.8 | 1.3E-01 | |||||||||
| 676 | chartevents | cv | 37.2 | 0.7 | 5.9E-02 | |||||||||
| 679 | chartevents | cv | 37.2 | 0.7 | 5.9E-02 | |||||||||
| 678 | chartevents | cv | 36.9 | 0.8 | 1.3E-01 | |||||||||
| 223762 | chartevents | mv | 37.1 | 0.9 | 1.3E-02 | |||||||||
| tidal volume observed | NAN | NAN | NAN | 541.5 | 737.0 | 6.4E-02 | 7.0E-02 | 5.8E-02 | 224685 | chartevents | mv | 504.8 | 2208.9 | 2.7E-02 |
| 50826 | labevents | lab | 563.8 | 169.0 | 1.1E-02 | |||||||||
| 682 | chartevents | cv | 575.2 | 124.7 | 2.8E-02 | |||||||||
| tidal volume set | NAN | NAN | NAN | 535.8 | 121.2 | 4.3E-02 | 4.1E-02 | 4.5E-02 | 224684 | chartevents | mv | 489.4 | 88.5 | 1.7E-02 |
| 683 | chartevents | cv | 565.3 | 129.7 | 2.7E-02 | |||||||||
| tidal volume spontaneous | NAN | NAN | NAN | 489.4 | 2207.5 | 3.2E-02 | 3.3E-02 | 3.1E-02 | 684 | chartevents | cv | 457.2 | 194.1 | 1.8E-02 |
| 224686 | chartevents | mv | 531.9 | 3355.6 | 1.4E-02 | |||||||||
| total protein | NAN | NAN | NAN | 5.7 | 1.1 | 1.9E-04 | 3.1E-05 | 3.2E-04 | 1539 | chartevents | cv | 5.7 | 1.1 | 1.5E-04 |
| 849 | chartevents | cv | 5.7 | 1.1 | 1.9E-04 | |||||||||
| total protein urine | NAN | NAN | NAN | 139.4 | 307.5 | 4.0E-04 | 4.1E-04 | 3.9E-04 | 51102 | labevents | lab | 139.4 | 307.5 | 4.0E-04 |
| troponin-i | 0.0E+00 | 4.1E-04 | 0.0E+00 | 7.6 | 10.7 | 9.2E-04 | 1.4E-05 | 1.5E-03 | 51002 | labevents | lab | 8.1 | 10.9 | 8.5E-04 |
| 851 | chartevents | cv | 7.7 | 10.7 | 6.2E-04 | |||||||||
| troponin-t | 2.1E-05 | 4.7E-04 | 1.7E-04 | 0.9 | 2.2 | 1.3E-02 | 1.9E-02 | 9.0E-03 | 51003 | labevents | lab | 1.0 | 2.3 | 8.9E-03 |
| 227429 | chartevents | mv | 0.7 | 1.9 | 5.5E-03 | |||||||||
| venous pvo2 | NAN | NAN | NAN | 43.9 | 14.9 | 4.3E-04 | 8.1E-05 | 7.3E-04 | 859 | chartevents | cv | 43.9 | 14.9 | 4.3E-04 |
| weight | 0.0E+00 | 0.0E+00 | 2.1E-04 | 83.1 | 23.4 | 2.8E-02 | 4.6E-02 | 1.4E-02 | 226531 | chartevents | mv | 80.7 | 23.4 | 1.1E-02 |
| 763 | chartevents | cv | 84.3 | 23.0 | 8.1E-03 | |||||||||
| 224639 | chartevents | mv | 86.3 | 23.7 | 6.9E-03 | |||||||||
| 226512 | chartevents | mv | 80.8 | 22.5 | 6.6E-03 | |||||||||
| white blood cell count | 0.0E+00 | 0.0E+00 | 2.5E-06 | 11.9 | 10.0 | 8.1E-02 | 1.0E-01 | 6.6E-02 | 861 | chartevents | cv | 12.2 | 10.0 | 3.2E-02 |
| 1542 | chartevents | cv | 12.2 | 10.4 | 2.5E-02 | |||||||||
| 220546 | chartevents | mv | 11.6 | 9.7 | 2.7E-02 | |||||||||
| 51301 | labevents | lab | 12.0 | 9.8 | 6.4E-02 | |||||||||
| 51300 | labevents | lab | 9.3 | 5.4 | 6.4E-05 | |||||||||
| 1127 | chartevents | cv | 12.2 | 10.2 | 3.1E-02 | |||||||||
| white blood cell count urine | NAN | NAN | NAN | 23.3 | 72.2 | 2.5E-03 | 4.0E-03 | 1.4E-03 | 51516 | labevents | lab | 23.3 | 72.2 | 2.5E-03 |