Performance of the Cherenkov Telescope Array
Abstract:
The Cherenkov Telescope Array (CTA) is expected to become the by far largest and most sensitive observatory for very-high-energy gamma rays in the energy range from 20 GeV to more than 300 TeV. CTA will be capable of detecting gamma rays from extremely faint sources with unprecedented precision on energy and direction. The performance of the future observatory derived from detailed Monte Carlo simulations is presented in this contribution for the two CTA sites located on the island of La Palma (Spain) and near Paranal (Chile). This includes the evaluation of CTA sensitivity over observations pointing towards different elevations and for operations at higher night-sky background light levels.
1 Introduction
The Cherenkov Telescope Array (CTA, [1]) will be the most sensitive instrument for the observation of very-high-energy gamma rays, providing a completely new view of the sky. The observatory will be built at two sites in Paranal (Chile) and on La Palma (Spain), each consisting of a large number of imaging atmospheric Cherenkov telescopes. CTA will observe the faint light induced through the Cherenkov effect by ultra-relativistic particles in the cascade initiated by high-energy gamma rays upon entering the atmosphere. The most important key performance improvements of CTA compared to currently operating instruments are:
-
•
Two sites in both hemispheres which provide a view of almost the entire sky.
-
•
A very large signal detection capability due to the employment of a large number of telescopes (99 telescopes at Paranal, 19 on La Palma). The effective area of CTA South is m2 at 50 GeV, m2 at 1 TeV, and beyond m2 at 10 TeV. This will provide orders of magnitude better sensitivity than e.g. the Fermi LAT to short-timescale transient phenomena like GRBs or flaring active galactic nuclei [2].
-
•
A powerful identification scheme of background events from cosmic-ray nucleons, which results in an increase in sensitivity by a factor of five to ten as compared to the current instruments.
-
•
A very wide energy range from 20 GeV to beyond 300 TeV covered by a single facility through the deployment of telescopes with different optical collection areas.
-
•
A significant improvement in angular and spectral resolution. The angular resolution is expected to reach two arcminutes, allowing imaging of extended sources in great detail. The improved energy reconstruction results in a resolution and systematic uncertainty on the energy scale of less than 10%. This will provide the ability to observe new features in energy spectra (e.g. lines or cutoffs) in moderately bright sources.
-
•
Flexibility in operations due to the large number of telescopes: feasible observation modes consisting of full array operation for highest sensitivity; sub-array operations for the simultaneous observations of several targets; and a divergent-pointing mode providing a instantaneous field of view of up to 20 deg diameter.
In this work, an overview of the CTA Observatory performance is provided and compared with the most important current and future observatories operating at these wavelengths.
2 Monte Carlo simulations, reconstruction & analysis
Performance estimates are derived from detailed Monte Carlo simulations of the observatory at the two CTA sites [3]. The simulations and analysis chain consists of air shower simulations and Cherenkov light production using the CORSIKA simulation code [4]; the simulation of the detector response using the sim_telarray package [5], and reconstruction using the Eventdisplay [6] and MARS [7] analysis software packages222Dedicated CTA reconstruction software is currently under development and expected to provide improved performance compared to that presented here..
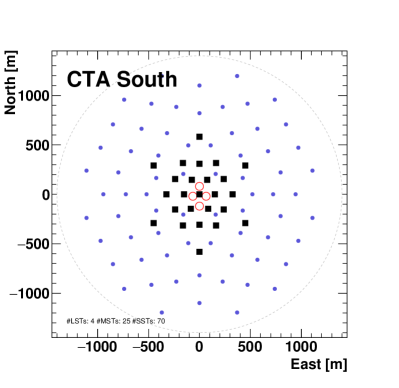
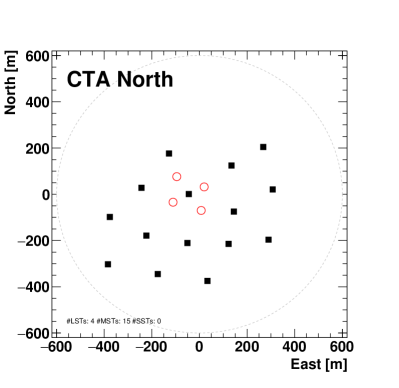
Table 1 gives an overview of the site characteristics and the number of telescopes of each type at the two CTA sites. Figure 1 shows the layout indicating telescope positions on the ground. The site choice and the exact arrangement of the telescopes are the result of an extensive and detailed optimisation procedure [8, 9]. The Monte Carlo simulations take the local atmospheric conditions and the configuration of the geomagnetic field into account.
| Site | Longitude, Latitude | Altitude | LSTs | MSTs | SSTs |
| [deg] | [m] | ||||
| Paranal | 70.3W, 24.07S | 2150 | 4 | 25 | 70 |
| La Palma | 17.89W, 28.76N | 2180 | 4 | 15 | - |
Background cosmic-ray spectra of proton and electron/positron particle types are set to match measurements from various cosmic-ray instruments. Heavier nuclei like cosmic ray helium are not simulated, as studies show that there is no significant contribution to the residual background after gamma-hadron separation cuts from these heavier nuclei.
The performance is evaluated for a point-like gamma-ray source located at the centre of the field of view of each camera (nominal telescope pointing scheme is assumed, with all telescopes pointing parallel to each other), with the exception of the results presented in Figure 6.
3 Performance of CTA
The unique capabilities of CTA for the detection of gamma rays is evaluated by the following metrics.
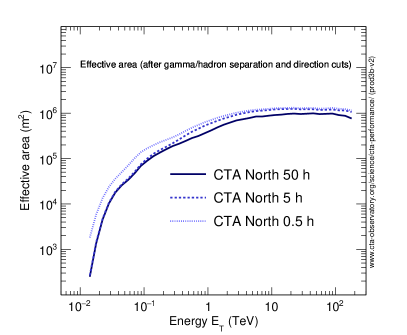
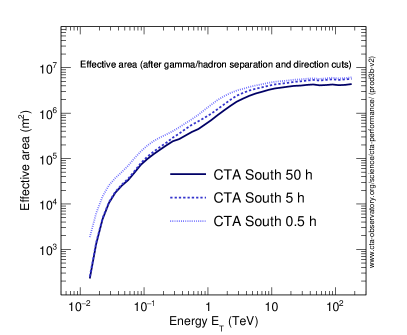
The effective collection area for gamma rays describes the signal detection power of CTA. The effective collection areas assuming point-like gamma-ray sources are shown in Figure 2 for cuts optimised to maximize sensitivity over a set of typical observation times. It reaches m2 for CTA North and beyond m2 for CTA South at high energies. Especially notable is the sensitive area of several thousands of m2 in the threshold region around 30 GeV.
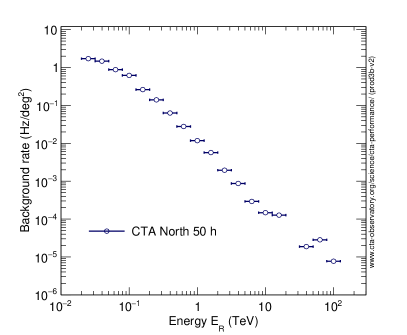
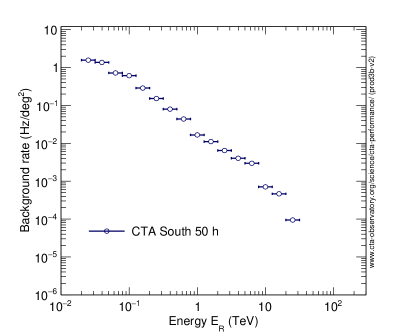
The post-analysis residual cosmic-ray background rate for gamma-hadron separation cuts optimised for 50 h of observation time are shown in Figure 3. The background rate is integrated in 0.2-decade-wide bins in estimated energy (i.e. five bins per decade). Note that the strong background suppression capabilities of CTA means that the majority of background events in the energy range between 200 GeV and TeV are due to cosmic-ray electrons and positrons.
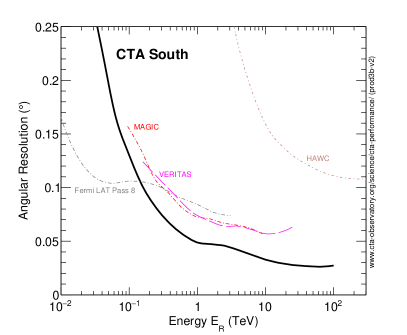
The angular resolution is defined as the angle within which 68% of reconstructed gamma rays fall, relative to their true direction (Figure 4, left). CTA will achieve an angular resolution of better than 2 arcmin at energies above several TeV. Note that this analysis is not optimised to provide the best possible angular resolution, but rather the best point-source sensitivity (as long as it complies with the minimum required angular resolution). Dedicated analysis cuts will provide, relative to the instrument response functions shown here, improved angular (or spectral) resolution, enabling e.g. a better study of the morphology or spectral characteristics of bright sources.
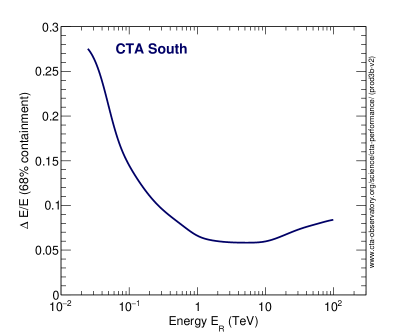
The energy resolution E / E is obtained from the distribution of (ER - ET) / ET, where ER and ET respectively refer to the reconstructed and true energies of gamma-ray events recorded by CTA (Figure 4, right). E/E is the half-width of the interval around 0 which contains 68% of the distribution.
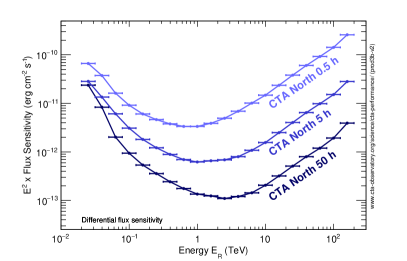
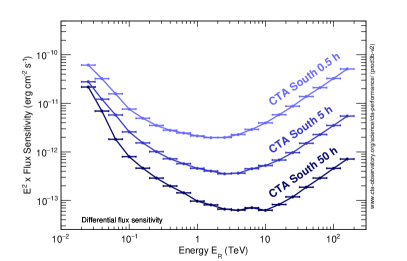
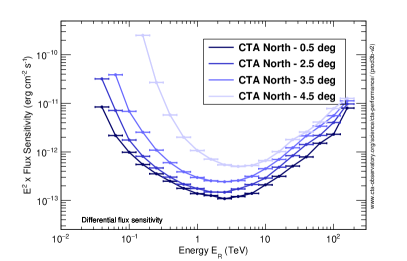
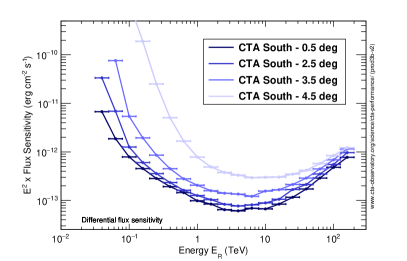
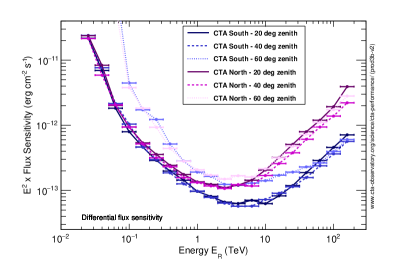
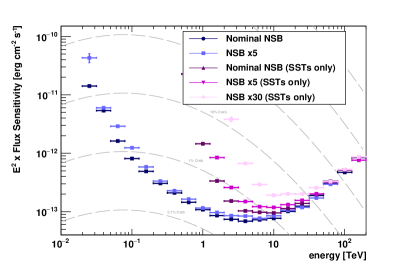
The most important performance benchmark is the differential sensitivity, shown in Figures 5, 6, and 7 for point-like gamma-ray sources for the two CTA sites and for different observing conditions. Differential sensitivity is defined as the minimum flux needed by CTA to obtain a 5-standard-deviation detection of a point-like source, calculated in non-overlapping logarithmic energy bins (five per decade). Besides the significant detection, we require at least ten detected gamma rays per energy bin, and a signal/background ratio of at least 1/20. The analysis cuts in each bin have been optimised to achieve the best flux sensitivity to point-like sources. The optimal cut values depend on the duration of the observation, therefore the instrument response functions are provided for three different observation times: 0.5, 5 and 50 hours.
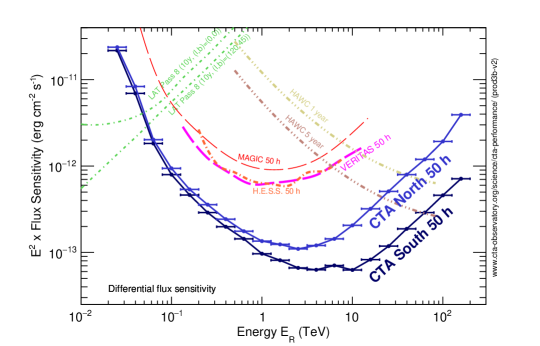
Figure 8 compares the sensitivity of CTA with those of other major instruments in the field. The figure shows the significant improvement CTA will provide, especially in the energy range between 50 GeV and 25 TeV. For a comprehensive overview of how CTA will transform our understanding of the high-energy universe and which fundamental questions will be answered, see the CTA science book [10].
Instrument response functions for the observing conditions discussed in these proceedings can be downloaded from [11].
Acknowledgments
This work was conducted in the context of the CTA Consortium and CTA Observatory.
We gratefully acknowledge financial support from the agencies and organizations listed here: http://www.cta-observatory.org/consortium_acknowledgments. We also would like to thank the computing centres that provided resources for the generation of the instrument response functions, see [11] for a full list of contributing institutions.
References
- [1] www.cta-observatory.org
- [2] Funk, S. & Hinton, J. (The CTA Consortium), 2013, Astroparticle Physics, 43, 348
- [3] Bernlöhr, K. et al. (The CTA Consortium), 2013, Astroparticle Physics, 43, 171
- [4] D. Heck et al., CORSIKA: a Monte Carlo code to simulate extensive air showers, 1998, Tech. Rep. FZKA 6019, Forschungszentrum Karlsruhe
- [5] Bernlöhr, K., 2008, Astroparticle Physics, 30, 149
- [6] Maier, G. & Holder, J., 2017, \posPoS(ICRC2017)747. arXiv:1708.04048
- [7] Moralejo, A., Gaug M., Carmona E. et al., 2009, Proceedings of the 31st International Cosmic Ray Conference, Łodz, arXiv:0907.0943
- [8] Hassan, T. et al., 2017, Astroparticle Physics 93, 76
- [9] Acharyya, A. et al. (The CTA Consortium), 2019, Astroparticle Physics 111, 35
- [10] The Cherenkov Telescope Array Consortium, Science with the Cherenkov Telescope Array
- [11] https://www.cta-observatory.org/science/cta-performance
- [12] http://www.slac.stanford.edu/exp/glast/groups/canda/lat_Performance.htm
- [13] Holler et al (The H.E.S.S. collaboration), 2015 Proceedings of the 34th ICRC (adapted)
- [14] Aleksić, J. et al. (The MAGIC Collaboration, 2016 Astroparticle Physics 72, 76
- [15] http://veritas.sao.arizona.edu/about-veritas-mainmenu-81/veritas-specifications-mainmenu-111
- [16] Abeysekara, A.U. et al. (The HAWC Collaboration), 2017, ApJ 843, 39 (World Scientific Publishing, 2019), ISBN 978-981-3270-08-4, arXiv: 1709.07997