Surface resonance of the (21) reconstructed lanthanum hexaboride (001)-cleavage plane: a combined STM and DFT study
Abstract
We performed a combined study of the (001)-cleavage plane of lanthanum hexaboride (LaB6) using scanning tunneling microscopy (STM) and density functional theory (DFT). Experimentally, we found a (21) reconstructed surface on a local scale. The reconstruction is only short-range ordered and tends to order perpendicularly to step edges. At larger distances from surface steps, the reconstruction evolves to a labyrinth-like pattern. These findings are supported by low-energy electron diffraction (LEED) experiments. Slab calculations within the framework of DFT shows that the atomic structure consists of parallel lanthanum chains on top of boron octahedra. Scanning tunneling spectroscopy (STS) shows a prominent spectral feature at eV. Using DFT, we identify this structure as a surface resonance of the (21) reconstructed LaB6 (100)-surface which is dominated by boron dangling bond-states and lanthanum -states.
I Introduction
The rare earth hexaborides (REB6) are a material class with a common, relatively simple crystalline structure, but widely tunable electronic and magnetic properties. For example, dense Kondo behavior is found in CeB6 Takase et al. (1980), PrB6 and NdB6 order antiferromagnetically Geballe et al. (1968), SmB6 is a Kondo insulator Kasuya (1994); Souma et al. (2002), EuB6 is a ferromagnetic semimetal which exhibits colossal magnetoresistance Pohlit et al. (2018), and YbB6 is proposed to host topologically protected states without a Kondo mechanism Neupane et al. (2015). The variety of these phenomena can be traced back to the -occupancy increasing from for La up to in Lu as the rare earth elements.
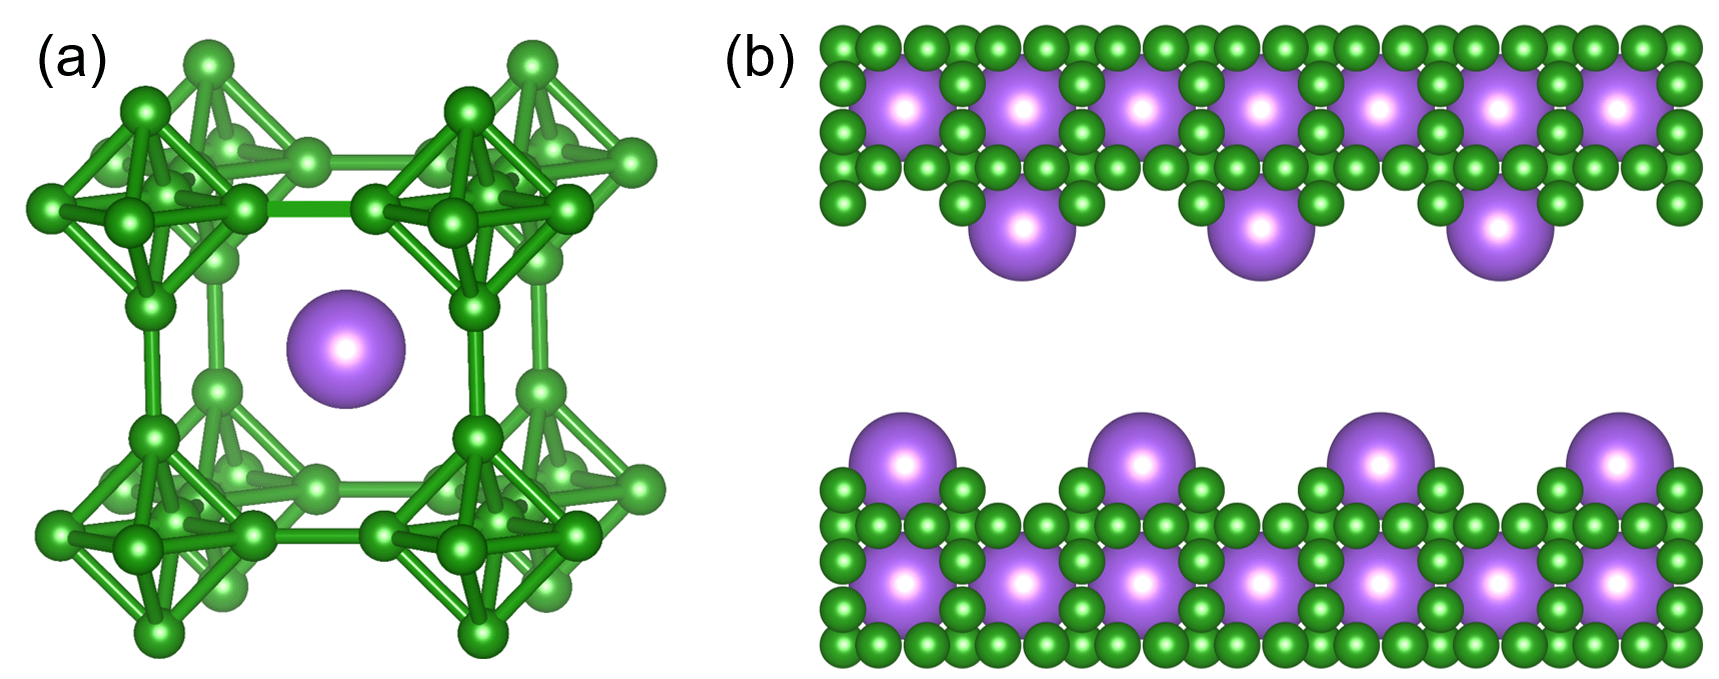
All rare earth hexaborides share the same cubic crystal structure with the B6 octahedra located at the cube’s corners and the rare earth element at the center, as seen in Fig. 1 (a). A three dimensional covalent binding network between the B6 octahedra can be achieved by electron donation of the rare earth element, leading to positively charged ions and negatively charged boron cages in the crystal structure Longuet-Higgins and M. De V. Roberts (1954). The lattice constant changes only slightly across the REB6 series.
One of the most prominent hexaborides is LaB6, a widely used electron emitter due to its extraordinarily low work function Trenary (2012). Recently there has been a growing interest in its solar heat absorbance with regard to possible applications in solar energy devices Sani et al. (2017); Mattox and Urban (2018). Although surface properties play a crucial role in these applications, surface studies of this system display a rather incomplete picture. Even the ground state geometrical structure of the (001)-surface is under current debate. Up to the present date, experimental results show a simple (11) reconstructed surface Trenary (2012), as found in low-energy electron diffraction (LEED) and Auger electron spectroscopy (AES) studies Oshima et al. (1977); Aono et al. (1978, 1979); Swanson and McNeely (1979); Swanson and Dickinson (1976); Chambers and Swanson (1983); Goldstein and Szostak (1978). Scanning tunneling microscopy (STM) experiments at room temperature and under UHV conditions have shown a (11) structure, which has been described to be lanthanum terminated Ozcomert and Trenary (1992a, b). However, it should be noted that the samples of the aforementioned studies have been prepared by polishing and heating. Recently, surface slab calculations of LaB6 (001) based on density functional theory (DFT) have been made Schmidt et al. (2018). Therein, various surface reconstructions are taken into account. Their prediction is a (21) reconstructed surface as ground state. These findings seemingly contradict the (11) surface structure observed so far.
To solve this discrepancy between previous experimental results and recent theoretical predictions, we investigated LaB6 (001) prepared by cleavage in UHV. Therefore, annealing-related impacts on the surface morphology, such as preferential evaporation or thermally activated reorganization, can be minimized.
A (21) reconstructed surface is unambiguously found by using high-resolution STM and LEED measurements. DFT slab calculations resolve the chemical nature of the (21) reconstruction as parallel rows of lanthanum atoms on top of non-reconstructed B6 cages. Its electronic structure close to the Fermi energy is governed by a surface resonance, which is mainly composed of boron -hybrid dangling bond orbitals.
II Methods
II.1 Experimental techniques
STM experiments were performed in a home-built microscope operating at 8 K and at a base pressure of 4 mbar. Tunneling tips were made by electrochemical etching of polycrystalline tungsten wire. The LaB6 single crystals were grown using the floating zone technique as described in Refs. Balakrishnan et al., 2003, 2004. The crystals were oriented by gamma-ray diffraction and cut along the (001)-plane into rectangular samples of about 14 (mm)2 size and 300 m thickness. The samples were cleaved in situ at room temperature along the (001)-plane followed by immediate transfer to the STM head at cryogenic temperature. All STM images were recorded using the constant current topography (CCT) mode. LEED experiments were performed on identically prepared samples, cleaved at a base pressure of 2 mbar and investigated at 2 mbar. The diffraction images presented in this work were recorded at either room temperature or at 27 K. For our LEED experiments we used an ultrafast LEED setup (ULEED), as described in Ref. Vogelgesang et al., 2018. This setup features a laser-pulsed electron gun with an electron beam diameter of about 80 m at the sample. With this technique, the electron beam contains significantly less electrons than in convential systems. Thus, the possibility of electron beam induced surface damage is drastically reduced. The resulting small number of scattered electrons is detected with a microchannel plate (MCP). Atomic force microscopy (AFM) measurements were conducted in a commercial instrument manufactured by Agilent, which operates at ambient condition.
II.2 Calculations
Theoretical results presented in this work are based on DFT Hohenberg and Kohn (1964); Kohn and Sham (1965) and are obtained with the CP-PAW code cpp , which employs the projector-augmented wave method Blöchl (1994) together with a functional minimization scheme derived from the Car-Parrinello molecular dynamics approach Car and Parrinello (1985). We use the local hybrid exchange-correlation functional PBE0r described elsewhere Sotoudeh et al. (2017), which locally replaces a fraction of the PBE Perdew et al. (1996) exchange with the same portion of the exact Hartree-Fock exchange. In the PBE0r functional the Fock-term is expressed in local orbitals and only on-site terms are retained.
III Results
III.1 Surface Morphology
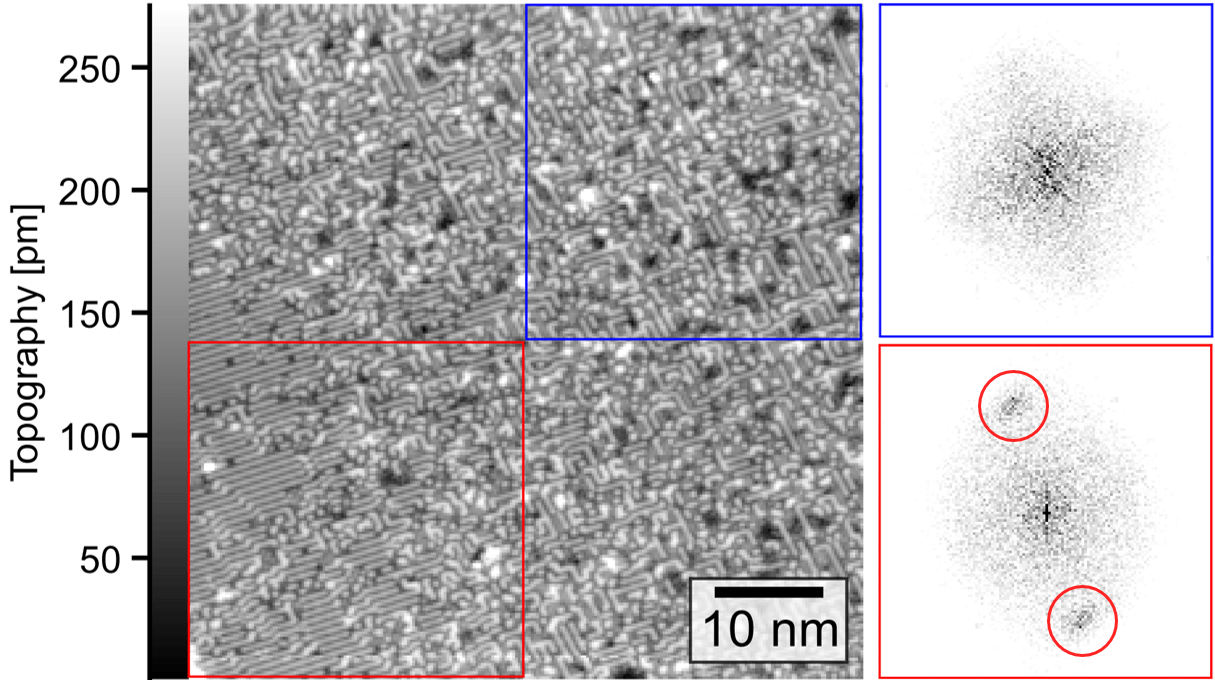
For most of the encountered surfaces probed by STM, the surface appears rather disordered. This is described in more detail in Section .1. Atomically ordered areas on LaB6, as seen in Fig. 2, are scarce and have to be searched for. The atomic structure appears chain-like with a spacing of two bulk lattice constants. Hence, (21) reconstruction peaks can be clearly observed in the Fourier analysis, as seen for the red-marked area of Fig. 2. However, this (21) reconstruction is ordered only on a short range and is mainly labyrinth-like arranged, as seen in the upper right corner of the CCT image in Fig. 2. Although individual chains can still be resolved, no signs of a (21) reconstruction can by found in the Fourier analysis due to the lack of long-range order.
A high-resolution image of the (21) reconstruction, Fig. 3 (a), shows that even for the more ordered areas, the chains exhibit kinks and defects. In the vicinity of the region shown in Fig. 3 (a) a step edge of one lattice constant height has been found.
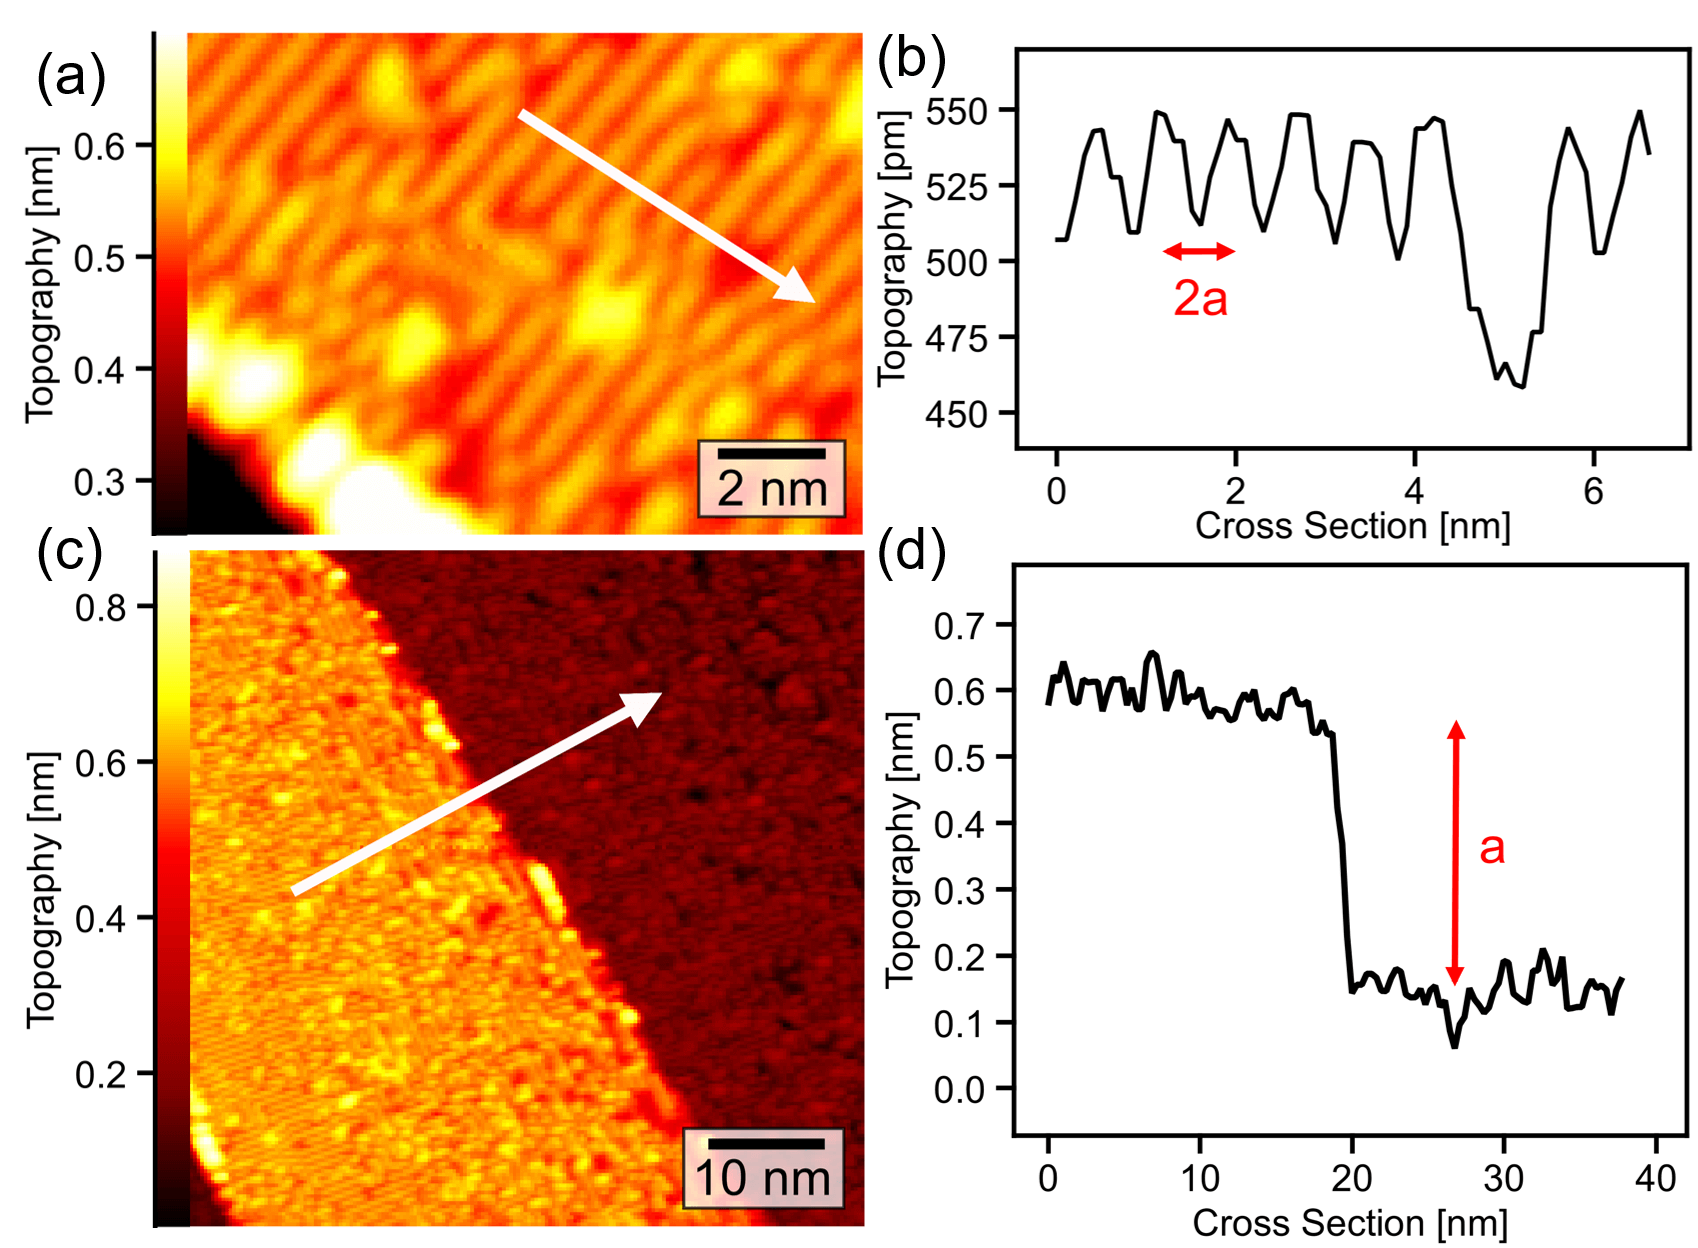
At the step edge, the most ordered (21) reconstruction is observed. Farther away from the step, the chains lose their preferential orientation perpendicular to the step edge, and a more labyrinth-like arrangement is seen, which is similar to the observation in Fig. 2. Therefore, our findings so far suggest a correlation between steps and the occurrence of a well-ordered (21) reconstruction.
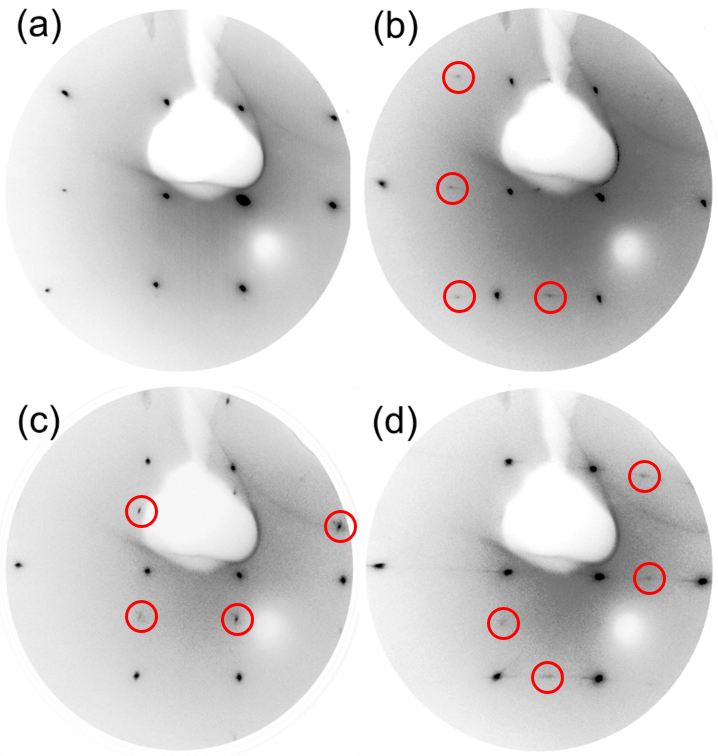
The spatially rather limited observation of long-range order explains why signs of a (21) reconstruction have not yet been found in LEED experiments. In our standard LEED setup, only a (11) structure could be seen that vanished after about 30 minutes of measurement time at a pressure of mbar. The situation changes when using the ultrafast LEED setup and measurements could be carried out over a couple of hours without any noticeable change. Fig. 4 sums up the observed diffraction patterns. For most of the sample areas only a (11) pattern were found, as seen in Fig. 4 (a). In some surface areas, as shown in Fig. 4 (b) and Fig. 4 (c), signs of a (21) or (12) reconstruction are present. In one surface region both (21) and (12) spots were observed, as depicted in Fig. 4 (d). Note that the diffraction patterns do not change upon cooling the sample down to 27 K, apart from the increasing spot intensity and reduced background noise level due to the temperature-dependent Debye-Waller factor.
To clarify the chemical nature of the (21) reconstructed surface, scanning tunneling spectroscopy (STS) was carried out.
III.2 Spatially resolved spectroscopy
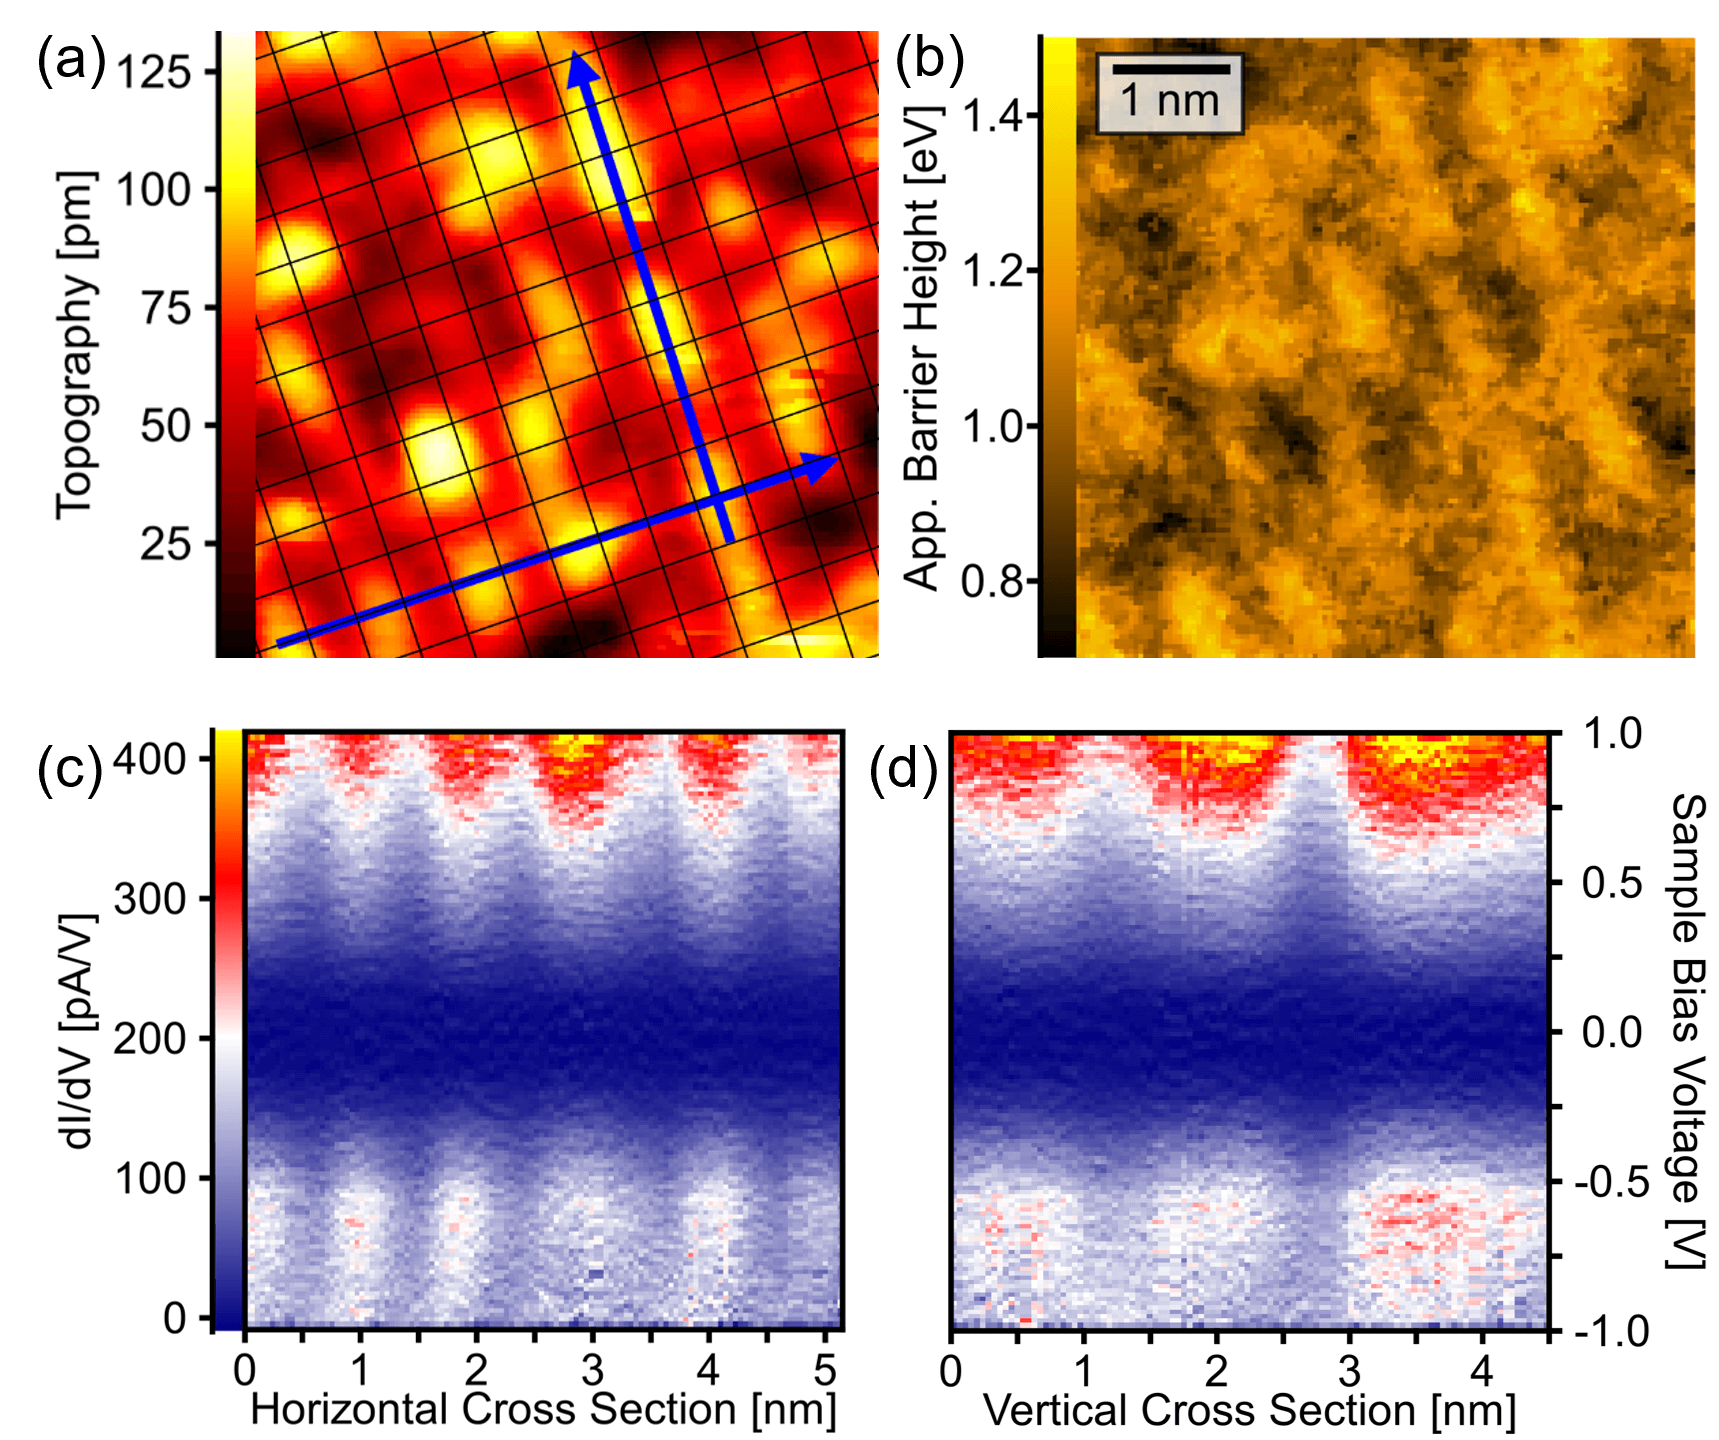
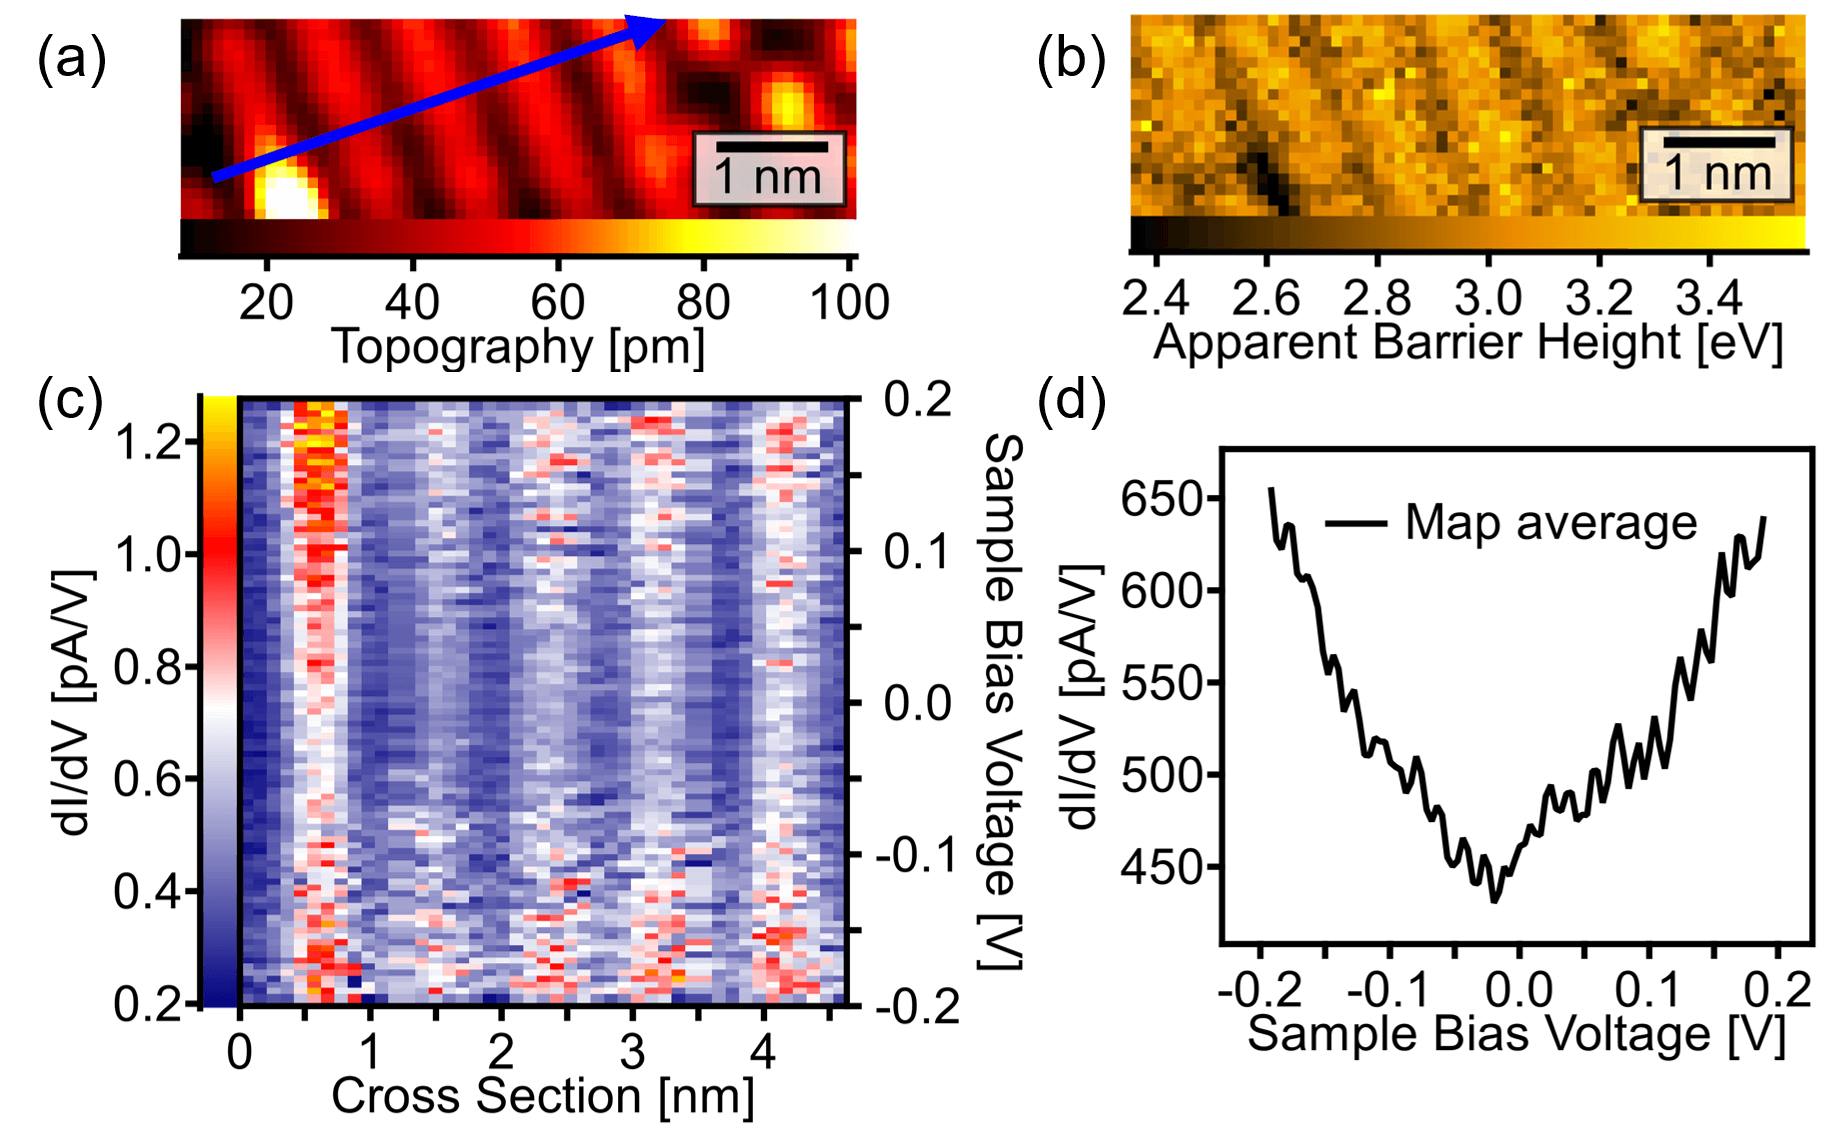
Fig. 5 (a) shows a CCT image, where, simultaneously to the topography, at every measurement point an curve and the apparent barrier height were recorded. The chains of the (21) reconstruction in Fig. 5 extend for only a few unit cells and are interrupted by various defects. Using the curve, its differential conductance dd can be seen as an approximation for the local density of states (LDOS) Tersoff and Hamann (1983, 1985).
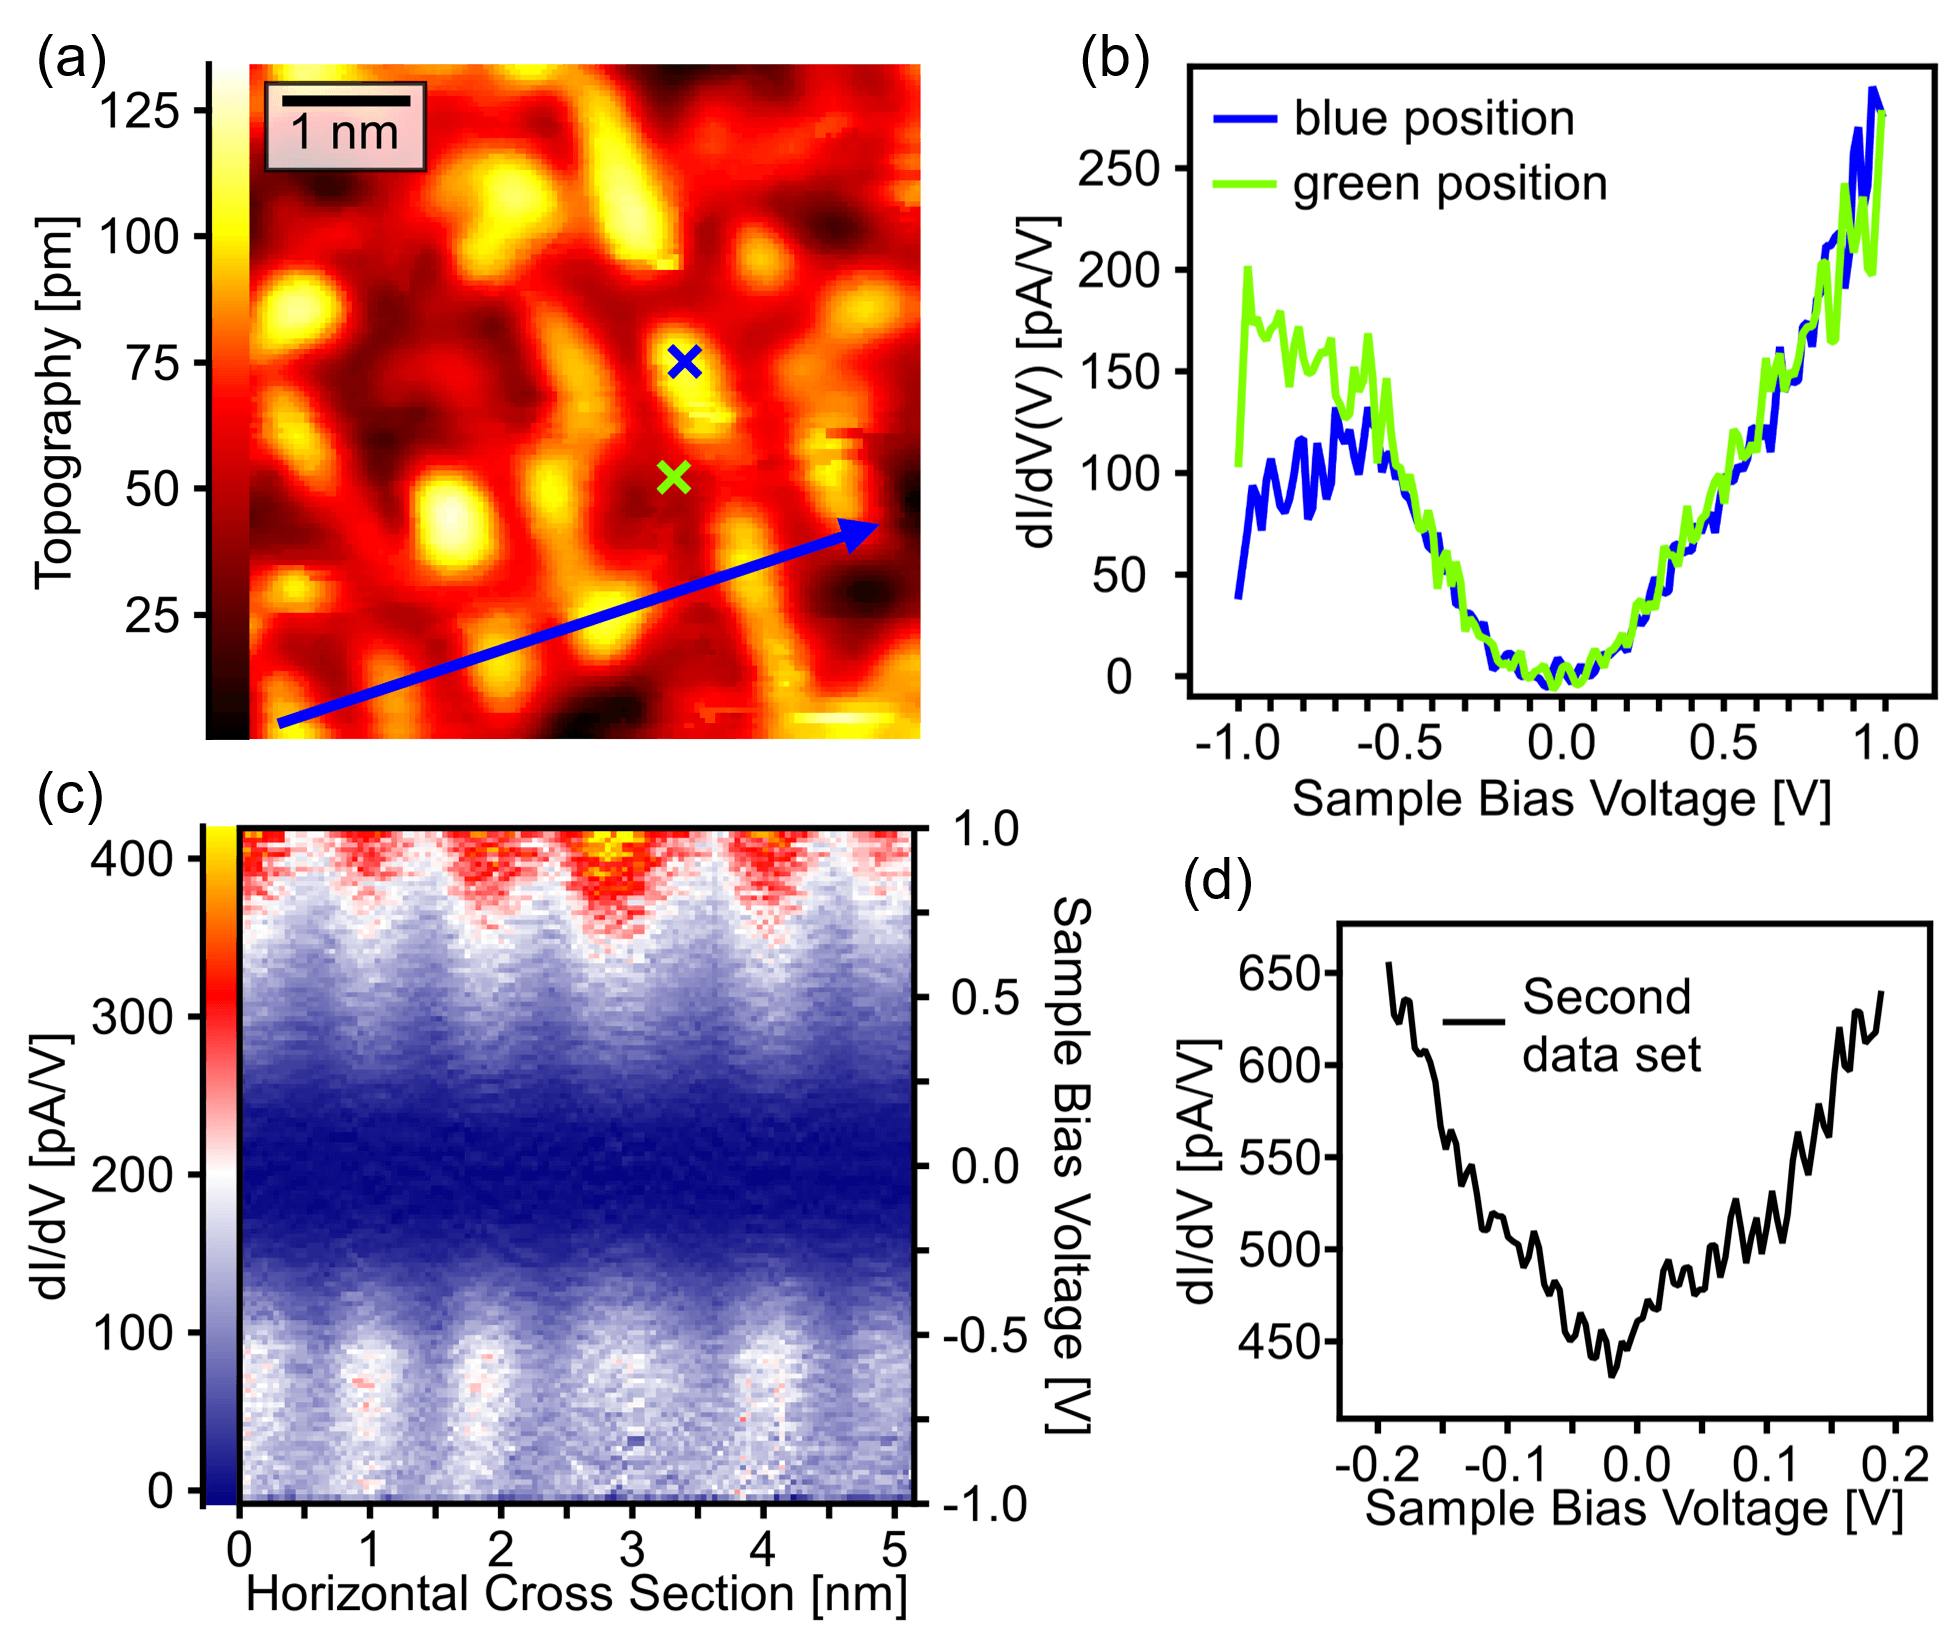
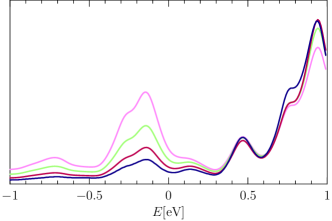
Fig. 5 (b) shows two dd spectra obtained from the blue and the green-marked positions. Clearly, a peak in the differential conductance at about eV can be resolved on top of the protrusion of the reconstruction, blue-marked position, as well as a steep rise of dd towards positive bias voltages. To visualize the spatial variation of the LDOS, the differential conductance can be plotted position dependent as a color coded dd cross section. Since the curves are recorded quasi-simultaneously to the constant current topography, these curves are taken on a modulated contour line given by the topography. To project the measurement onto a constant height above the surface, a topography normalization is applied, as described in Ref. Garleff et al., 2004. This can be done by using the apparent barrier height , which is defined as Chen (2008)
| (1) |
Here, is the change of the tip-sample separation and the electron mass. The apparent barrier height is often used as an estimate for the sample work function. However, its absolute value is connected to the work functions of both tip and sample. The spatially resolved map can be seen in Section .1, Fig. 12 (b), with a mean value of (1.05 0.17) eV. After performing the normalization, the dd data reveals that the eV peak is strongest at the protrusions of the reconstruction, as seen in Fig. 5 (c) for the cross section along the marked direction. However, for this data set the tunneling current has dropped below 1 pA in the vicinity of the Fermi energy, which could be mistaken for a non-metallic surface. To resolve the energy region around , another spectroscopy was performed, which was acquired at a smaller bias voltage set point of 0.2 V. The spatially averaged dd-curve can be seen in Fig. 5 (d) and the full data set in Section .1, Fig. 13. A finite conductance at is clearly present. Moreover, the differential conductance has parabolic shape with a minimum shifted slightly towards negative bias voltages with an additional dd feature at 0.1 eV. The derived apparent barrier height is = (2.99 0.27) eV.
III.3 Surface simulations
Our experimental findings of a (21) reconstructed surface together with previous theoretical predictions Schmidt et al. (2018) point towards a lanthanum terminated (21) surface reconstruction. Based on density functional theory, we performed an in-depth analysis of the electronic surface structure of such a (001)-surface of LaB6 with linear chains of lanthanum atoms at the surface, which are separated by void lines. This termination makes the surface formally charge neutral. Details about the DFT simulations, including the unit cell setup as well as technical parameters are given in Section .2. Therein, we also present the relaxed surface structure.
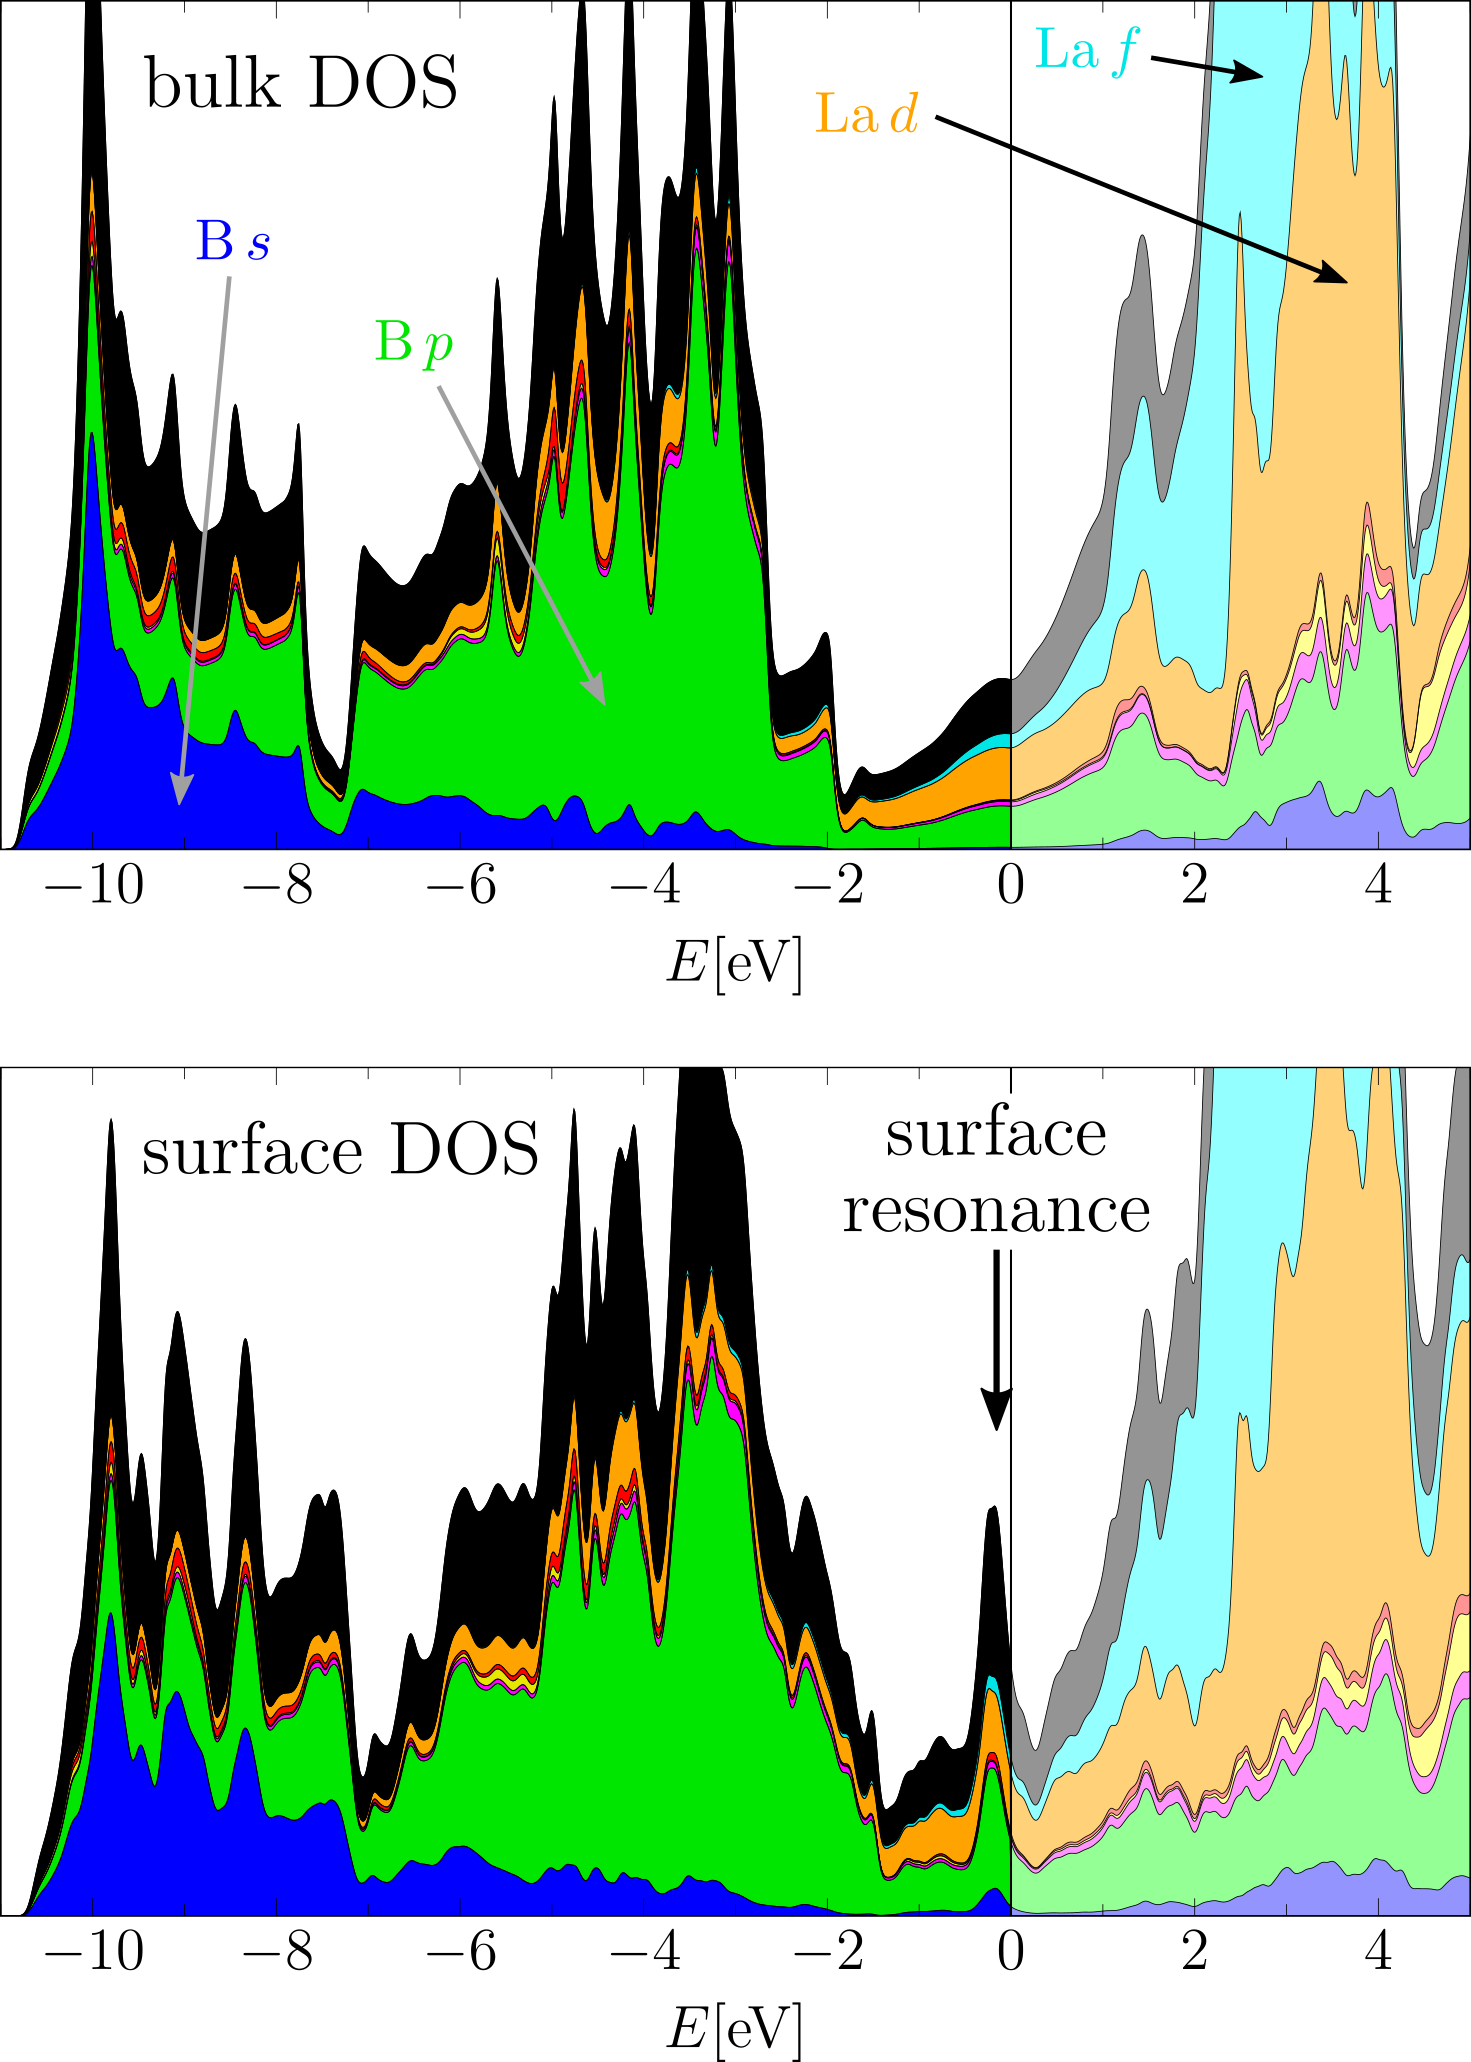
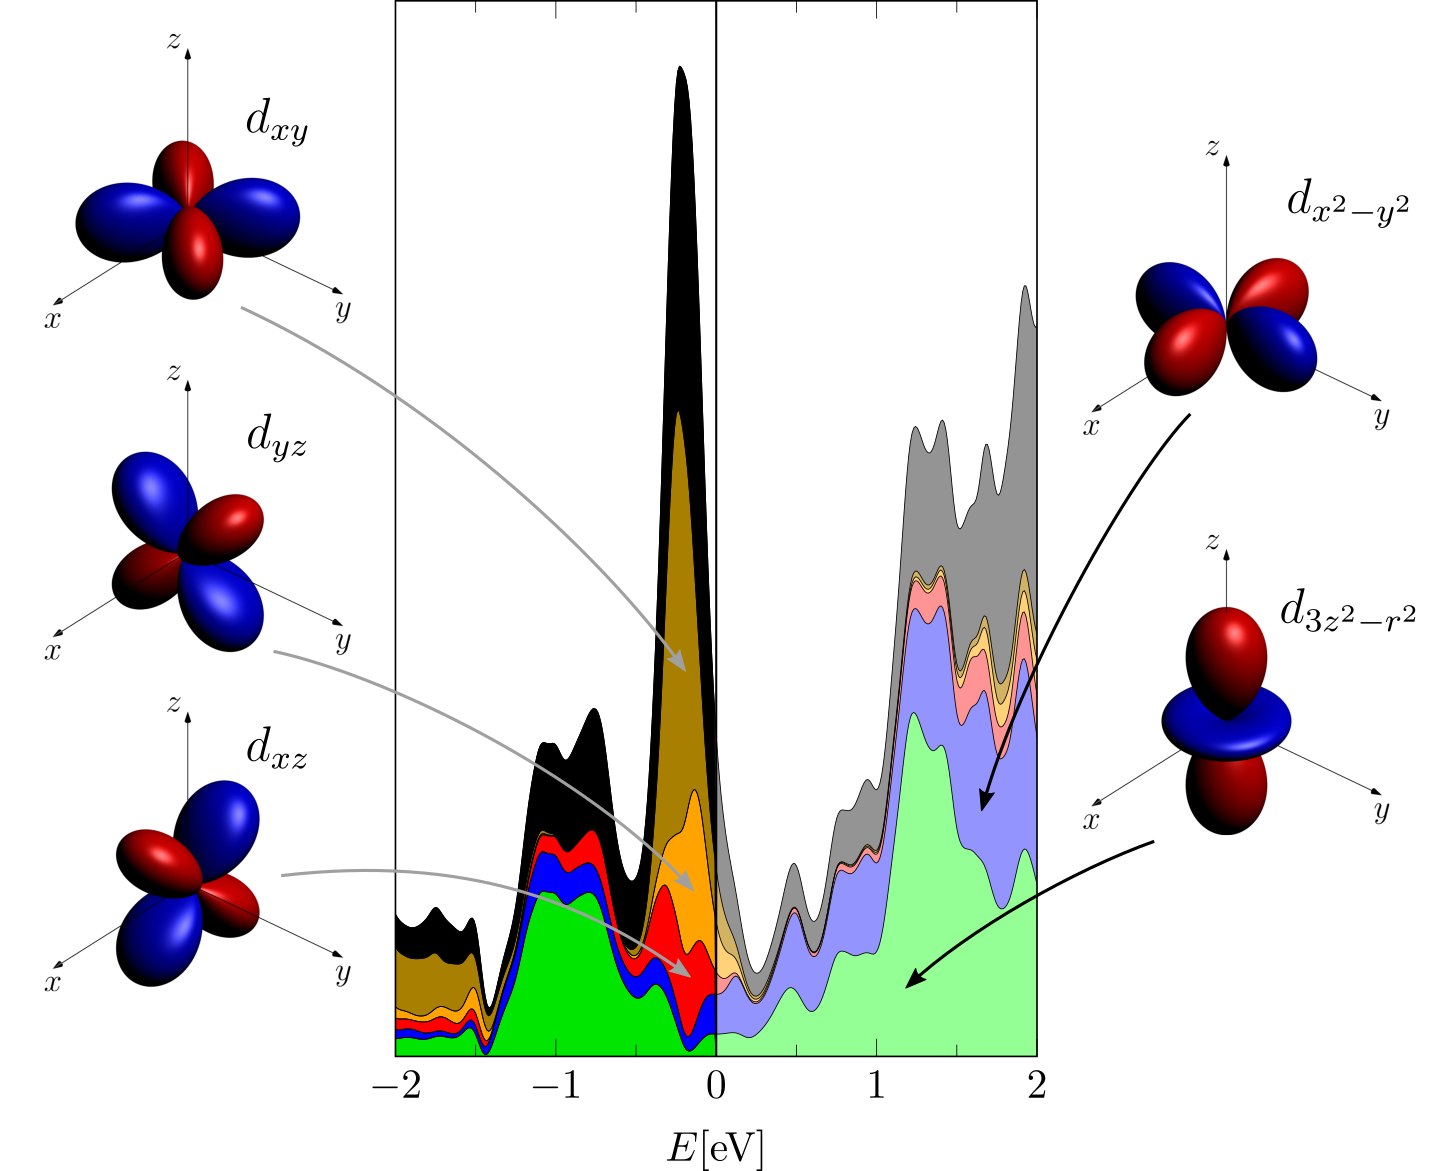
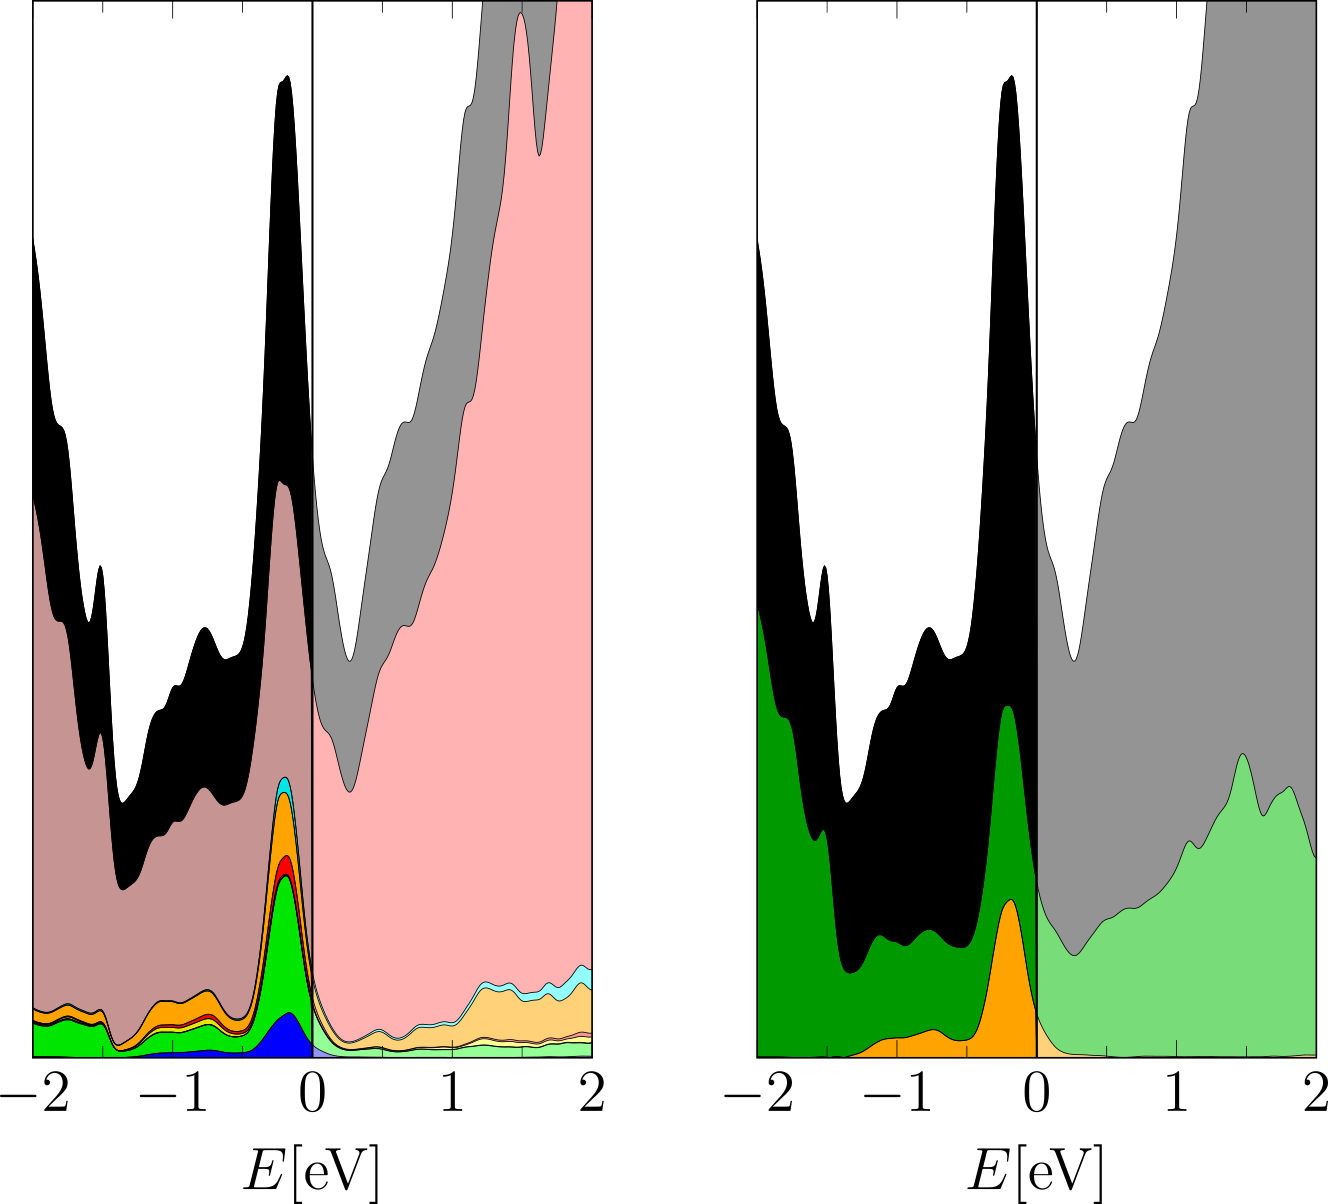
The angular momentum projected density of states (DOS) obtained from our DFT surface calculation is shown in Fig. 6. For comparison, we show the orbital projected DOS of a bulk simulation of LaB6 which is in good agreement with previous DFT results Uijttewaal et al. (2006); Ivashchenko et al. (2018). In the data of the surface slab we find a characteristic peak eV below the Fermi level, which is not present in the bulk data. This peak is a surface feature and is composed largely of states of boron and lanthanum atoms closest to the surface. The peak is made of boron dangling bonds sticking out of the surface, which bind to the La -orbitals lying in the surface plane. The lobes of the -orbital point towards the four adjacent boron dangling bonds. While the contributions of the La - and La -orbitals are rather small within the peak, they are dominant in the energy intervals adjacent to the peak. The projection of the DOS onto the -orbitals of the La surface atoms is depicted in Fig. 7. For additional DOS projections see Section .2.
To connect our DFT simulations more closely to our STM/STS measurements, we follow Bardeen’s tunneling theory Bardeen (1961) together with the arguments of Tersoff and Hamann Tersoff and Hamann (1983, 1985), which relates the tunneling current for energies close to the Fermi level to the local density of states (LDOS) at the tip apex, integrated from the chemical potential of the probe to that of the tip.
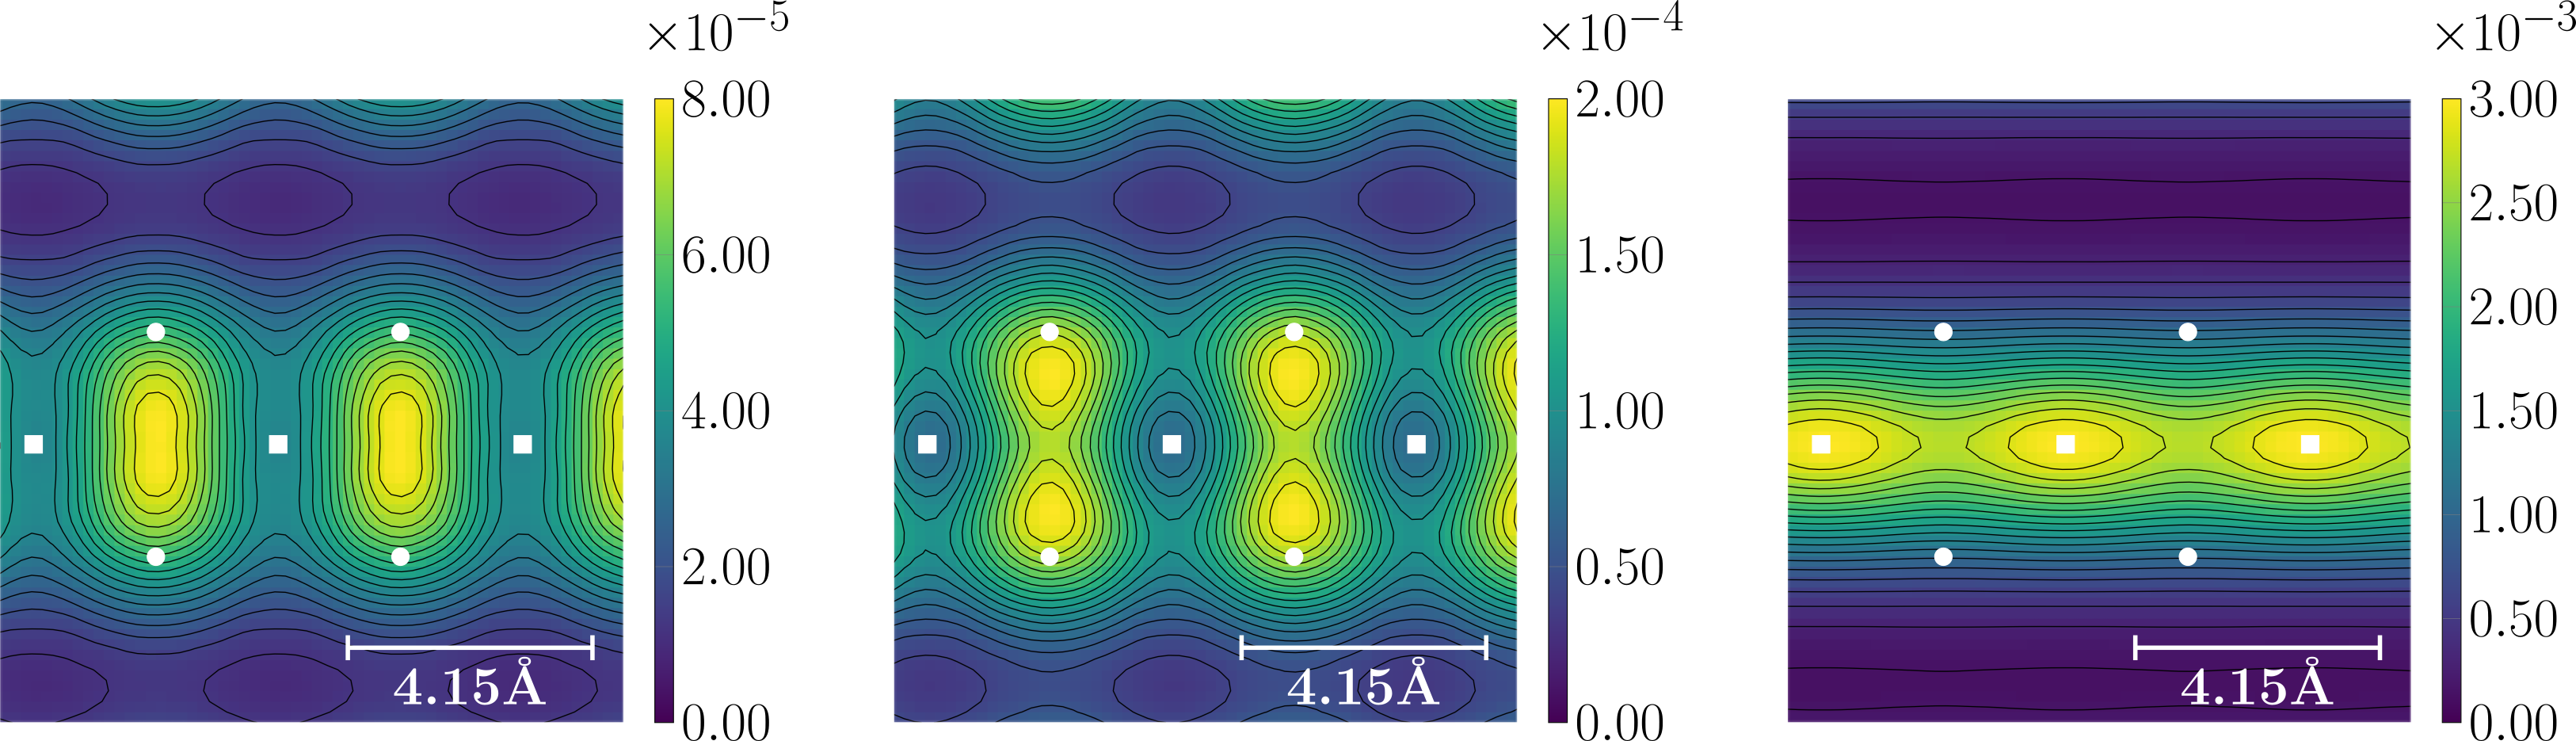
Hence, in order to simulate the STM images, we compute the LDOS integrated over suitable energy windows. Rather than evaluating the LDOS at realistic tip positions, we choose a shorter distance of 4 Å above the plane of surface La ions. This is necessary, since at much larger distances the exponential decay of the LDOS leads to values, that are too small to be resolved in our calculations. Furthermore, at 4 Å the contrast of the significant features is particularly clear. However, by comparing the images taken at 4 Å with images calculated at larger distances, we ensured that the contrast does not change qualitatively.
Fig. 8 shows simulated STM images obtained from specific energy windows. At energies below , the simulation images are dominated by the boron lone pairs (Fig. 8, left and middle graph). The contrast is especially clear in the energy window covering the characteristic peak in the DOS 0.2 eV below the Fermi level (Fig. 8, middle graph). While we observe distinct intensity maxima above the individual boron lone pairs in the energy window of the characteristic peak, we expect them to merge at larger distances, that correspond to realistic tip-surface distances.
The La ions are not visible in the energy windows below eV, because the La -orbitals are more localized than the boron lone pairs. In addition, the nodal structures of the La -orbitals lead to a reduced density above the La ion in the range of the characteristic peak. This changes for the energy window above the characteristic peak at eV: in the energy range from eV to eV, the La -orbitals pointing out of the surface contribute largely to the LDOS with the La -orbitals providing an additional share. Hence the intensity is largest on top of the La positions.
In order to extract the local spectral information, which is provided by the scanning tunneling spectroscopy, we introduced so-called empty atoms above the surface. These atoms do not change the physics of the system, but they are a technical trick, that allows us to extract the LDOS in the vacuum region. The empty atoms provide local orbitals onto which the wave functions are projected to obtain the projected DOS.
The LDOS projected onto layers of empty atoms is shown in Fig. 9. The characteristic peak of the boron dangling bonds below the Fermi level is very prominent. In addition we find a second peak at eV. As seen in Fig. 7, this peak is due to the -orbitals pointing out of the surface. At higher energies, in addition to the -orbitals, the -orbitals start to contribute to the LDOS.
Above the peak at eV, the LDOS rises sharply. The rise of the DOS at higher energies can be attributed to two reasons: Firstly, in this energy window the lanthanum ion has a large DOS due to - and -electrons. Secondly, wave functions at higher energies extend further out into the vacuum, because of their larger kinetic energy.
By comparing the LDOS at different distances, we find that the intensity of the dangling bond peak decreases faster with increasing distance than the intensity of the LDOS above the Fermi energy. This can be seen in Fig. 9.
IV Discussion
By investigating the lanthanum hexaboride (001)-cleavage plane in UHV condition, we observed a chain-like (21) reconstruction. Our STM experiments show that these chains are mostly labyrinth-like arranged and the number of parallel chains barely exceeds three or four. The most ordered (21) reconstruction with a larger number of parallel chains can be found in the vicinity of step edges, where the chains tend to be ordered perpendicularly to the step edge. At a step edge which was rotated by 90∘, we observed the respective (12) reconstruction. Following these arguments, the observed (12) spots in the ULEED are likely caused by a step structure which was rotated by 90∘. This supports the assumption that the reconstruction aligns preferentially perpendicularly to step edges.
The atomic surface structure of the (21) reconstruction has been proposed as parallel lanthanum chains with a spacing of two lattice constants on top of a full B6 layer Schmidt et al. (2018). Our DFT slab simulations of this lanthanum chain-terminated surface show that the electronic structure slightly below is governed by a surface resonance. The orbital projected DOS reveals that the surface resonance is mainly composed of boron -hybrid dangling bonds pointing out of the surface. In contrast, in the unoccupied states, La -orbitals are predominant. In comparison to the boron surface states, these orbitals show a slower decay and extend further into the vacuum.
Our simulated STM images provide a translation of these results to the language of CCT images recorded by STM experiments. On the one hand, the dominant contribution of the La -orbitals to the LDOS at leads to well separated chain-like structures above the surface. This is in good agreement with our experimental CCT images, which were taken at a positive bias voltages. Hence, at positive bias voltage, the STM addresses mainly the -orbitals. On the other hand, at or negative sample bias voltage, respectively, our theoretical results predict tunneling predominantly from the boron lone pairs to the STM tip. This is difficult to realize experimentally, since we find rather unstable tunneling conditions for negative bias voltages. Hence, imaging the surface at negative bias voltages remains an open task.
The presence of a spectral feature below is, however, verified by our STS measurements. In the tunneling spectra we find the surface resonance at eV and a parabola-shaped tunneling conductance around . Experimentally, an additional feature is found at 0.1 eV. These features would coincide with the calculated DOS if was shifted by eV in the calculated DOS. We tested the dependence of the surface resonance position on the density functional by doing additional calculations with the PBE functional, i. e. without Hartree-Fock contribution. The peak position does not change. This can be rationalized from the nature of the state, which is mostly boron-like and has little La and no La contribution.
Although the investigated (21) structure is far from pristine and exhibits numerous kinks and defects, one can exclude that the surface resonance position depends on the presence of surface defects. Experimentally we do not observe a shift of the surface resonance regardless of the local surface morphology, as seen in Fig. 12. Furthermore, the main features of the experimental tunneling spectra can be clearly identified in our DFT results on the defect-free surface.
A small shift in the chemical potential, which may explain the relative shift of 0.4 eV between experimental and theoretical spectra, could originate from a non-stoichiometric crystal. During crystal growth, preferential evaporation of boron atoms leaves the formed crystal slightly boron deficient Otani et al. (2002). Thus, the substance ratio La/B can be somewhat larger than the stoichiometric 1/6. For the present sample, the extra lanthanum atoms would lead to a surplus of charge carriers, shifting the Fermi level to higher energies.
The measured apparent barrier height is rather small with values in the range from 1 eV to 3 eV. This is in agreement with the low work function of about 2.5 eV obtained in former studies Trenary (2012).
Moreover, the knowledge that the (21) reconstruction consists of lanthanum chains can be used to assign the termination of atomic steps. A step between two (21) reconstructed areas should be of integer multiple height of the bulk lattice constant, since the termination is equal on each side. Such steps have been observed. For the area shown in the left of Fig. 11, the step height is smaller than one bulk lattice constant. Here, we suggest a boron-rich termination with an almost vacant lanthanum layer at the surface. However, we would like to point out that this is one of the very few steps of that height we have found so far.
The surface morphology observed in this study is different to that of previous UHV STM investigations of LaB6 Ozcomert and Trenary (1992a, b). In these studies, a (11) reconstructed (001)-surface was found, which is stated to be lanthanum terminated and about 10% of the surface’s lanthanum sites are vacant. However, it should be noted that the samples used in these studies are prepared by polishing and heating instead of cleavage as in our study, which likely leads to the different surface structures observed. Our structural results are more comparable to the findings on the cleaved surface of SmB6. For cleaved SmB6, surface step heights are only of integer multiples of the bulk lattice constant if the terminations on both sides are of the same kind M. Yee et al. (2013), as observed in this study as well. Cleavage of SmB6 can take place by breaking either the bonds within the boron octahedra or the bonds between the octahedra. Hence, it is lacking a natural cleavage plane Sun et al. (2018); Ruan et al. (2014); Matt et al. (2018), and atomically ordered areas occur rather infrequently M. Yee et al. (2013); Jiao et al. (2018). Since LaB6 has the same crystal structure, no natural cleavage plane is present. This might be the reason for the mostly disordered surfaces we have observed so far. Similarly to our observations, LEED investigations on cleaved SmB6 samples show only (21) spots on certain surface areas and the diffraction pattern is governed by (11) spots Ramankutty et al. (2016). Therefore, the (11) spots have been associated with the bulk periodicity due to the finite penetration depth of the electrons. Same arguments should be applied for our sample system to explain the dominant (11) spots.
V Conclusion
In a combined study of STM/STS, LEED and DFT we have investigated the (001)-cleavage plane of LaB6. Atomically ordered areas are labyrinth-like (21) reconstructed. These chains can be understood as parallel rows of lanthanum atoms on top of a B6 layer, with a surface resonance below . Electronically, this resonance is mainly composed of B -hybrid orbitals and La -states originating from the surface atoms. Lanthanum hexaboride is the electronically most simple candidate of the REB6 family. However, understanding the electronic surface structure is not straightforward and differs severely from that of the bulk. Moreover, the LaB6 surface morphology is more complex than previously discussed. Since all REB6 have the same crystal structure, our findings could help to further understand the general surface physics of hexaborides.
Acknowledgements.
We acknowledge fruitful discussions with S. R. Manmana. The orientation of the single crystals via gamma ray diffraction were carried out in the group of G. Eckold by F. Ziegler and P. Kirscht at the Institut für Physikalische Chemie, University of Göttingen. We gratefully acknowledge financial support by the DFG grants WE1889/10-1, BL539/10-1 and PR298/19-1. Furthermore, we acknowledge financial support by the SFB 1073 through the projects B03, C03 and C04. Additionally, this work was funded by the European Research Council (ERC Starting Grant ‘ULEED’, ID: 639119). The work at the University of Warwick was supported by the EPSRC, UK, through Grant EP/M028771/1. The images in Fig. 1, Fig. 14 and Fig. 15 were created with VESTA Momma and Izumi (2011).F. Sohn and P. Buchsteiner contributed equally to this work.
appendix
.1 Supporting experimental data
Fig. 10 (a) shows a typical large scale topography of the cleaved LaB6 (001)-surface as observed with AFM. Flat terraces within the AFM resolution with areas of several hundred (nm)2 up to (m)2 in size can be easily found. These areas are connected by steps of integer multiples of the bulk lattice constant of 4.15 Å Stackelberg and Neumann (1932); Guo-Liang et al. (2009); Booth et al. (2001); Sirota et al. (1998); Gürel and Eryiğit (2010); Hossain et al. (2005); Schmidt et al. (2018). The steps in Fig. 10 (a) are all of a height of one lattice constant. However, on a smaller length scale probed by STM, up to nanometer-sized protrusions with no pristine long-range order are commonly observed, Fig. 10 (b). This results are similar to the STM findings on cleaved SmB6 M. Yee et al. (2013).
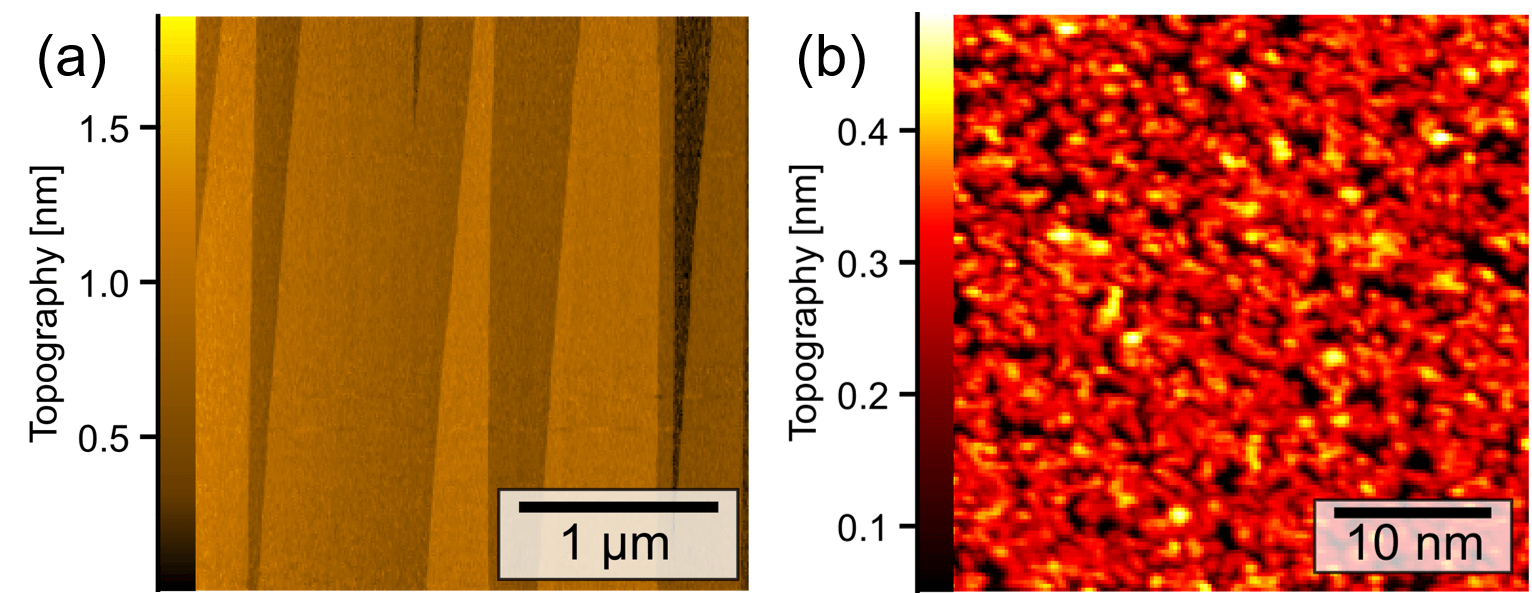
As described in the discussion above, LaB6 is lacking a natural cleavage plane. If the cleavage leaves the boron cage intact, one dangling bond per octahedron is exposed. The situation changes dramatically, if the cleavage proceeds through the octahedron. The disrupted boron cages expose numerous dangling bonds, which might increase the probability of attaching adsorbates like hydrogen Schmidt et al. (2019). Another reason for a frequently observed disordered morphology might be that the crystals were cleaved at room temperature. For SmB6 it is reported, that atomically flat surfaces could not be obtained by cleavage at room temperature, but only at about 20 K Rößler et al. (2016). Our present setup does not allow the cleavage at cryogenic temperature. An additional experimental reason for the widely disordered appearance might be the tip itself. As seen in Fig. 2, even when atomic chains can be resolved, they are mostly labyrinth-like arranged. If the same area would have been scanned with a slightly blunt tip, the topography certainly would appear rather disordered, too.
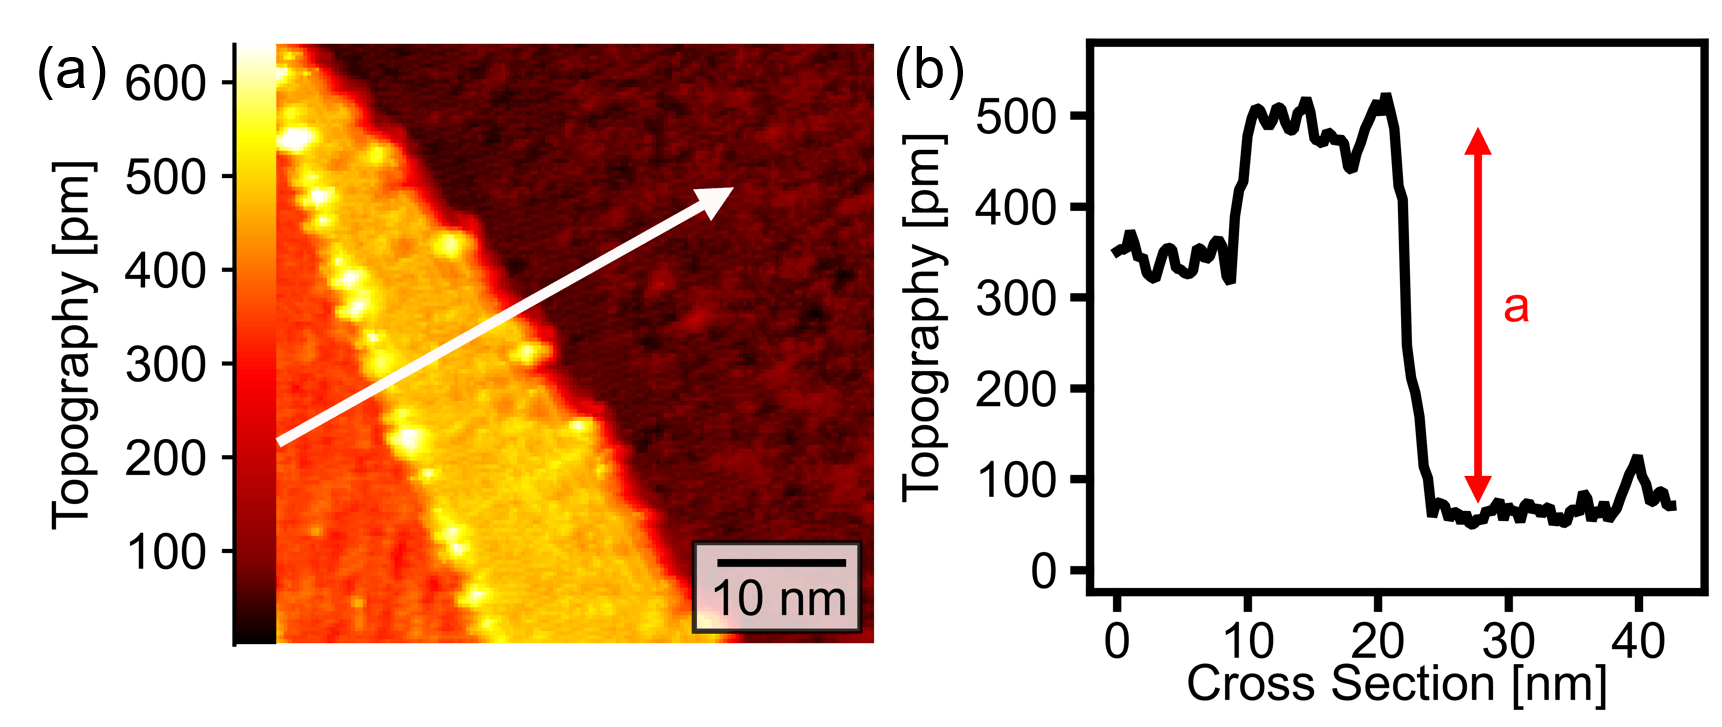
We have found a step with a height of only a fraction of the bulk lattice constant, which is shown in Fig. 11. On the right hand side the already discussed (21) labyrinth-like structure is observed and the step height is again one bulk lattice constant. Interestingly, the step on the left hand side is only about 1.3 Å high. We interpret this finding as a different surface termination, as described in the discussion above.
Fig. 12 shows the spectroscopy of Fig. 5 again, but here including the measured apparent barrier height and another dd cross section. The mean value of the -map is (1.05 0.17) eV. However, the specific value of the apparent barrier height is correlated with the topography. At the atomic protrusion, blue-marked position in Fig. 5 (a), its value is about 1.1 eV and at the green-marked position 1.0 eV. For the various surface areas with no clear atomic rows included, the value of varies for each tip position.
Fig. 13 shows the second spectroscopy data set, including the CCT, the -map and a dd cross section after topography normalization. In this bias voltage range, the dd curves have their largest values on top of the reconstruction’s protrusion.
.2 Additional detail on the DFT simulations
A scheme of a simulated slab and its (21) surface unit cell is depicted in Fig. 14.
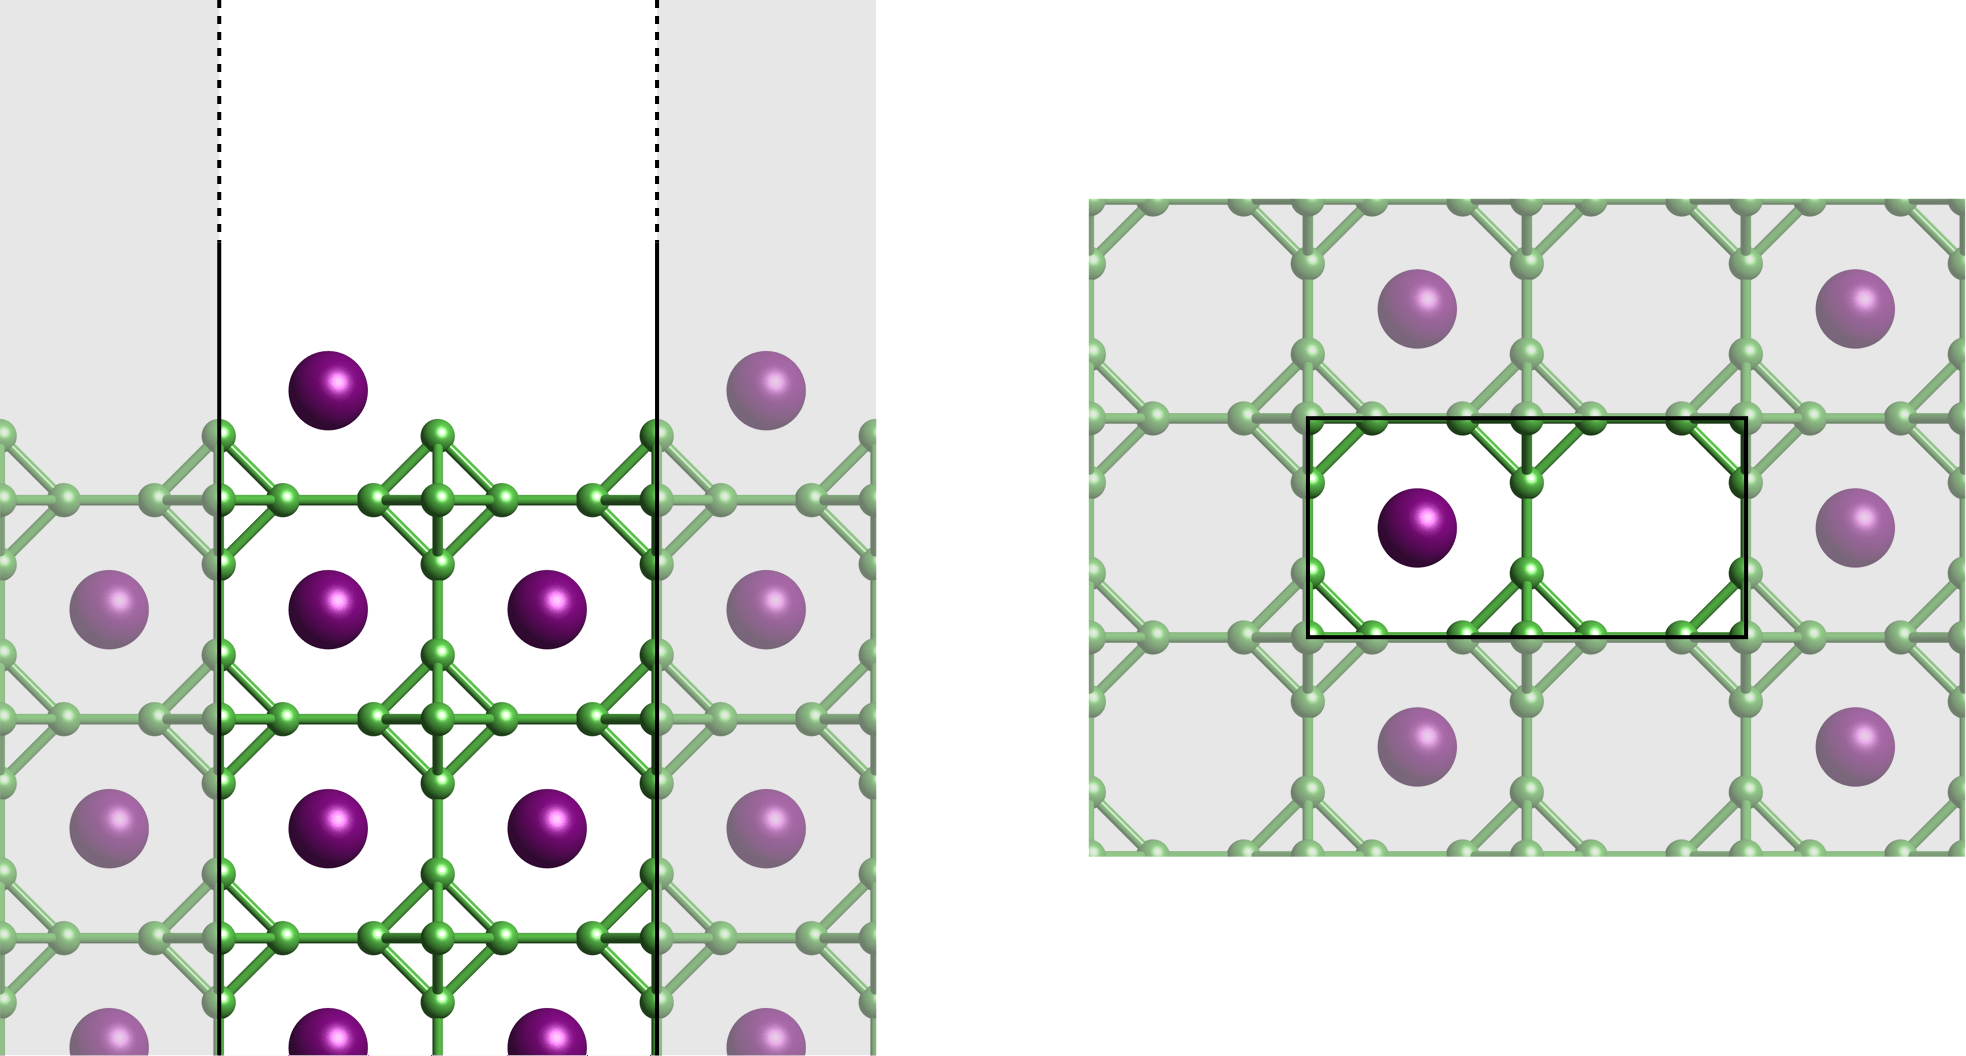
The lattice constant was kept fixed at a value of Å found in former experimental and theoretical studies Stackelberg and Neumann (1932); Guo-Liang et al. (2009); Booth et al. (2001); Sirota et al. (1998); Gürel and Eryiğit (2010); Hossain et al. (2005); Schmidt et al. (2018). The vacuum thickness between the slabs was set to Å. In order to avoid artifacts and to have a sufficiently large spatial separation of the slab’s top and bottom surfaces and surface states, respectively, a minimum slab thickness of three layers of boron octahedra is required. For our simulations, we used surface supercells with three, five and seven layers of boron octahedra. This was done in order to ensure convergence of our DFT data with respect to the slab thickness. In this work, we present results from our simulations with the seven-layer slab unit cell only. However, all slab thicknesses lead to similar results in atomic structure as well as electronic structure.
Moreover, we used a total amount of 841 -points. The plane wave cut-offs were set to 50 Ry for the wave functions and to 100 Ry for the charge density. Furthermore, we used (2,2,2,1) projector functions for the La (, , , )-states and (2,2,1) projector functions for the B (, , )-states, respectively. The hybrid functional mixing factor was fixed at 0.15 for both atomic species.
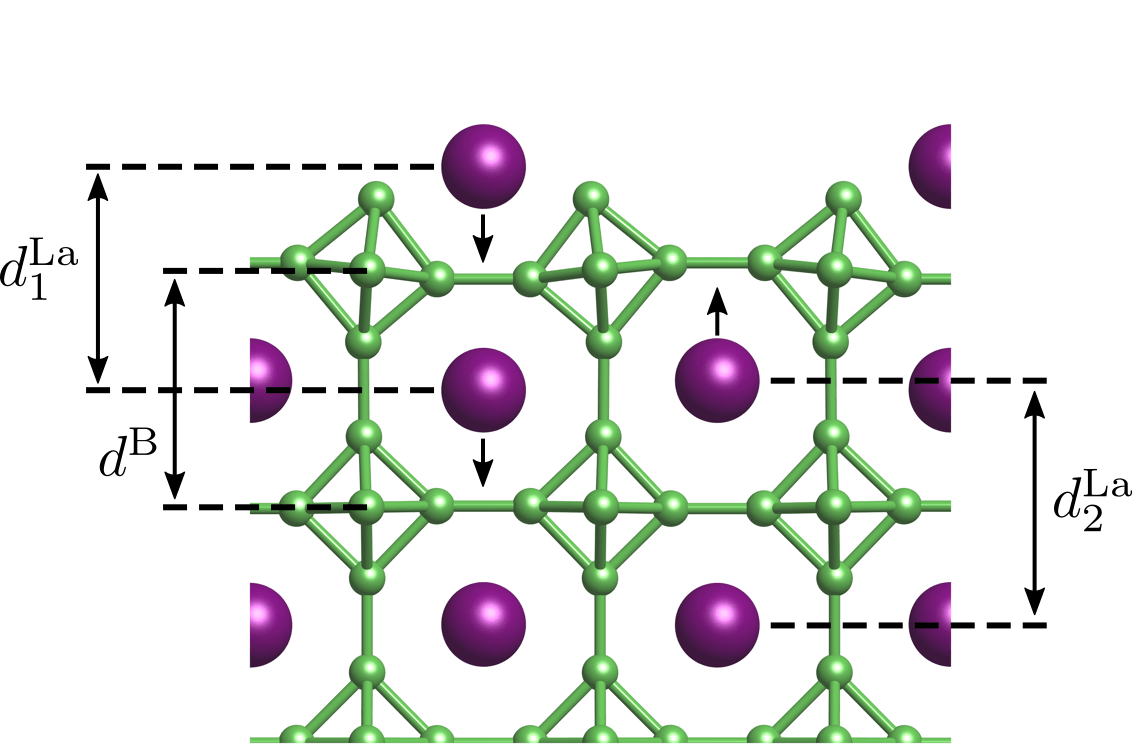
In Fig. 15 we show the side view of the relaxed surface structure, which exhibits a tilt of the surface octahedra towards the filled chain of La ions. This can be rationalized by the attraction between positive La and negative B ions: the terminating boron atoms have lone-pairs pointing out of the surface, which hybridize with the La -orbitals lying in the surface plane (cf. Fig. 7 and discussion in Section III.3).
Furthermore, the surface relaxation leads to changes in the distance between two layers which can be quantified via the relative change to the bulk lattice constant , i. e.,
| (2) |
The surface La-ion relaxes inward by % relative to the bulk, while the subsurface La-ion below the empty La-surface site relaxes outward by %. The boron octahedra exhibit a small outward relaxation of %. A comparison of these quantities between the data from the seven-B6-layer slab to the data of the five-B6-layer slab shows only minor differences which amount up to 0.007 Å in absolute values, which is negligible in the context of our calculations. Hence, we expect no significant difference in the DFT results for even larger slab thicknesses. Previous data published by Schmidt et al. (2018) are %, %, and %, respectively. In comparison, the distances in our data are consistently a bit longer.
In Fig. 16, we provide two additional projections of the DOS: a projection onto the orbitals of the topmost atoms of either species, and a projection onto the boron dangling bonds.
References
- Takase et al. (1980) A. Takase, K. Kojima, T. Komatsubara, and T. Kasuya, Solid State Commun. 36, 461 (1980).
- Geballe et al. (1968) T. H. Geballe, B. T. Matthias, K. Andres, J. P. Maita, A. S. Cooper, and E. Corenzwit, Science 160, 1443 (1968).
- Kasuya (1994) T. Kasuya, Europhys. Lett. 26, 277 (1994).
- Souma et al. (2002) S. Souma, H. Kumigashira, T. Ito, T. Takahashi, and S. Kunii, Physica B 312-313, 329 (2002).
- Pohlit et al. (2018) M. Pohlit, S. Rößler, Y. Ohno, H. Ohno, S. von Molnár, Z. Fisk, J. Müller, and S. Wirth, Phys. Rev. Lett. 120, 257201 (2018).
- Neupane et al. (2015) M. Neupane, S.-Y. Xu, N. Alidoust, G. Bian, D. J. Kim, C. Liu, I. Belopolski, T.-R. Chang, H.-T. Jeng, T. Durakiewicz, H. Lin, A. Bansil, Z. Fisk, and M. Z. Hasan, Phys. Rev. Lett. 114, 016403 (2015).
- Longuet-Higgins and M. De V. Roberts (1954) H. C. Longuet-Higgins and M. De V. Roberts, Proc. R. Soc. London, Ser. A 224, 336 (1954).
- Trenary (2012) M. Trenary, Sci. Technol. Adv. Mater. 13, 023002 (2012).
- Sani et al. (2017) E. Sani, L. Mercatelli, M. Meucci, L. Zoli, and D. Sciti, Sci. Rep. 7, 718 (2017).
- Mattox and Urban (2018) T. M. Mattox and J. J. Urban, Materials 11, 2473 (2018).
- Oshima et al. (1977) C. Oshima, E. Bannai, T. Tanaka, and S. Kawai, J. Appl. Phys. 48, 3925 (1977).
- Aono et al. (1978) M. Aono, C. Oshima, T. Tanaka, E. Bannai, and S. Kawai, J. Appl. Phys. 49, 2761 (1978).
- Aono et al. (1979) M. Aono, R. Nishitani, C. Oshima, T. Tanaka, E. Bannai, and S. Kawai, Surf. Sci. 86, 631 (1979).
- Swanson and McNeely (1979) L. W. Swanson and D. R. McNeely, Surf. Sci. 83, 11 (1979).
- Swanson and Dickinson (1976) L. W. Swanson and T. Dickinson, Appl. Phys. Lett. 28, 578 (1976).
- Chambers and Swanson (1983) S. A. Chambers and L. W. Swanson, Surf. Sci. 131, 385 (1983).
- Goldstein and Szostak (1978) B. Goldstein and D. J. Szostak, Surf. Sci. 74, 461 (1978).
- Ozcomert and Trenary (1992a) J. S. Ozcomert and M. Trenary, Surf. Sci. 265, L227 (1992a).
- Ozcomert and Trenary (1992b) J. S. Ozcomert and M. Trenary, J. Vac. Sci. Technol., A 10, 2581 (1992b).
- Schmidt et al. (2018) K. M. Schmidt, O. Jaime, J. T. Cahill, D. Edwards, S. T. Misture, O. A. Graeve, and V. R. Vasquez, Acta Mater. 144, 187 (2018).
- Balakrishnan et al. (2003) G. Balakrishnan, M. R. Lees, and D. McK. Paul, J. Cryst. Growth 256, 206 (2003).
- Balakrishnan et al. (2004) G. Balakrishnan, M. R. Lees, and D. McK. Paul, J. Magn. Magn. Mater. 272-276, 601 (2004).
- Vogelgesang et al. (2018) S. Vogelgesang, G. Storeck, J. G. Horstmann, T. Diekmann, M. Sivis, S. Schramm, K. Rossnagel, S. Schäfer, and C. Ropers, Nat. Phys. 14, 184 (2018).
- Hohenberg and Kohn (1964) P. Hohenberg and W. Kohn, Phys. Rev. 136, B864 (1964).
- Kohn and Sham (1965) W. Kohn and L. J. Sham, Phys. Rev. 140, A1133 (1965).
- (26) CP-PAW website, https://www2.pt.tu-clausthal.de/paw/.
- Blöchl (1994) P. E. Blöchl, Phys. Rev. B 50, 17953 (1994).
- Car and Parrinello (1985) R. Car and M. Parrinello, Phys. Rev. Lett. 55, 2471 (1985).
- Sotoudeh et al. (2017) M. Sotoudeh, S. Rajpurohit, P. Blöchl, D. Mierwaldt, J. Norpoth, V. Roddatis, S. Mildner, B. Kressdorf, B. Ifland, and C. Jooss, Phys. Rev. B 95, 235150 (2017).
- Perdew et al. (1996) J. P. Perdew, K. Burke, and M. Ernzerhof, Phys. Rev. Lett. 77, 3865 (1996).
- Tersoff and Hamann (1983) J. Tersoff and D. R. Hamann, Phys. Rev. Lett. 50, 1998 (1983).
- Tersoff and Hamann (1985) J. Tersoff and D. R. Hamann, Phys. Rev. B 31, 805 (1985).
- Garleff et al. (2004) J. K. Garleff, M. Wenderoth, K. Sauthoff, R. G. Ulbrich, and M. Rohlfing, Phys. Rev. B 70, 245424 (2004).
- Chen (2008) C. J. Chen, Introduction to Scanning Tunneling Microscopy, 2nd ed. (Oxford University Press, New York, 2008).
- Uijttewaal et al. (2006) M. A. Uijttewaal, G. A. de Wijs, and R. A. de Groot, J. Phys. Chem. B 110, 18459 (2006).
- Ivashchenko et al. (2018) V. I. Ivashchenko, P. E. A. Turchi, V. I. Shevchenko, N. R. Medukh, J. Leszczynski, and L. Gorb, Physica B 531, 216 (2018).
- Bardeen (1961) J. Bardeen, Phys. Rev. Lett. 6, 57 (1961).
- Otani et al. (2002) S. Otani, T. Aizawa, and Y. Yajima, J. Cryst. Growth 234, 431 (2002).
- M. Yee et al. (2013) M. M. Yee, Y. He, A. Soumyanarayanan, D.-J. Kim, Z. Fisk, and J. E. Hoffman, arXiv:1308.1085v2 (2013).
- Sun et al. (2018) Z. Sun, A. Maldonado, W. S. Paz, D. S. Inosov, A. P. Schnyder, J. J. Palacios, N. Y. Shitsevalova, V. B. Filipov, and P. Wahl, Phys. Rev. B 97, 235107 (2018).
- Ruan et al. (2014) W. Ruan, C. Ye, M. Guo, F. Chen, X. Chen, G.-M. Zhang, and Y. Wang, Phys. Rev. Lett. 112, 136401 (2014).
- Matt et al. (2018) C. E. Matt, H. Pirie, A. Soumyanarayanan, M. M. Yee, Y. He, D. T. Larson, W. S. Paz, J. J. Palacios, M. H. Hamidian, and J. E. Hoffman, arXiv:1810.13442v1 (2018).
- Jiao et al. (2018) L. Jiao, S. Rößler, D. Kasinathan, P. F. S. Rosa, C. Guo, H. Yuan, C.-X. Liu, Z. Fisk, F. Steglich, and S. Wirth, Sci. Adv. 4, eaau4886 (2018).
- Ramankutty et al. (2016) S. V. Ramankutty, N. de Jong, Y. K. Huang, B. Zwartsenberg, F. Massee, T. V. Bay, M. S. Golden, and E. Frantzeskakis, J. Electron. Spectrosc. Relat. Phenom. 208, 43 (2016).
- Momma and Izumi (2011) K. Momma and F. Izumi, J. Appl. Crystallogr. 44, 1272 (2011).
- Stackelberg and Neumann (1932) M. v. Stackelberg and F. Neumann, Z. Phys. Chem. 19B, 314 (1932).
- Guo-Liang et al. (2009) X. Guo-Liang, C. Jing-Dong, X. Yao-Zheng, L. Xue-Feng, L. Yu-Fang, and Z. Xian-Zhou, Chin. Phys. Lett. 26, 056201 (2009).
- Booth et al. (2001) C. H. Booth, J. L. Sarrao, M. F. Hundley, A. L. Cornelius, G. H. Kwei, A. Bianchi, Z. Fisk, and J. M. Lawrence, Phys. Rev. B 63, 224302 (2001).
- Sirota et al. (1998) N. N. Sirota, V. V. Novikov, V. A. Vinokurov, and Paderno, Yu. B., Phys. Solid State 40, 1856 (1998).
- Gürel and Eryiğit (2010) T. Gürel and R. Eryiğit, Phys. Rev. B 82, 104302 (2010).
- Hossain et al. (2005) F. M. Hossain, D. P. Riley, and G. E. Murch, Phys. Rev. B 72, 235101 (2005).
- Schmidt et al. (2019) K. M. Schmidt, S. T. Misture, O. A. Graeve, and V. R. Vasquez, ACS Omega 4, 65 (2019).
- Rößler et al. (2016) S. Rößler, L. Jiao, D. J. Kim, S. Seiro, K. Rasim, F. Steglich, L. H. Tjeng, Z. Fisk, and S. Wirth, Philos. Mag. 96, 3262 (2016).