GK Car and GZ Nor: Two low-luminous, depleted
RV Tauri stars
Abstract
We performed a photometric and spectroscopic analysis of two RV Tauri stars GK Car and GZ Nor. Both objects are surrounded by hot circumstellar dust. Their pulsation periods, derived from ASAS photometric time series, have been used to derive their luminosities and distances via the PLC relation. In addition, for both objects, GAIA distances are available. The Gaia distances and luminosities are consistent with the values obtained from the PLC relationship. GK Car is at distance of 4.5 kpc and has a luminosity of 1520 L⊙, while GZ Nor is at distance of 8.4 kpc and has a luminosity of 1240 L⊙. Our abundance analysis reveals that both stars show depletion of refractory elements with [Fe/H]=1.3 and [Zn/Ti]=1.2 for GK Car and [Fe/H]=2.0 and [Zn/Ti]=0.8 for GZ Nor. In the WISE colour-colour diagram, GK Car is located in the RV Tauri box as originally defined by Lloyd Evans (1985) and updated by Gezer et al. (2015), while GZ Nor is not. Despite this, we argue that both objects are surrounded by a gravitationally bound disc. As depletion is observed in binaries, we postulate that both stars are binaries as well. RV Tauri stars are generally acknowledged to be postAGB stars. Recent studies show that they might be either indeed postAGB or postRGB objects depending on their luminosity. For both objects, the derived luminosities are relatively low for post-AGB objects, however, the uncertainties are quite large. We conclude that they could be either post-RGB or post-AGB objects.
keywords:
stars: abundances – stars: AGB and post-AGB – stars: evolution – stars: individual: GK Car – stars: individual: GZ Nor – stars: individual: RV Tauri1 Introduction
RV Tauri stars are population II Cepheid variables with spectral types typically between F and K. There are 126 RV Tauri stars known in the Galaxy (see GCVS Samus et al. (2009)) and many of them have been discovered in the Small Magellanic Cloud (SMC) and Large Magellanic Cloud (LMC) (Alcock et al., 1998; Soszyński et al., 2008; Buchler et al., 2009; Soszyñski et al., 2010). They owe their name to the prototype RV Tau. A defining characteristic of RV Tauri stars is the presence of subsequent deep and shallow minima in their light curves (e.g. Pollard et al., 1997). The period between two successive deep minima is called the “formal” period and lies in the range 20-150 days. The period between a deep and shallow minimum is typically half of the formal period and is called the “fundamental” period (Soszyński et al., 2008; Soszyñski et al., 2010). There are several hypotheses for their pulsation mechanism (Tuchman et al., 1993). Non-linear, non-adiabatic hydrodynamical RV Tauri models show that the alternating minima in the light curves might be explained with double mode pulsations between the fundamental mode and the first overtone (Fokin, 1994). In addition, it can also be explained using chaotic systems (Buchler & Kovacs, 1987).
IRAS (Infrared Astronomical Satellite 1983) detected several RV Tauri stars which show large infrared excesses (IR) due to thermal emission from dust. On the basis of this finding, RV Tauri stars were classified as post-Asymptotic Giant Branch (postAGB) objects by Jura (1986). As post-AGB stars, they are expected to display AGB nucleosynthesis products, which are mostly C and process elements. However, most RV Tauri stars that have been chemically studied to date show no traces of C and process enhancements, with the exceptions of HD 158616 (Van Winckel, 1997), MACHO 47.2496.8 (Reyniers et al., 2007) and SMCT2CEP018 (SMC J005107.19734133.3) (Kamath et al., 2014). Instead, RV Tauri stars show often a chemical anomaly which is called “depletion” (e.g. Giridhar et al., 1994; Giridhar et al., 1998, 2000; Gonzalez et al., 1997b, a; Van Winckel et al., 1998; Maas et al., 2002; Maas et al., 2003, 2005; Deroo et al., 2005; Gezer et al., 2015). In a depleted photosphere, refractory elements, which have high dust condensation temperature, are underabundant, while volatiles, which has low dust condensation temperature, are more abundant (e.g. Van Winckel, 2003). It is assumed that the dust formation causes chemical fractionation in the circumstellar environment and the radiation pressure on dust grains separates the dust from the gas. The cleaned gas is re-accreted onto the stellar surface. Such a process seems to occur only in a stable circumstellar disc (Waters et al., 1992). The most characteristic chemical signatures of depleted photospheres are high [Zn/Fe], [Zn/Ti] and [S/Ti] ratios, which are used to identify a photosphere to be depleted or not (Gezer et al., 2015).
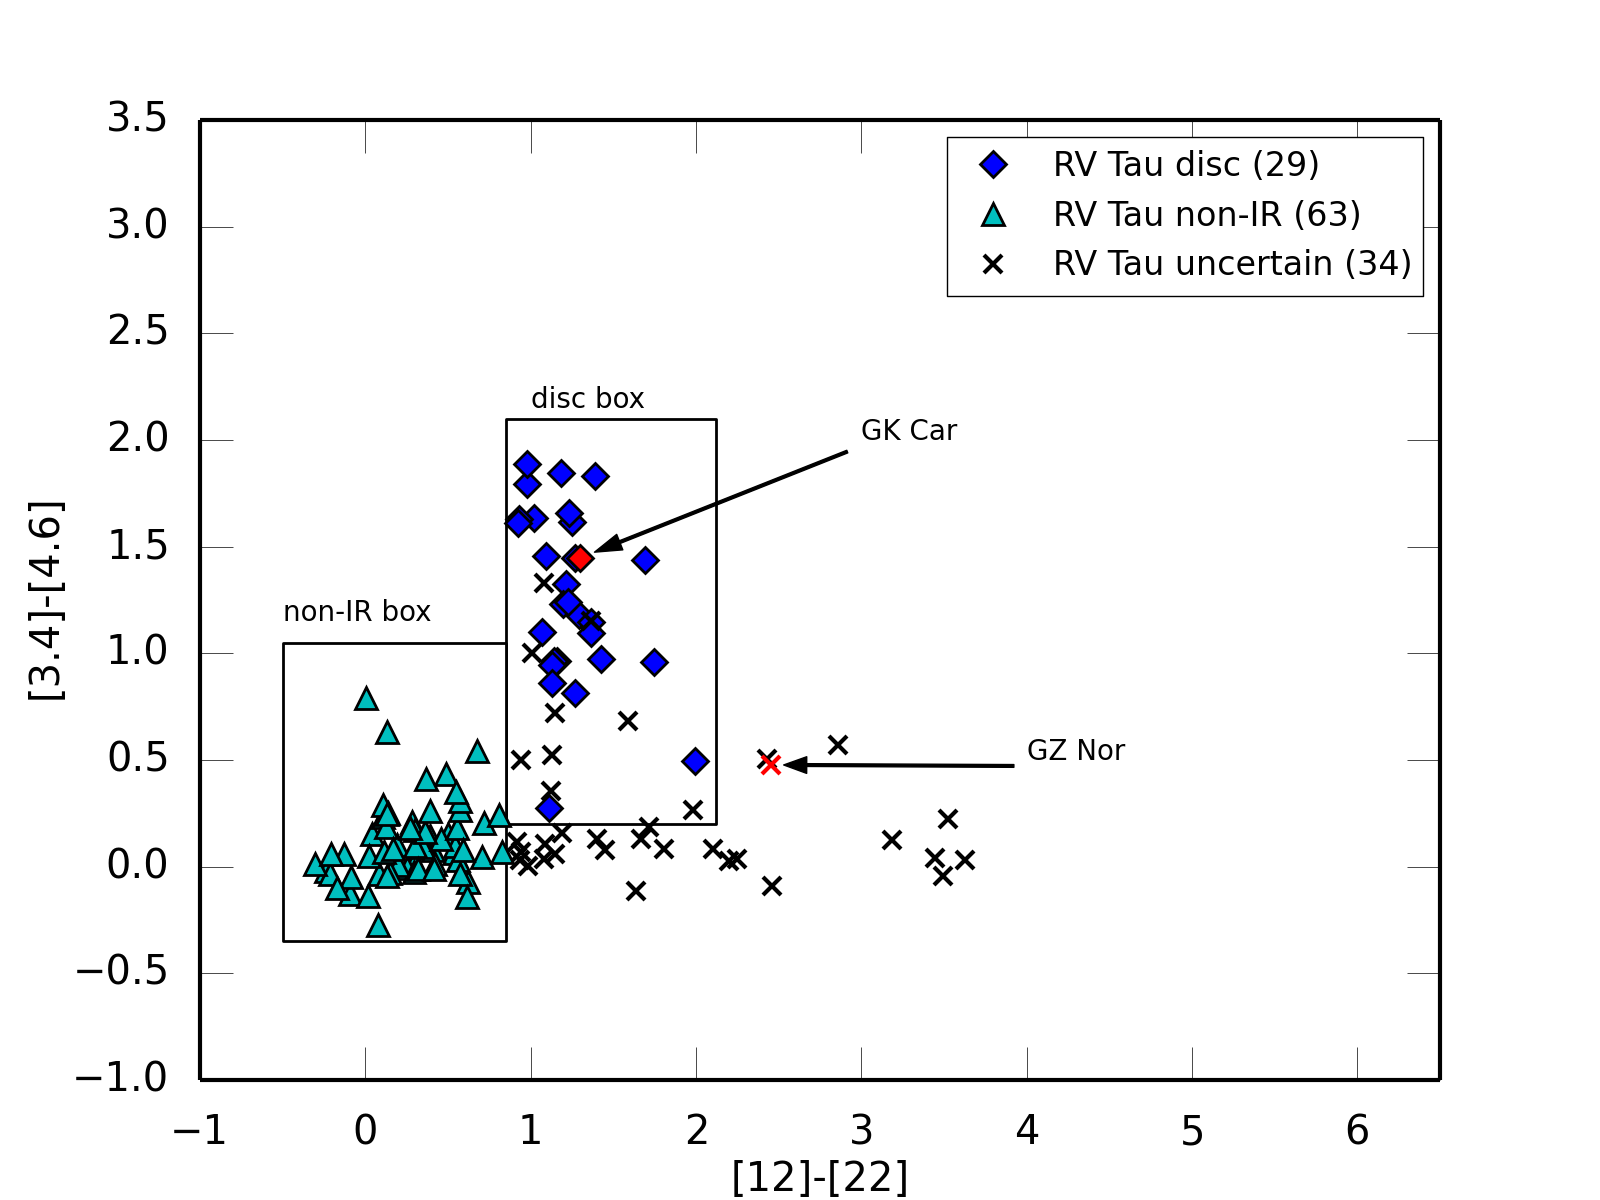
Lloyd Evans (1985) showed that IR colours of RV Tauri stars occupy a specific region in the IRAS [12]-[25], [25]-[60] diagram and he defined this region as the RV Tauri box. In our first paper (see Gezer et al. (2015), hereafter Paper I), we have expanded his study using WISE (Wide-Field Infrared Survey) data, which is similar to IRAS but deep enough to detect all Galactic RV Tauri stars. We defined a new WISE colour combination as [3.4]-[4.6] versus [12]-[22], which is a good WISE alternative of IRAS colour-colour diagram. We also performed a detailed spectral energy distribution (SED) analysis for all Galactic RV Tauri stars and showed that they display three different types of SED characteristics; disc, non-IR and uncertain types. This classification is shown in Fig. 1. A disc source displays a very distinctive SED with the IR-excess starting in the near-IR region and peaking around 10 m. This type of SED is a clear indication of the presence of a stable compact dusty disc (de Ruyter et al., 2006; Deroo et al., 2006; Deroo et al., 2007; Gielen et al., 2011; Hillen et al., 2015). Disc-type SEDs occupy a specific region in the WISE colour-colour diagram and this region is equivalent to the RV Tauri box defined by Lloyd Evans (1985) in the IRAS colour-colour diagram. Thus, we slightly redefined the RV Tauri box as a disc box in the WISE colour-colour diagram. RV Tauri stars which do not show any infrared excess, cluster around the zero-point of the diagram, and we define this region as the non-IR box. For the remaining RV Tauri stars, the full SED is not clear, which is likely because of the large amplitude pulsations or/and a poor photometric sampling. Besides, these sources are mostly located outside of the disc and non-IR boxes in the WISE colour-colour diagram. Therefore, we classify these sources as uncertain.
Recently, Manick et al. (2018) also showed that the SMC and LMC RV Tauri stars display similar IR characteristics as their Galactic counterparts. The authors performed a systematic study of RV Tauri stars in the SMC/LMC and they yield their luminosities using the known distance to the Magellanic Clouds. They also interpret the evolutionary nature of RV Tauri stars using their luminosities. Objects which display disc-type SEDs are very likely binaries and they have a wide range of luminosities. Luminous binaries are likely postAGB objects while the low luminous ones are probably post-red giant branch (post-RGB) objects. Post-RGB objects are a new class of dusty objects discovered in SMC/LMC surveys (Kamath et al., 2014, 2015). These objects are similar to postAGB objects in terms of their stellar parameters and infrared excess, except that they display lower luminosities (100-2500 L⊙) than postAGB stars. These stars very likely evolve off the RGB because of a strong binary interaction process already occurring on the RGB (Kamath et al., 2016).
In this paper, we selected two as yet poorly studied RV Tauri stars which have different SED characteristics and locations in the WISE colour-colour diagram. The one is a disc source GK Car which is located in the disc box and another one is GZ Nor which is outside of the disc box and defined as uncertain. Their positions in the WISE colour-colour diagram are shown in Fig. 1. The outline of the paper is as follows: Photometric and spectroscopic data and SEDs are presented in Section 2. Section 3 describes the photometric analysis including the pulsations and determination of luminosity and distance based on two methods; the Period-Luminosity-Distance (PLC) relationship and GAIA. Determination of atmospheric parameters and abundance analysis of the stars are presented in Section 4. In Section 5 conclusions are summarized.
2 Data
Basic parameters, WISE colours and SED types of the stars are given in Table 2.
| Name | R.A. | ||||||
| Decl. | |||||||
| l | b | [12][22] | [3.4][4.6] | SED | |||
| GK Car | 11 14 01.61 | 57 43 15 | 290.1955 | 02.7218 | 1.301 | 1.448 | Disc |
| GZ Nor | 16 31 54.15 | 55 33 07 | 330.6957 | 05.0546 | 2.453 | 0.477 | Uncertain |
2.1 Photometric data
2.1.1 ASAS photometry
We used data from the All Sky Automated Survey (ASAS, Pojmanski (2002)) for the photometric analysis of GK Car and GZ Nor. ASAS itself is an ongoing project to detect any kind of photometric variability and produce extensive catalogues of variable stars (ACVS) by monitoring the large area of the sky with fully automated instruments. The prototype of the project was first operated in 1996 at the Warsaw University Astronomical Observatory. Now, it carries on with three fully automatic instruments having and filters attached to 2K and 4K CCD cameras at Las Campanas Observatory in Chile and at Mt. Haleakala Observatory in Maui, Hawaii. Through the project, nearly 20 million stars which are optically brighter than 14 magnitudes have been observed so far. The photometric accuracy is about 0.05 mag.
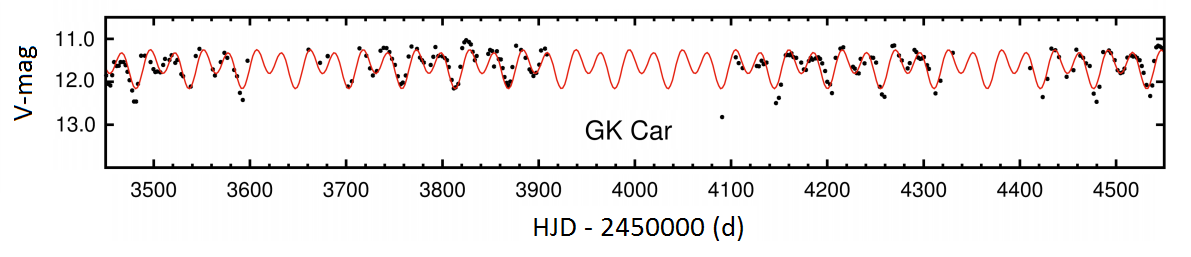
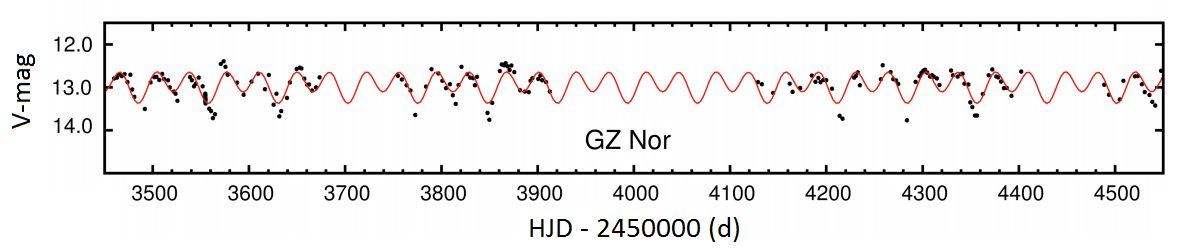
The public domain data were taken from the AASC111http://www.astrouw.edu.pl/asas/?page=acvs and ACVS222http://www.astrouw.edu.pl/asas/?page=aasc websites. For both stars, we use the ASAS-3 configuration with a wide-field 2Kx2K CCD camera. ASAS is currently using 5 different sizes for the aperture photometry, which ranges from 2 pixels to 6 pixels and recommends using an aperture size according to the V-magnitude of the star. We used the smallest, 2 pixels wide aperture size, which is recommended by the ASAS guidelines for stars fainter than 12 magnitudes. We also limited our photometric analysis with the A-grade data quality. The time-series of the photometric pulsations of GK Car and GZ Nor are shown in Fig.2. Photometric information of the stars taken from ASAS is given Table 2.
 |
 |
.
| Name | mv | mI | No. | (day) |
|---|---|---|---|---|
| GK Car | 11m.34 | 10m.15 | 530 | 3283 |
| GZ Nor | 13m.13 | 11m.64 | 417 | 3166 |
2.2 Spectroscopic data
2.2.1 UVES spectra
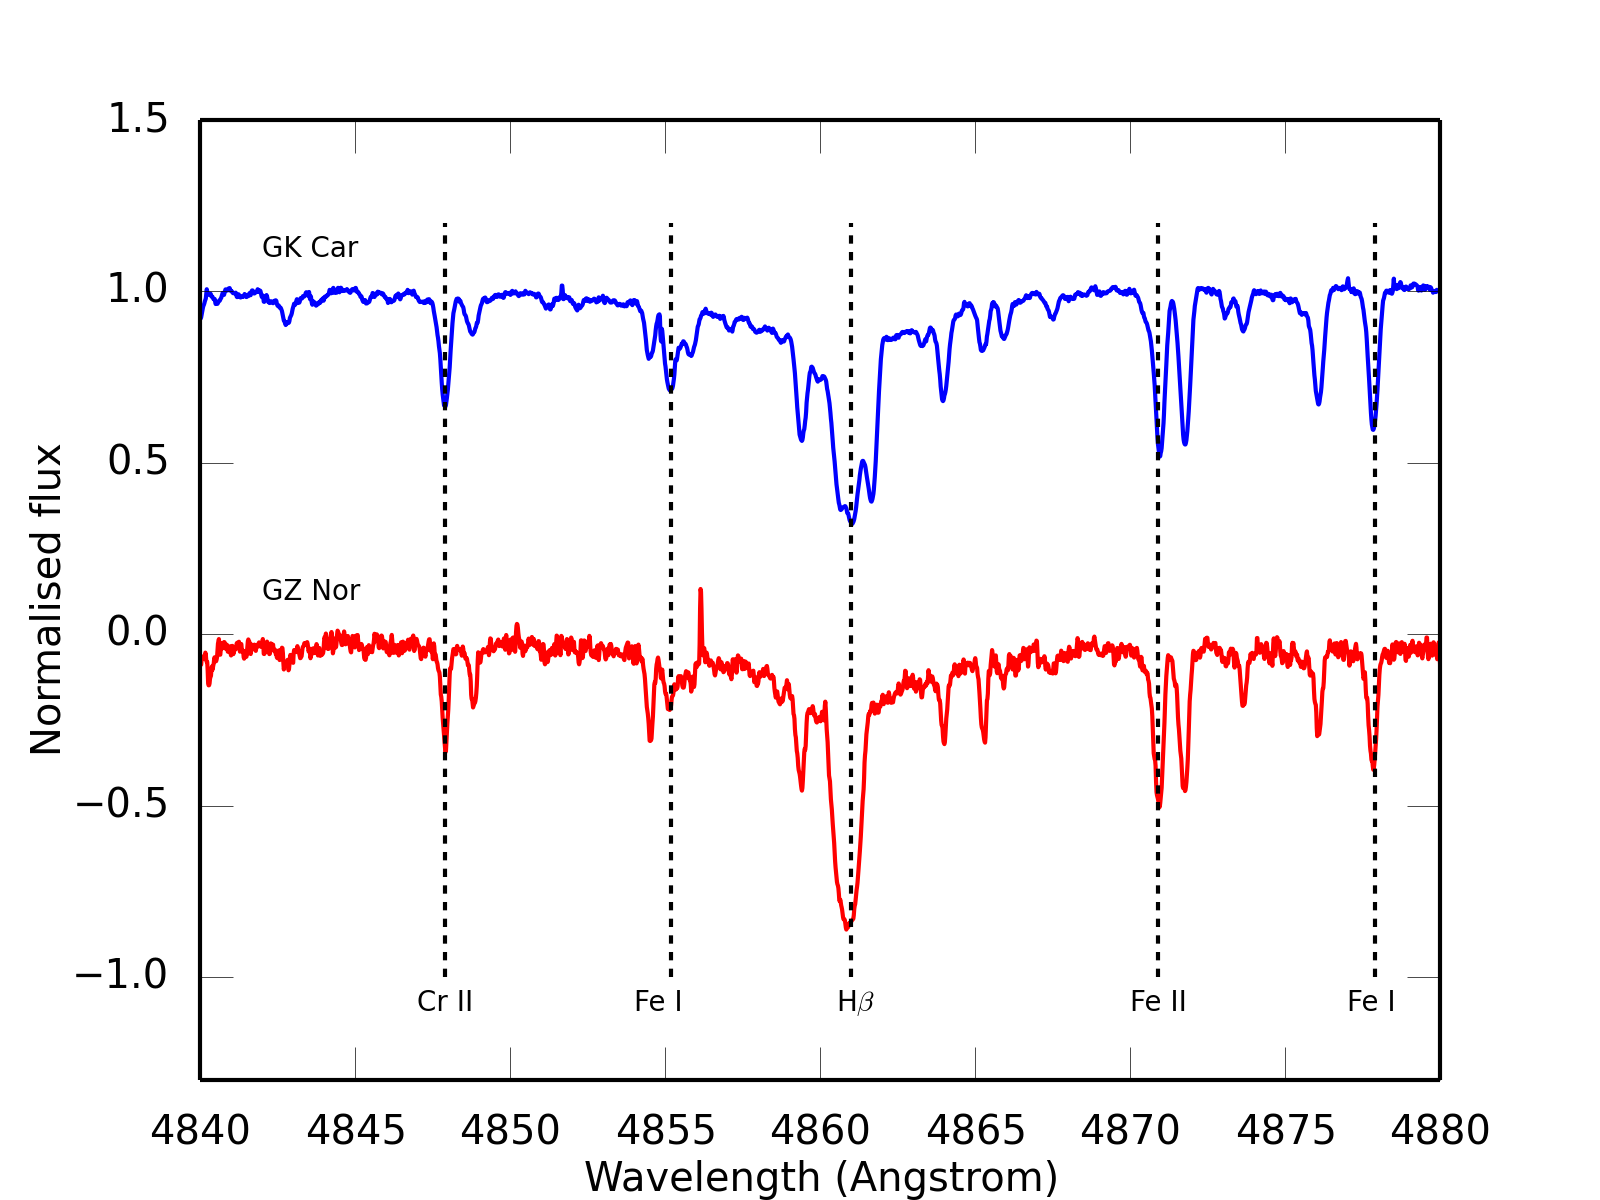
High-resolution, high signal-to-noise spectra for GK Car and GZ Nor were obtained with the Ultraviolet and Visual Echelle Spectrograph (UVES; Dekker et al. (2000)), mounted on the 8m UT2 Kueyen Telescope of the VLT array at the Paranal Observatory of ESO in Chili. The dichroic beam splitter provides a wavelength coverage from approximately 3760 to 4985 Å for the blue arm, 6705 to 8513 Å and 8663 to 10420 Å for the lower and upper parts of the mosaic CCD chip in the red arm, respectively. Observations were made in 2005 within the scope of 074.D-0619 ESO program. The log of the observations is given in Table LABEL:table_3. The data were reduced using the pipeline reduction in the MIDAS environment. The reduction includes extraction of spectral orders, wavelength calibration, applying this wavelength scale to flat-field divided data and cosmic-clipping. We normalised the spectra using fifth order polynomials on continuum points indicated interactively. A small part of the normalised spectra of GK Car and GZ Nor are shown in Fig. 3.
![[Uncaptioned image]](/html/1907.07937/assets/GZNor_SED.png)
3 Photometric Analysis and the PLC relation
3.1 Pulsation analysis
The raw photometric data were first checked for outliers beyond 4 from the mean. We then used this cleaned photometric data for our pulsation analysis. The period analysis has been performed using Period04 (Lenz & Breger, 2005), which uses the Discrete Fourier Transform to find the most dominant frequency of a light curve. After the most dominant frequency is obtained, it is prewhitened and the second most dominant frequency in the remaining data is searched for. This process is repeated until the signal-to-noise (S/N) ratio falls below 4. This critical S/N value 4 is used, because frequencies with a lower S/N cannot be distinguished from noise (Breger et al., 1993; Kuschnig et al., 1997).
For GK Car, we obtained two periods, a fundamental period of 27.6 days together with a 55.2 days formal period, both are consistent with the literature. GK Car was first identified in Rosino (1951) as an RV Tau variable with a 55.6 days pulsation period. It is also given in the GCVS (Samus et al., 2009) with a 55.3 days period and a RVa photometric class. The phased photometric data for GK Car is shown in the top panel of Fig. 2, folded on the formal period.
GZ Nor is given as a long period variable star in GCVS with a 35.9 days period based on Kruytbosch (1932). Using the more recent ASAS photometry we detected two periods above S/N 4, a fundamental period of 36.2 days together with a 72.4 days formal period. A phase plot of photomotric data of GZ Nor folded on the formal period is shown in Fig. 2. It is clearly seen that it shows subsequent deep and shallow minima, which is a characteristic of RV Tau variables. We couldn’t detect any variability in the mean magnitude. Thus, we classified GZ Nor as an RVa photometric type object (Kukarkin, 1958).
![[Uncaptioned image]](/html/1907.07937/assets/GZNor_phase.png)
.
3.2 Luminosity and Distance Estimates using the PLC relation
Luminosity is an important parameter and often difficult to obtain. Deriving the luminosities of type II Cepheids is especially important in the context of the direct relationship between the period of pulsation and the luminosity. Some period-luminosity (P-L) relations for type II Cepheids in the galactic globular clusters, SMC and LMC are given by Nemec et al. (1994), Alcock et al. (1998) and Ripepi et al. (2015). More recently, Manick et al. (2017) gave the period-luminosity-colour (PLC) relation based on 187 LMC type II Cepheids. Here we use the following,
| (1) |
Although ASAS provides and band photometry for many objects, unfortunately only band photometry was available for our stars in the ASAS database. We used the mean observed ASAS magnitudes and synthetic magnitudes which are calculated from the stellar models. We defined a zero point for this synthetic system using the flux around the band and we calculated magnitudes for each star. For GK Car the obtained I magnitude is 10.15 mag and for GZ Nor it is 11.64 mag. In order to obtain intrinsic (V-I)0 from the observed (V-I), we used the relation E(V-I)=1.38E(BV) from Tammann et al. (2003). The E(BV) values are obtained from the SED fits.
| Star | Ppuls | (V-I)0 | E(B-V) | DistancePLC | LSED |
|---|---|---|---|---|---|
| (days) | (kpc) | (L⊙) | |||
| GK Car | 27.6, 55.2 | 0.624 | 0.41 | 4.541.26 | 1520 |
| GZ Nor | 36.2, 72.4 | 0.910 | 0.42 | 8.382.32 | 1240 |
Once (V-I)0 values are obtained for both stars, it is easy to derive luminosities using the absolute magnitudes from the PLC relationship. The relation 1 turns MV = -3.22 mag and MV = -2.79 mag for GK Car and GZ Nor, respectively. We derived the reddening-corrected distances for our both stars. The amount of extinction, Av, towards the star is E(BV)Rv. We used Rv = 3.1 for the total to selective Galactic extinction (Weingartner & Draine, 2001) and used the E(BV) values for each star from the SED fitting. For GK Car the total extinction Av is 1.27 and for GZ Nor it is 1.30. The obtained distances are given in column 5 of Table 4. We then computed the bolometric luminosities, LSED, for each star using the integrated flux below the SED photospheric model scaled to the dereddened photometry using the obtained distances. The obtained SED luminosities are given in column 6 of Table 4.
| Star | Distance | Distance | Distance | LSED | LSED | LSED |
| (lower) | (upper) | (lower) | (upper) | |||
| (kpc) | (kpc) | (kpc) | (L⊙) | (L⊙) | (L⊙) | |
| GK Car | 3.782 | 3.376 | 4.293 | 1050 | 837 | 1352 |
| GZ Nor | 8.800 | 6.630 | 12.062 | 1367 | 776 | 2568 |
Recently, Gaia Data Release 2 (Gaia DR2) has become available through the Gaia Archive333https://www.cosmos.esa.int/gaia, (Gaia Collaboration, 2018; Luri et al., 2018). New Gaia DR2 provides parallax for more than 1.3 billion objects. For many of the stars in GAIA DR2 data release, a reliable distance cannot be obtained by simply inverting the parallax. Therefore, for 1.3 billion stars with parallaxes in the GAIA DR2 release, distances and their uncertainties are estimated from the parallax using a Galactic model as prior that varies as a function of Galactic longitude and latitude according to a Galaxy model Bailer-Jones (2015). For our stars, the estimated GAIA distances with lower and upper limits are given in Table 5. We also calculated luminosities using the GAIA distances by integrating the SED model scaled to the dereddened photometry. The calculated luminosities with the related distances are given in column 5, 6 and 7 of Table 5, respectively.
4 Chemical analysis
4.1 Atmospheric parameters
To derive the photospheric parameters and elemental abundances on the basis of our high-resolution spectra, we used a python wrapper (PyMOOG) (De Smedt et al., 2015) of the MOOG abundance code (version July 2009) (Sneden, 1973) combined with Kurucz-Castelli (Castelli & Kurucz, 2004) and MARCS (Model Atmosphere in Radiative and Convective Scheme) (Gustafsson et al., 2008) atmosphere models. The routine assumes the local thermal equilibrium (LTE) conditions. For spectral line identification, we used the Vienna atomic line database (VALD) (Kupka et al., 1999) in combination with a line list compiled for the chemical analysis of A, F, and G stars at the Institute of Astronomy (KU Leuven) (Van Winckel & Reyniers, 2000).
The radial velocities are estimated for both stars using IRAF (Data Reduction and Analysis System) RV package by fitting a Gaussian curve to an identified atomic line. The radial velocity is found to be -22.3 km/s for GK Car and -123.8 km/s for GZ Nor, respectively. These radial velocities are accurate enough for line identification purposes.
Once lines are identified, the equivalent width (EW) are measured interactively by taking a direct integration in PyMOOG. Abundances are computed in an iterative process in which the theoretical EWs of single lines are computed for a given abundance and matched to the observed EWs. Line selection is quite important to determine accurate abundances. In order to limit ourselves to the linear part of the curve of growth, we select lines with EWs smaller than 150 mÅ. We also do not use lines with EWs smaller than 5 mÅ because they might be confused with noise in the spectra. Blended lines are also avoided. Synthetic spectra, which are modelled with MOOG using the VALD atomic data are used to check whether lines are blended with other identified lines.
It is crucial to define an accurate atmospheric model, which closely resembles the stellar effective temperature, surface gravity, metallicity and microturbulent velocity at the time of the spectral observation. These are derived using Fe I and Fe II lines. The effective temperature is obtained on the basis of the requirement that the abundances obtained from the Fe I lines are independent of the excitation potentials of the lines. The surface gravity is calculated based on the ionization balance between the Fe I and Fe II lines. The microturbulent velocity is calculated based on the assumption that the abundances obtained from the Fe I lines are independent of the reduced equivalent widths of the lines.
For GK Car, using an (LTE) Kurucz-Castelli (Castelli & Kurucz, 2004) model, we obtained Teff = 5500 K, log = 1.0 dex, = 5.5 km/s, and [FeI/H] = -1.32 . For GZ Nor, atmospheric parameters are calculated using both Kurucz-Castelli (Castelli & Kurucz, 2004) and Marcs (Gustafsson et al., 2008) models. GZ Nor is a cooler star and we prefer to use the Marcs model in this case (Plez, 2003). For GZ Nor we obtained the following atmospheric parameters : Teff = 4875 K, log = 0.50 dex, = 4.0 km/s, [FeI/H] = -2.05 .
4.2 Abundances of GK Car
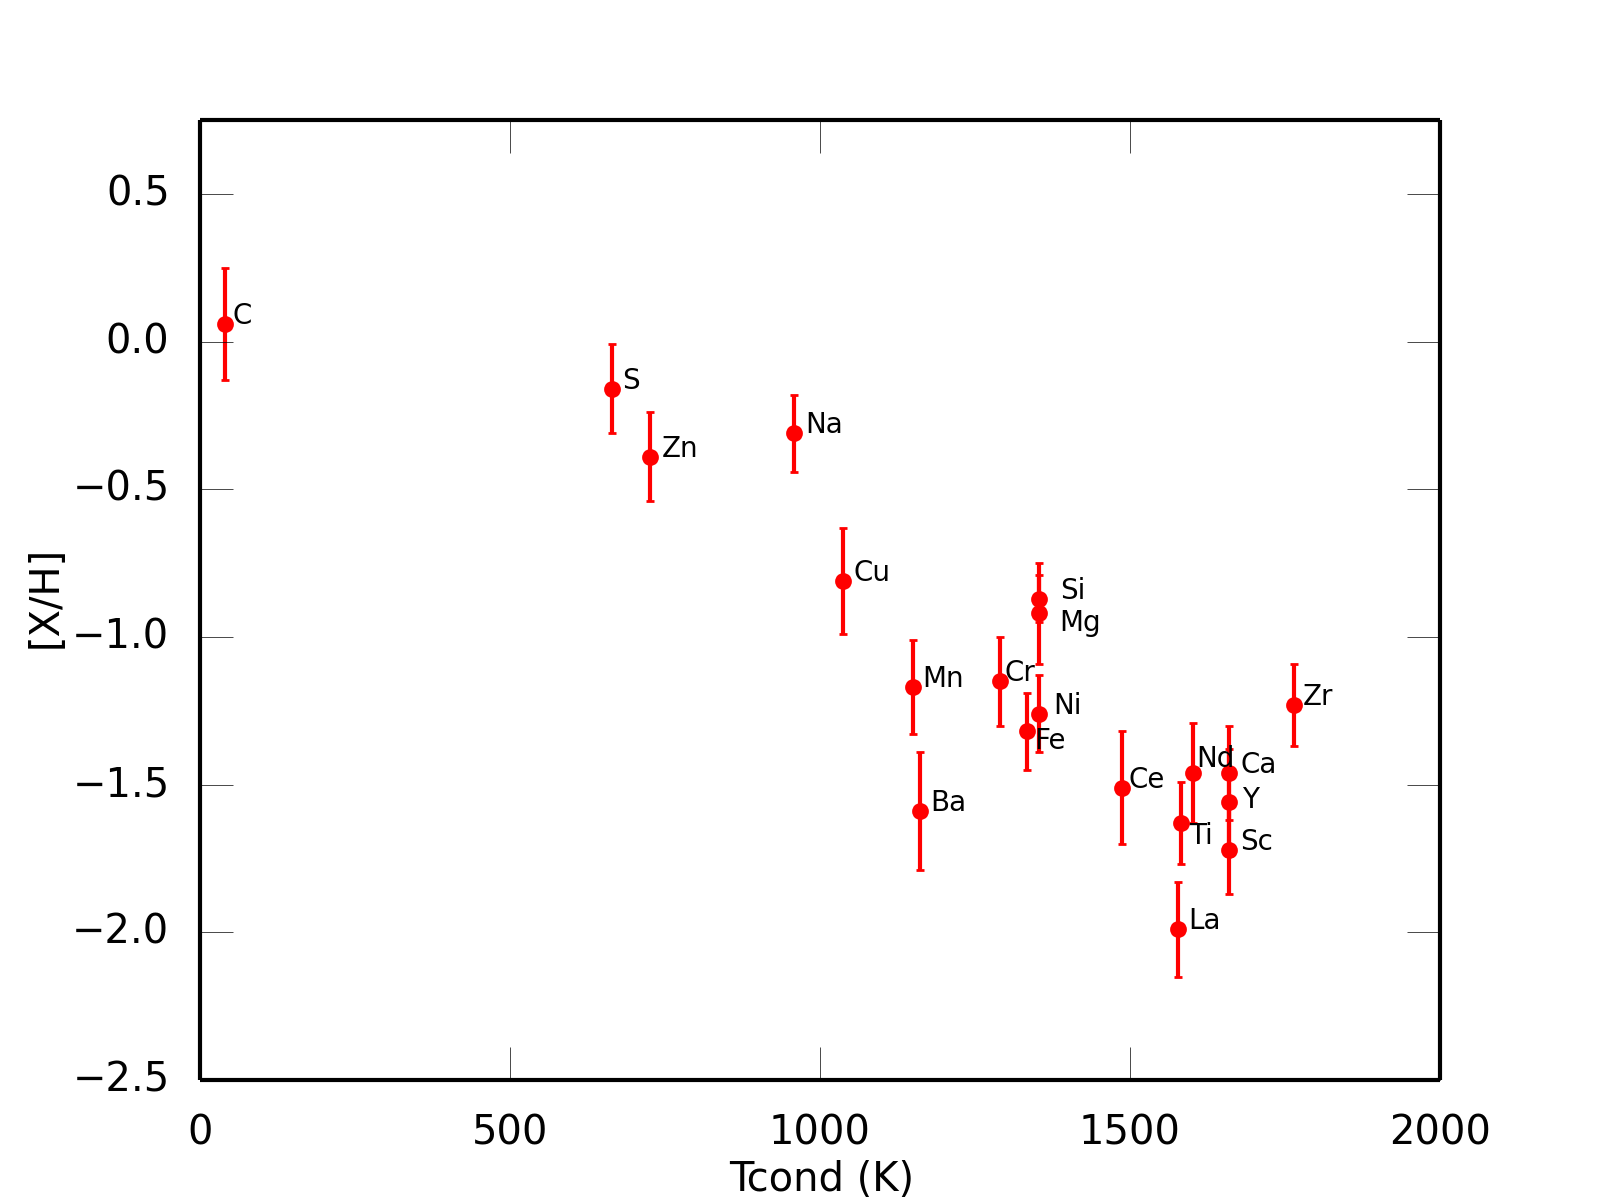
Owing to GK Car’s high-resolution and high signal-to-noise spectra, a sufficient number (182 in total) of lines could be measured for our abundance analysis. The abundances are listed in Table 6 and plotted versus their dust condensation temperatures in Fig. 6. The small amount of line-to-line scatter, which is given in the column in Table 6 indicates the resulting abundances derived from the different lines of each element are consistent.
S and Zn abundances are good indicators of whether the stellar atmosphere is affected by the depletion process or not. Zn has a similar nucleosynthetic origin to Fe but it has a much lower condensation temperature. Similarly, S is a element which has a lower condensation temperature than other elements such as Mg, Ca and Ti. Hence, the low Fe ([Fe/H]=-1.3) abundance combined with the high Zn abundance ([Zn/Fe] = +0.9) and also the high S abundance ([S/Fe] = +1.2) versus the average abundance of the other elements ([/Fe] = 0) shows that the photospheric abundances of GK Car are altered by the depletion process. In figure 6, we display a clear correlation between the photospheric abundances and the condensation temperature.
The abundance ratios such as [Zn/Ti] and [S/Ti] are less dependent on the model atmospheric parameters than on the absolute abundance values. When the model temperature is increased by 125 K, Ti abundance will change about 0.14 dex but Zn abundance will also change about 0.10. In this case, the [Zn/Ti] ratio obtained from the hotter model is about the same ratio obtained from the model that we use. Relative abundance ratios are more reliable and less dependent on model parameters errors.
For several sprocess elements such as Y, Zr, Ba, La, Ce and Nd we could determine abundances. sprocess elements generally have high condensation temperatures and we found that abundances of sprocess elements in GK Cars photosphere follow indeed the depletion of Fe (see Table 6).
| GK Car | ||||
| Teff 5500 K | ||||
| log 1.0 | ||||
| 5.5 km/s | ||||
| [Fe/H] 1.32 | ||||
| ion | N | [X/H] | Tcond | |
| CI | 5 | 0.06 | 0.16 | 40 |
| NaI | 4 | 0.31 | 0.15 | 958 |
| MgI | 2 | 0.92 | 0.18 | 1354 |
| SiI | 3 | 0.87 | 0.03 | 1354 |
| SI | 3 | 0.16 | 0.1 | 664 |
| CaI | 7 | 1.46 | 0.20 | 1659 |
| ScII | 4 | 1.72 | 0.07 | 1659 |
| TiII | 15 | 1.63 | 0.14 | 1582 |
| CrII | 8 | 1.15 | 0.17 | 1291 |
| MnI | 6 | 1.17 | 0.09 | 1150 |
| FeI | 77 | 1.32 | 0.11 | 1334 |
| FeII | 8 | 1.3 | 0.09 | |
| NiI | 15 | 1.26 | 0.08 | 1353 |
| CuI | 3 | 0.81 | 0.13 | 1037 |
| ZnI | 3 | 0.39 | 0.14 | 726 |
| YII | 3 | 1.56 | 0.16 | 1659 |
| ZrII | 3 | 1.23 | 0.05 | 1764 |
| BaII | 2 | 1.59 | 0.17 | 1162 |
| LaII | 2 | 1.99 | 0.05 | 1578 |
| CeII | 5 | 1.51 | 0.18 | 1487 |
| NdII | 4 | 1.46 | 0.1 | 1602 |
4.3 Abundances of GZ Nor
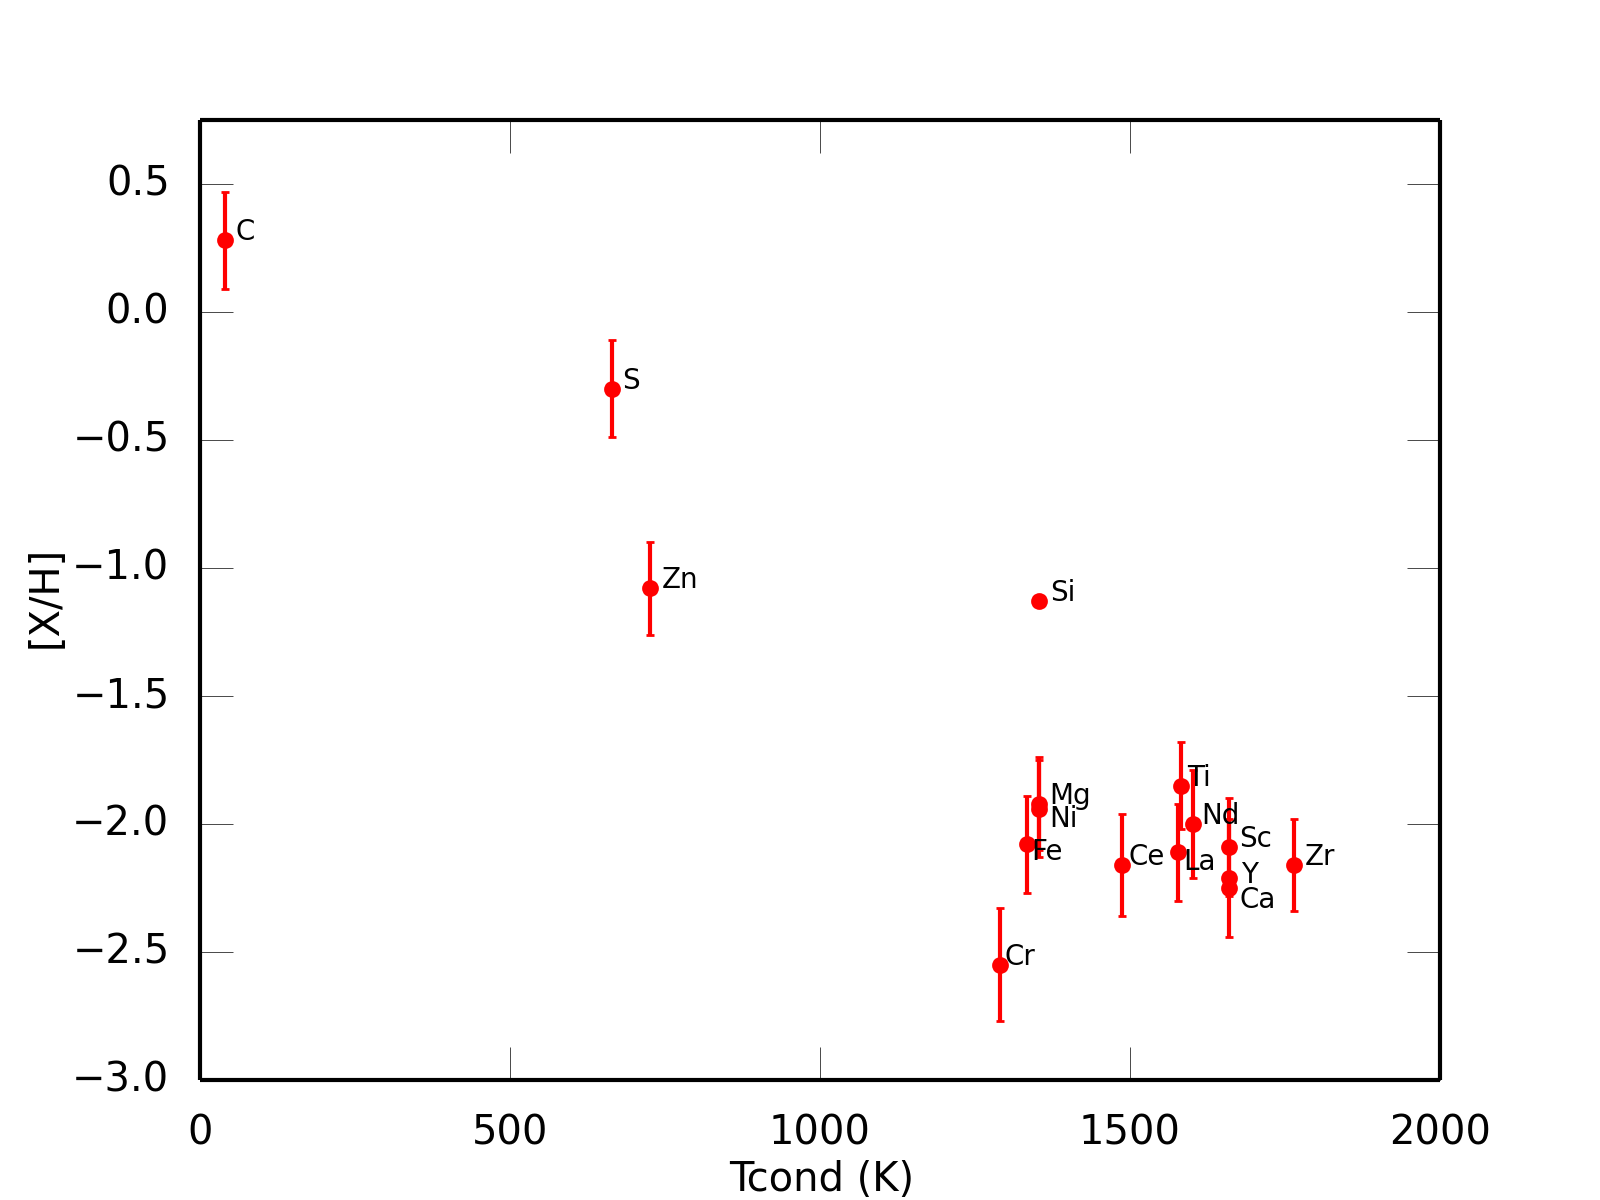
GZ Nor is a colder star than GK Car. Thus, to find isolated lines with a good line profile has been more difficult. Nevertheless, a sufficient number of good isolated lines (96 in total) have measured for abundance analysis. The abundance results are listed in Table 7. The abundance of the elements is plotted versus their dust condensation temperature in Fig. 7.
GZ Nor is a metal-poor star with [FeI/H] = 2.0. We obtained high [S/Fe], [S/Ti], [Zn/Fe] and [Zn/Ti] ([SI/FeI] = +1.7, [IS/TiII] = +1.6, [ZnI/FeI] = +0.7 and [ZnI/TiII] = +0.8) ratios. This clearly points to an atmosphere affected by depletion. The amount of sprocess lines are low in GZ Nor’s spectra. Nevertheless, we could define abundances for Y, Zr, La, Ce, and Nd. The obtained abundances for those sprocess elements are very low, which confirms a depleted photosphere.
. GZ Nor Teff 4875 K log 0.5 4.0 km/s [Fe/H] 2.08 ion N [X/H] Tcond CI 3 0.28 0.14 40 MgI 3 1.92 0.16 1354 SiI 1 1.13 0.2 1354 SI 4 0.3 0.03 664 CaI 2 2.2 0.2 1659 ScII 4 2.09 0.18 1659 TiII 14 1.85 0.16 1582 CrI 3 2.55 0.1 1291 FeI 27 2.08 0.11 1334 FeII 8 1.80 0.14 NiI 3 1.94 0.17 1353 ZnI 3 1.08 0.19 726 YII 2 2.21 0.18 1659 ZrII 4 2.16 0.12 1764 LaII 4 2.11 0.11 1578 CeII 4 2.16 0.08 1487 NdII 5 2.0 0.14 1602
5 Discussion and Conclusion
GK Car is a known RV Tauri star and classified as a disc source (Lloyd Evans, 1985; de Ruyter et al., 2006; Gezer et al., 2015) in the literature. In this study, thanks to recent ASAS photometry, we show that GZ Nor is also an RV Tauri star rather than a long-period variable as was postulated in the literature.
The SED of GZ Nor is classified as an “uncertain” as it is located outside of the disc box as defined in (Gezer et al., 2015). In this study, we selected GZ Nor to compare it with a known disc source such as GK Car, which is located in the disc box. Disc sources are generally associated with binarity (see, Van Winckel, 2018). In our previous study, we showed that there is a strong correlation between disc type SED, binarity and the presence of a depleted photosphere (Gezer et al., 2015). Our abundance analysis shows that both GK Car and GZ Nor display depletion of refractory elements. Since the depletion process probably only occurs in a stable disc (Waters et al., 1992) and the disc is associated with binarity (Van Winckel, 2018), the observed depletion pattern in GZ Nor would be an indication of a binary central star surrounded by a circumbinary disc. The dust excess of GZ Nor starts at redder wavelengths than the bulk of the other objects which occupy the disc box. The small [3.4][4.6] colour and the lack of a clear near-IR excess may indicate that the near-IR excess has already disappeared and it’s disc is an evolved state. The evolution of post-AGB circumbinary discs is not completely understood yet, despite the fact that it has been investigated in many studies (e.g. Gielen et al., 2011; Hillen et al., 2017; Bujarrabal et al., 2013, 2018). It is very likely that the near-IR luminosity of the disc decreases with time and evolves into a gas-poor debris disc. Hence, the location of these objects in the WISE colour-colour diagram changes according to the evolutionary stage of their IR luminosity.
As we discussed in the paper I, the presence of a disc is not a sufficient condition but it is an essential prerequisite for the depletion process to occur. The depletion pattern may still be observed while the IR-excess is not detectable anymore (Gezer et al., 2015). A similar lack of a near-IR excess was observed in AC Her, which is a depleted binary Van Winckel et al. (1998). Its disc was resolved using interferometric techniques and it was shown that the circumbinary disc is an evolved state with the large inner radius and low gas/dust ratio (Hillen et al., 2015). Another example is BD+39∘4926. It has long been known that BD+39∘4926 is a strongly depleted object (Kodaira et al., 1970), but only recently a small IR-excess at 22 m detected in W4 band thanks to the sensitivity of the WISE. It’s binary nature has also been confirmed by Kodaira et al. (1970) and Gezer et al. (2015). Another interesting example is BD+33∘2642, the central star of the PN G052.7+50.7. It has been shown that it is a depleted object (Napiwotzki et al., 1994) and a spectroscopic binary (Van Winckel et al., 2014), as well. It seems that the observed depletion pattern remains longer than the detectable IR-excess.
We compare the spectra of GK Car and GZ Nor with the spectra of the well-known binary RV Tauri star AC Her. The orbital period of AC Her is 1194 days (Van Winckel et al., 1998). AC Her is a depleted RV Tauri star with the disc. Its atmospheric parameters are similar to our stars. In figure 2, Zn lines around 4680 Å and 4810 Å and S triplet around 4695 Å are compared. All three of these stars show depletion in their atmospheres.
The depletion is generally expected to be seen in stars hotter than 5000 K as cooler stars have deep convective envelopes which dilute the accreted gas (Giridhar et al., 2005; Venn et al., 2014; Gezer et al., 2015; Oomen et al., 2018). In this sense, GZ Nor is an interesting example as a cool and depleted object. RV Tauri stars are high-amplitude pulsators and during the pulsation cycle, the temperature could change. Their atmosphere states might change dramatically during the pulsation cycle (Pollard et al., 1996, 1997). The spectra of GZ Nor was taken at phase 0.95 during the deep minima. This may imply that we took the spectra when the star in the cooler phase.
![[Uncaptioned image]](/html/1907.07937/assets/Zn_lines.png)
Finally, since we could constrain the luminosities of our objects, we discuss their evolutionary stages. We compared the observational findings with the recent evolutionary tracks. The derived metalicities do not represent the initial metallicities as the atmospheres of the stars are affected by the depletion process. Thus, we have considered evolutionary tracks for a range of metallicities. We follow the evolutionary tracks of Bertelli et al. (2009) for initial masses of 1,2 and 3 M⊙ and metallicities of Z=0.002, 0.004 and 0.017. The latter is a solar value. The luminosities of the tip of the RGB (RGB-tip) for these masses and metallicities are given in Table 8. If we assume that the initial masses of our stars is close to 1 M⊙, in that case, their luminosities obtained from different methods are lower than the expected RGB-tip luminosities for all three different metallicities. However, if we assume that the initial masses of our stars is 2 or 3 M⊙, then their luminosities are higher than the RGB-tip luminosities of 2, 3 M⊙ stars, for all three different metallicities. Therefore, our stars could be post-RGB objects, which are progenitors of 1 M⊙ star or post-AGB objects, which are progenitors of 2 or 3 M⊙ stars. One should note that uncertainties are large in the derived luminosities as it is seen in tables 4 and 5. Considering their disc-type SEDs and the depletion characteristics, we are assuming that they are indeed binary objects. Thus, they might have evolved off the RGB or AGB due to a binary interaction process.
| mass | Z = 0.017 | Z = 0.004 | Z = 0.002 |
|---|---|---|---|
| 1M⊙ | 3160L⊙ | 2880L⊙ | 2640L⊙ |
| 2M⊙ | 855L⊙ | 335L⊙ | 310L⊙ |
| 3M⊙ | 540L⊙ | 665L⊙ | 690L⊙ |
In this study, we presented a photometric and spectroscopic analysis of two RV Tauri stars GK Car and GZ Nor. Thanks to recent ASAS photometry, we showed that GZ Nor is an RV Tauri star. Using the high-resolution UVES spectra, we performed a detailed abundance analysis and showed that our two stars display depletion of refractory elements and this again confirm the idea that depletion is common in the disc sources and the RV Tauri stars with the disc-type SED are likely all binaries (Manick et al., 2017). We defined the luminosities and distances, which is important to understand their evolutionary status. They are both dusty objects with relatively low luminosity, they could be either post-AGB or post-RGB objects (Kamath et al., 2015).
Acknowledgements
This work has been performed thanks to 2214-A International Research Fellowship Programme of the Scientific and Technological Research Council of Turkey (TUBITAK).
HVW acknowledged the support of the KU Leuven research council (contract C14/17/082). IG would like to thank KU Leuven Astronomy Institute for their kind hospitality.
IG acknowledges her thanks to Prof. Ryszard Szczerba for his comments and suggestions.
Based on observations obtained with the UVES spectrograph of ESO on proposal 074.D-0619 (PI Van Winckel Hans).
The following Internet-based resources were used in research for this paper: the NASA Astrophysics Data System; the SIMBAD data base and the VizieR service operated by CDS, Strasbourg, France.
References
- Alcock et al. (1998) Alcock C., Allsman R. A., Alves D. R., et al. 1998, AJ, 115, 1921
- Asplund et al. (2009) Asplund M., Grevesse N., Sauval A. J., Scott P., 2009, ARA&A, 47, 481
- Bailer-Jones (2015) Bailer-Jones C. A. L., 2015, PASP, 127, 994
- Bailer-Jones et al. (2018) Bailer-Jones C. A. L., Rybizki J., Fouesneau M., Mantelet G., Andrae R., 2018, AJ, 156, 58
- Bertelli et al. (2009) Bertelli G., Nasi E., Girardi L., Marigo P., 2009, A&A, 508, 355
- Breger et al. (1993) Breger M., et al., 1993, A&A, 271, 482
- Buchler & Kovacs (1987) Buchler J. R., Kovacs G., 1987, ApJ, 320, L57
- Buchler et al. (2009) Buchler J. R., Wood P. R., Soszyński I., 2009, ApJ, 698, 944
- Bujarrabal et al. (2013) Bujarrabal V., Alcolea J., Van Winckel H., Santander-García M., Castro-Carrizo A., 2013, A&A, 557, A104
- Bujarrabal et al. (2018) Bujarrabal V., Castro-Carrizo A., Winckel H. V., Alcolea J., Contreras C. S., Santander-García M., Hillen M., 2018, A&A, 614, A58
- Castelli & Kurucz (2003) Castelli F., Kurucz R. L., 2003, in Piskunov N., Weiss W. W., Gray D. F., eds, IAU Symposium Vol. 210, Modelling of Stellar Atmospheres. p. 20P
- Castelli & Kurucz (2004) Castelli F., Kurucz R. L., 2004, ArXiv Astrophysics e-prints,
- De Smedt et al. (2015) De Smedt K., Van Winckel H., Kamath D., Wood P. R., 2015, A&A, 583, A56
- Degroote et al. (2011) Degroote P., et al., 2011, A&A, 536, A82
- Dekker et al. (2000) Dekker H., D’Odorico S., Kaufer A., Delabre B., Kotzlowski H., 2000, in Iye M., Moorwood A. F., eds, Proc. SPIE Vol. 4008, Optical and IR Telescope Instrumentation and Detectors. pp 534–545, doi:10.1117/12.395512
- Deroo et al. (2005) Deroo P., Reyniers M., Van Winckel H., Goriely S., Siess L., 2005, A&A, 438, 987
- Deroo et al. (2006) Deroo P., et al., 2006, A&A, 450, 181
- Deroo et al. (2007) Deroo P., Acke B., Verhoelst T., Dominik C., Tatulli E., Van Winckel H., 2007, A&A, 474, L45
- Fokin (1994) Fokin A. B., 1994, A&A, 292, 133
- Gaia Collaboration (2018) Gaia Collaboration 2018, VizieR Online Data Catalog, 1345
- Gezer et al. (2015) Gezer I., Van Winckel H., Bozkurt Z., De Smedt K., Kamath D., Hillen M., Manick R., 2015, MNRAS, 453, 133
- Gielen et al. (2011) Gielen C., et al., 2011, A&A, 533, A99
- Giridhar et al. (1994) Giridhar S., Rao N. K., Lambert D. L., 1994, ApJ, 437, 476
- Giridhar et al. (1998) Giridhar S., Lambert D. L., Gonzalez G., 1998, ApJ, 509, 366
- Giridhar et al. (2000) Giridhar S., Lambert D. L., Gonzalez G., 2000, ApJ, 531, 521
- Giridhar et al. (2005) Giridhar S., Lambert D. L., Reddy B. E., Gonzalez G., Yong D., 2005, ApJ, 627, 432
- Gonzalez et al. (1997a) Gonzalez G., Lambert D. L., Giridhar S., 1997a, ApJ, 479, 427
- Gonzalez et al. (1997b) Gonzalez G., Lambert D. L., Giridhar S., 1997b, ApJ, 481, 452
- Gustafsson et al. (2008) Gustafsson B., Edvardsson B., Eriksson K., Jørgensen U. G., Nordlund Å., Plez B., 2008, A&A, 486, 951
- Hillen et al. (2015) Hillen M., de Vries B. L., Menu J., Van Winckel H., Min M., Mulders G. D., 2015, A&A, 578, A40
- Hillen et al. (2017) Hillen M., et al., 2017, A&A, 599, A41
- Jura (1986) Jura M., 1986, ApJ, 309, 732
- Kamath et al. (2014) Kamath D., Wood P. R., Van Winckel H., 2014, MNRAS, 439, 2211
- Kamath et al. (2015) Kamath D., Wood P. R., Van Winckel H., 2015, MNRAS, 454, 1468
- Kamath et al. (2016) Kamath D., Wood P. R., Van Winckel H., Nie J. D., 2016, A&A, 586, L5
- Kodaira et al. (1970) Kodaira K., Greenstein J. L., Oke J. B., 1970, ApJ, 159, 485+
- Kruytbosch (1932) Kruytbosch W. E., 1932, Bull. Astron. Inst. Netherlands, 6, 233
- Kukarkin (1958) Kukarkin B. V., 1958, in Roman N. G., ed., IAU Symposium Vol. 5, Comparison of the Large-Scale Structure of the Galactic System with that of Other Stellar Systems. p. 49
- Kupka et al. (1999) Kupka F., Piskunov N., Ryabchikova T. A., Stempels H. C., Weiss W. W., 1999, A&AS, 138, 119
- Kuschnig et al. (1997) Kuschnig R., Weiss W. W., Gruber R., Bely P. Y., Jenkner H., 1997, A&A, 328, 544
- Lenz & Breger (2005) Lenz P., Breger M., 2005, Communications in Asteroseismology, 146, 53
- Lloyd Evans (1985) Lloyd Evans T., 1985, MNRAS, 217, 493
- Lodders et al. (2009) Lodders K., Palme H., Gail H.-P., 2009, Landolt Börnstein,
- Luri et al. (2018) Luri X., et al., 2018, preprint, (arXiv:1804.09376)
- Maas et al. (2002) Maas T., Van Winckel H., Waelkens C., 2002, A&A, 386, 504
- Maas et al. (2003) Maas T., Van Winckel H., Lloyd Evans T., Nyman L.-Å., Kilkenny D., Martinez P., Marang F., van Wyk F., 2003, A&A, 405, 271
- Maas et al. (2005) Maas T., Van Winckel H., Lloyd Evans T., 2005, A&A, 429, 297
- Manick et al. (2017) Manick R., Van Winckel H., Kamath D., Hillen M., Escorza A., 2017, A&A, 597, A129
- Manick et al. (2018) Manick R., Van Winckel H., Kamath D., Sekaran S., Kolenberg K., 2018, preprint, (arXiv:1806.08210)
- Napiwotzki et al. (1994) Napiwotzki R., Heber U., Koeppen J., 1994, A&A, 292, 239
- Nemec et al. (1994) Nemec J. M., Nemec A. F. L., Lutz T. E., 1994, AJ, 108, 222
- Ochsenbein et al. (2000) Ochsenbein F., Bauer P., Marcout J., 2000, A&A, 143, 23
- Oomen et al. (2018) Oomen G.-M., Van Winckel H., Pols O., Nelemans G., Escorza A., Manick R., Kamath D., Waelkens C., 2018, A&A, 620, A85
- Plez (2003) Plez B., 2003, in Munari U., ed., AstronomicałSociety of the Pacific Conference Series Vol. 298, GAIA Spectroscopy: Science and Technology. p. 189
- Pojmanski (2002) Pojmanski G., 2002, Acta Astron., 52, 397
- Pollard et al. (1996) Pollard K. R., Cottrell P. L., Kilmartin P. M., Gilmore A. C., 1996, MNRAS, 279, 949
- Pollard et al. (1997) Pollard K. R., Cottrell P. L., Lawson W. A., Albrow M. D., Tobin W., 1997, MNRAS, 286, 1
- Reyniers et al. (2007) Reyniers M., Abia C., Van Winckel H., Lloyd Evans T., Decin L., Eriksson K., Pollard K. R., 2007, A&A, 461, 641
- Ripepi et al. (2015) Ripepi V., et al., 2015, MNRAS, 446, 3034
- Rosino (1951) Rosino L., 1951, AJ, 113, 60
- Samus et al. (2009) Samus N. N., Durlevich O. V., et al. 2009, VizieR Online Data Catalog, 1, 2025
- Sneden (1973) Sneden C. A., 1973, PhD thesis, THE UNIVERSITY OF TEXAS AT AUSTIN.
- Soszyñski et al. (2010) Soszyñski I., Udalski A., Szymañski M. K., Kubiak M., Pietrzyñski G., Wyrzykowski Ł., Ulaczyk K., Poleski R., 2010, Acta Astron., 60, 91
- Soszyński et al. (2008) Soszyński I., et al., 2008, Acta Astron., 58, 293
- Tammann et al. (2003) Tammann G. A., Sandage A., Reindl B., 2003, A&A, 404, 423
- Tuchman et al. (1993) Tuchman Y., Lebre A., Mennessier M. O., Yarri A., 1993, A&A, 271, 501
- Van Winckel (1997) Van Winckel H., 1997, A&A, 319, 561
- Van Winckel (2003) Van Winckel H., 2003, ARA&A, 41, 391
- Van Winckel (2018) Van Winckel H., 2018, preprint, (arXiv:1809.00871)
- Van Winckel & Reyniers (2000) Van Winckel H., Reyniers M., 2000, A&A, 354, 135
- Van Winckel et al. (1998) Van Winckel H., Waelkens C., Waters L. B. F. M., Molster F. J., Udry S., Bakker E. J., 1998, A&A, 336, L17
- Van Winckel et al. (2014) Van Winckel H., Jorissen A., Exter K., Raskin G., Prins S., Perez Padilla J., Merges F., Pessemier W., 2014, A&A, 563, L10
- Venn et al. (2014) Venn K. A., Puzia T. H., Divell M., Côté S., Lambert D. L., Starkenburg E., 2014, ApJ, 791, 98
- Waters et al. (1992) Waters L. B. F. M., Trams N. R., Waelkens C., 1992, A&A, 262, L37
- Weingartner & Draine (2001) Weingartner J. C., Draine B. T., 2001, AJ, 548, 296
- de Ruyter et al. (2006) de Ruyter S., van Winckel H., Maas T., Lloyd Evans T., Waters L. B. F. M., Dejonghe H., 2006, A&A, 448, 641