Recalibration of [O ii] as a Star Formation Rate Estimator for Active and Inactive Galaxies
Abstract
We investigate the use of the [O ii] emission line as a star formation rate (SFR) estimator using Sloan Digital Sky Spectra for nearly 100,000 star-forming galaxies and 5,500 galaxies with narrow-line active galactic nuclei. Consistent with previous work, we find that the [O ii]/H ratio in star-forming galaxies depends strongly on gas-phase metallicity. Using metallicities derived from the [N ii] /[O ii] method, we refine a metallicity-dependent SFR estimator based on [O ii] that is calibrated within a scatter of 0.056 dex against the more commonly used SFR indicator based on H emission. The scatter increases to only 0.12 dex if the metallicity is estimated using the stellar mass-metallicity relation. With the aim of extending the [O ii]-based SFR estimator to active galaxies, we calculate radiation pressure-dominated photoionization models to constrain the amount of [O ii] emission arising from the narrow-line region. We use the sample of active galaxies to demonstrate that the SFRs derived from [O ii], after accounting for nonstellar contamination, are consistent with independent SFR diagnostics estimated from the stellar continuum of the host galaxies.
1 Introduction
The star formation rate (SFR) is one of the most fundamental physical parameters to understand the formation and evolution of galaxies. A variety of indicators have been calibrated to estimate the SFR in star-forming galaxies, ranging from ultraviolet, infrared, and radio continuum emission to emission lines tracing photoionized or photodissociated regions (for a review, see Kennicutt & Evans, 2012). The nebular recombination line H is typically regarded as the most reliable SFR indicator. Proportional to the ionizing radiation from young ( Myr), massive () stars, the bright and widely accessible H line provides a direct probe of the instantaneous SFR independent of previous star formation history (Kennicutt, 1998). Beyond , when H is redshifted outside of the optical window, the most widely considered alternative spectroscopic SFR indicator is the [O ii] doublet (e.g., Gallagher et al., 1989; Kennicutt, 1992; Kewley et al., 2004; Moustakas et al., 2006; Weiner et al., 2007; Argence & Lamareille, 2009; Gilbank et al., 2010), which can extend the redshift coverage up to . However, [O ii] is less directly connected with the ionizing photons than H, and several complicating factors need to be considered.
Kewley et al. (2004) used a nearby galaxy sample to study the variation of the [O ii]/H ratio with dust reddening, metallicity, and ionization parameter, and offered an improved [O ii] SFR calibration with an explicit correction for metallicity. Moustakas et al. (2006) also investigated the systematic uncertainties of the [O ii]-based SFR diagnostic, incorporating -band luminosity as a term to reduce the scatter due to dust reddening, metallicity, and ionization. Other improvements to the [O ii] SFR indicator have been proposed in a similar spirit (Weiner et al., 2007; Argence & Lamareille, 2009; Kennicutt et al., 2009; Gilbank et al., 2010). However, these modified calibrations are still subject to some shortcomings, such as relatively small calibration sample, large scatter (0.3 dex), or the requirement of additional observations.
Ever since the recognition that black hole mass correlates tightly with galaxy properties (Magorrian et al., 1998; Ferrarese & Merritt, 2000; Gebhardt et al., 2000; Kormendy & Ho, 2013), much attention has been devoted to the manner in which supermassive black holes might coevolve with their host galaxies (e.g., Richstone et al., 1998; Ho, 2004; Heckman & Best, 2014). A key hindrance to progress in this still-controversial subject stems from the fact that reliable SFRs are tremendously difficult to ascertain in active galactic nuclei (AGNs). AGN emission encompasses the entire spectral energy distribution (SED), presenting an unavoidable source of contamination for virtually all traditional extragalactic SFR estimators. In terms of emission-line diagnostics arising from photoionized gas, a strategy must be devised to separate the contribution from the AGN narrow-line region (NLR) to that arising from H ii regions. Zhuang et al. (2019) recently presented a new method to derive SFRs in active galaxies using the mid-IR fine-structure lines [Ne ii] 12.81 µm and [Ne iii] 15.55 µm, which effectively trace the ionizing luminosity of star-forming galaxies (Ho & Keto, 2007). While the NLR of AGNs also emits copious [Ne ii] and [Ne iii], in the case of nonstellar excitation these low-ionization lines are unavoidably accompanied by [Ne v] 14.32 µm for the ionization parameters characteristic of Seyfert galaxies and quasars. Fortunately, the ratio of [Ne ii] or [Ne iii] relative to [Ne v] spans a sufficiently well-defined, narrow range that the contribution of the AGN to the low-ionization lines can be removed, and hence the SFR of the underlying host inferred. Zhuang et al.’s methodology for treating the neon lines can also be adopted for [O ii] , whose intensity relative to [O iii] also occupies a fairly restricted range in the NLR of highly accreting AGNs (Ho, 2005; Kim et al., 2006). In both cases, the lines of low ionization potential ([Ne ii], [Ne iii], and [O ii]) can be excited by both star formation and nuclear activity, while the lines of high ionization potential ([Ne v] and [O iii]) are powered predominantly by the AGN.
Here we present a recalibration of [O ii] as a SFR indicator using nearly 100,000 star-forming galaxies, the largest sample to date, drawn from the seventh data release (DR7; Abazajian et al., 2009) of the Sloan Digital Sky Survey (SDSS; York et al., 2000). The large sample size enables us to probe in greater detail than previous work the dependence of the [O ii]/H ratio on oxygen abundance, achieving a much better global consistency between the [O ii] and H SFR indicators (0.056 dex scatter). We compute a suite of new NLR models, spanning a wide range of realistic physical conditions, to constrain the amount of [O ii] at a given strength of [O iii] produced by AGNs. These models enables us to isolate the contribution of nonstellar photoionization to the observed, total integrated [O ii] emission of an active galaxy, thereby separating the fraction of the line attributable to star-forming regions in the host galaxy. We apply our new [O ii] SFR calibration to 5,500 narrow-line AGNs and show its consistency with an independent SFR diagnostic.
Section 2 describes the data and their selection criteria. We calibrate [O ii] as a SFR estimator for star-forming galaxies in Section 3, and then in Section 4 we extend it to AGNs with the help of NLR photoionization models. Section 5 discusses the results from our models and compares them with independent SFRs for AGNs. Our main conclusions are summarized in Section 6. Throughout the paper, we assume a cosmology with km s-1 Mpc-1, , and . As in Brinchmann et al. (2004), we adopt the Kroupa (2001) stellar initial mass function. For the initial mass functions of either Salpeter (1955) or Chabrier (2003), our SFRs need to be scaled by a factor of 1.49 and 0.94, respectively (Madau & Dickinson, 2014).
2 Data
Our data are drawn from SDSS DR7, which covers an area of 8423 deg2, with spectroscopy of complete samples of galaxies and quasars covering 8200 deg2. The spectra are taken with a -diameter fiber with spectral coverage 38009200 Å at a resolution of . We use the emission-line fluxes (Tremonti et al., 2004) and stellar mass () measurements (Kauffmann et al., 2003a; Salim et al., 2007) provided by the Max Planck Institute for Astrophysics and Johns Hopkins University (MPA-JHU) catalog111http://www.strw.leidenuniv.nl/jarle/SDSS/, http://www.mpa-garching.mpg.de/SDSS/DR7. We adopt the nuclear spectral classifications from the MPA-JHU catalog, which are based on the precepts of Baldwin et al. (1981) discussed in Brinchmann et al. (2004). We correct the line fluxes for dust extinction using the observed Balmer decrements and the Milky Way extinction curve of Cardelli et al. (1989)222Most of the objects in our final sample have mild reddening, with a median of 0.88 mag. with . For electron temperatures K and electron densities cm-3, the intrinsic value of H/H for star-forming galaxies and H/H for AGNs (Osterbrock & Ferland, 2006).
The MPA-JHU catalog lists 203,630 star-forming galaxies and 91,477 AGNs333We exclude low-ionization nuclear emission-line regions (LINERs; for a review, see Ho 2008). with . For star-forming galaxies, we further apply the following selection criteria:
-
1.
To ensure reliable metallicity estimates, a signal-to-noise ratio (S/N) is required for [O ii] , H, [O iii] , H, and [N ii] . For a better estimation of the true uncertainties of the emission lines, we adopt the scaled uncertainties as suggested by the MPA-JHU group.
-
2.
To ensure that the metallicity derived from the fiber spectrum represents well the global metallicity, the fiber must cover at least 20% of the -band total photometric light (Kewley et al., 2005). We use the fiber and the photometric Petrosian magnitude to calculate the fiber coverage, as in Kewley & Ellison (2008).
-
3.
Objects with H/H 2.86 are removed. Balmer decrements lower than the theoretical value could result from errors in the subtraction of the stellar continuum or errors from flux calibration and measurement. No S/N cut is set here because the median S/N of observed H/H is 4, and the median S/N of [O ii] after extinction correction is already larger than 3.
-
4.
Stellar mass estimates are available.
For AGNs, we place the following conditions:
-
1.
A S/N 3 is required for [O ii], H, [O iii], and H. The S/N ratio cut is more lenient than that of star-forming galaxies because for AGNs we do not need to derive the metallicity using the emission lines. Uncertainties are scaled in a similar manner as for the star-forming galaxies.
-
2.
A S/N 5 is required for H/H, and objects with H/H 3.1 are removed.
-
3.
Stellar mass estimates are available.
-
4.
The specific SFR (sSFR SFR/) measured in the fiber must exceed yr-1. The fiber SFRs for AGN host galaxies are estimated from the relation between the sSFR and the 4000 Å break (D4000) established empirically for star-forming galaxies (Brinchmann et al., 2004). Salim et al. (2016) show that, when sSFR yr-1, D4000-based sSFRs show good agreement with sSFRs derived from global SED fitting. For lower values of sSFR, D4000 is less sensitive to sSFR, and SFRs derived in this manner are subject to much larger uncertainties. The limitations of using D4000 to trace SFRs in AGNs are further discussed in Section 5.2.
The final sample contains 99,355 star-forming galaxies and 5,472 AGNs, both groups covering a very similar redshift range of . The AGNs span over 5 orders of magnitude in [O iii] luminosity ( erg s-1), from run-of-the-mill type 2 Seyferts to those powerful enough to be considered type 2 quasars (Reyes et al., 2008; Kong & Ho, 2018). We also include the sample used in Kewley et al. (2004, hereinafter K04), which consists of 97 star-forming galaxies from the Nearby Field Galaxies Survey (NFGS; Jansen et al., 2000a, b). The great increase in the sample size with respect to K04, coupled with the homogeneity of the SDSS and ancillary data, motivates us to update the [O ii] SFR calibration for star-forming galaxies, as well as to extend it to their active counterparts.
3 Calibration of [O ii] SFR indicator in star-forming galaxies
H provides a robust SFR standard for galaxies at redshifts , and we use it as the reference to calibrate [O ii]. As in K04, we adopt Kennicutt’s (1998) conversion between extinction-corrected H luminosity () and SFR, after adjustment for our adopted initial mass function:
| (1) |
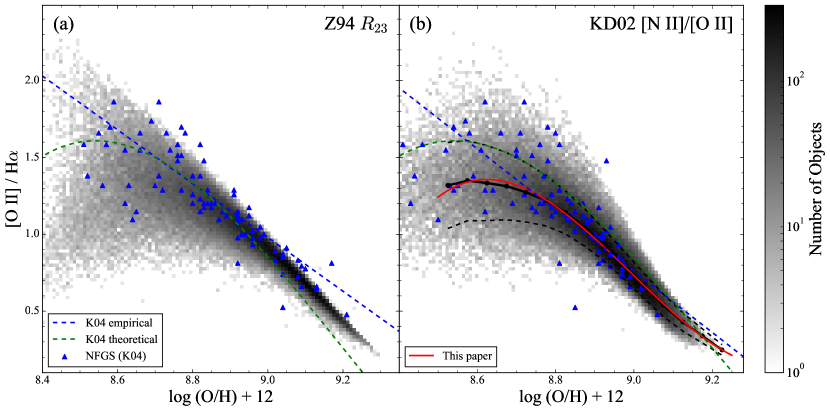
Apart from dust reddening, metallicity has the strongest effect on the relation between H and [O ii] (K04). Figure 1 shows the relation between the extinction-corrected [O ii]/H ratio and the gas-phase oxygen abundance, , estimated indirectly from both the method444 ([O ii] +[O iii] )/H (Pagel et al., 1979)., as implemented by Zaritsky et al. (1994, hereinafter Z94), and the [N ii]/[O ii] method of Kewley & Dopita (2002, hereinafter KD02). The metallicity diagnostic of Z94 is the preferred choice of K04, while [N ii]/[O ii] has low residual discrepancy in relative metallicity, suffers less from AGN contamination, and is also less sensitive to the ionization parameter (Kewley & Ellison, 2008). K04 provide empirical calibrations for different metallicity diagnostics based on observations from NFGS and theoretical calibrations from photoionization models. Both of the methods of deriving metallicity used here agree well with the NFGS observations (K04). However, on account of the limited size of the NFGS sample, neither the low-metallicity nor the high-metallicity end of the population is well covered, and K04’s calibrations deviate from the sample distribution from SDSS DR7 (Figure 1). This is especially notable for metallicities derived using the Z94 method (left panel). Since the KD02 [N ii]/[O ii] method provides better relative metallicities compared to the Z94 method (Kewley & Ellison, 2008), we adopt the former for the rest of the subsequent analysis. A third-order polynomial fit to the median of the binned data yields
| (2) |
where the oxygen abundance . From KD02,
| (3) |
with . For objects without coverage or detection of [N ii], we estimate the metallicity from its relation with stellar mass (- relation; Tremonti et al., 2004). The - relation of Kewley & Ellison (2008), based on metallicities from the KD02 [N ii]/[O ii] method, is given by
| (4) |
Although the - relation of Kewley & Ellison (2008) is based on star-forming galaxies in SDSS DR4, we confirm that it fits our SDSS DR7 sample equally well. Since Equation 4 only covers the mass range , we exclude a small fraction (0.6%) of the objects with . For galaxies with , we fix the oxygen abundance555The - relation flattens toward the high-mass end, and hence we use the value of the oxygen abundance at . to .
| (5) |
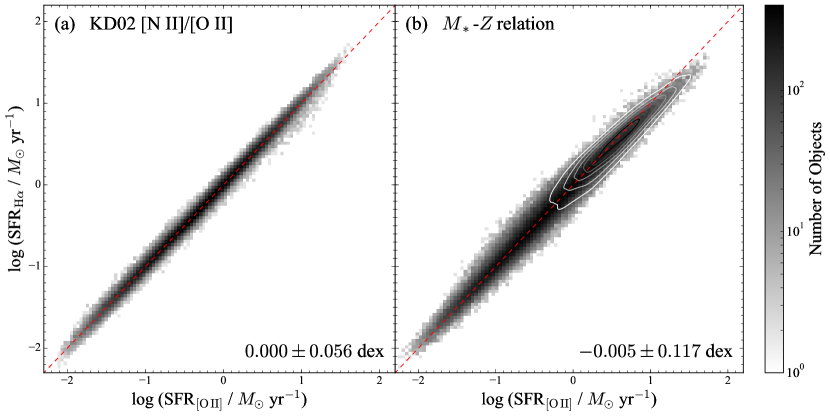
Figure 2 compares the SFRs from H (Equation 1) with SFRs based on [O ii] (Equation 5), for metallicities estimated using both the KD02 [N ii]/[O ii] method and the - relation. No systematic differences are found in either panel. For metallicities based on the KD02 [N ii]/[O ii] method, the scatter between the two SFRs is extremely small (0.056 dex); the scatter in SFR is higher for the case of metallicities based on the - relation, but it is still small (0.12 dex). For galaxies more massive than (contours in Figure 2b), there is a mild tendency for the [O ii]-based SFRs to be overestimated, but the effect is insignificant (median difference dex).
[O ii]/H can also be affected by ionization parameter (), the dimensionless ratio of the incident ionizing photon density to the hydrogen density (K04; Moustakas et al., 2006). Moustakas et al. (2006) found that [O ii]/H depends mildly on . This accounts for the dispersion around the median curve of [O ii]/H versus oxygen abundance (Figure 1). However, we note that K04’s [O ii]-based SFRs, which are based on a theoretical calibration using a single value of value, agree very well with H-based SFRs (0.05 dex residual scatter). Similarly, the [O ii]-based SFRs in this paper, corrected only for oxygen abundance, also agree with the H-based SFRs to within 0.056 dex scatter (Figure 2a). This suggests that the dependence on at a fixed metallicity must be weak and/or star-forming galaxies span a narrow range of . We do not consider further the effect of for star-forming galaxies.
4 Calibration of [O ii] SFR indicator in active galaxies
We perform photoionization calculations using the latest version (C17.01) of CLOUDY (Ferland et al., 2017) to predict the range of allowed values of [O ii]/[O iii] under realistic physical conditions thought to be prevalent in the NLRs. The models used here are identical to those described in Zhuang et al. (2019), who aimed to predict the intensities of [Ne ii] 12.81 µm and [Ne iii] 15.55 µm relative to [Ne v] 14.32 µm. As [Ne v] can only be excited by AGNs, the restricted range of [Ne ii]/[Ne v] and [Ne iii]/[Ne v] predicted by the photoionization models then implies that the observed strength of [Ne v] can be used to subtract the contribution of the NLR from the lower-ionization neon lines, which are sensitive to SFR (Ho & Keto, 2007). The neon-based SFRs derived for the AGN host galaxies by Zhuang et al. (2019) agree well with those estimated independently from global SED fitting.
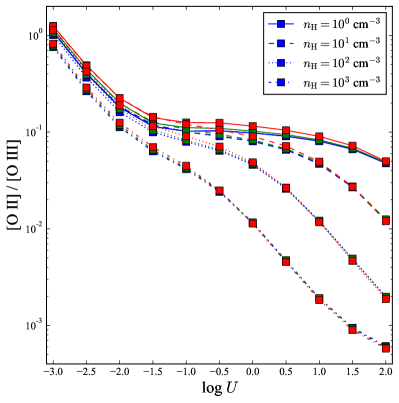
For completeness, we briefly describe the setup of our models. We use the intrinsic AGN radiation field from Scott & Stewart (2014), which is based on data compilation for a large sample of type 1 AGNs. We choose three median SEDs binned by bolometric luminosity: /erg s 46.3, 45.846.3, and 45.8. We construct isobaric, dusty and radiation pressure-dominated models by varying the radiation pressure while holding the total pressure constant. With a median , the corresponding oxygen abundance of our AGN sample is , as estimated from the [N ii]/[O ii]-based - relation of Kewley & Ellison (2008). We assume twice solar metallicity (; Allende Prieto et al., 2001) and the dust composition and size distribution of the Orion nebula. The absolute amount of dust is scaled to twice the Orion value. We vary the ionization parameter to in steps of 0.5, and we adjust the initial hydrogen density666The initial hydrogen density is the density at the illuminated surface of a cloud, which does not necessarily equal the density of where emission lines arise. In a constant-density model, the gas density stays constant from the illuminated surface to the ionization front. While in our isobaric model, when radiation pressure is dominant, the gas density increases as the radiation goes deeper into the cloud. See Figure 3 in Stern et al. (2014) for more details. from to cm-3, in steps of 1 in the logarithm.
Radiation pressure-dominated NLR models provide a successful framework for interpreting spatially resolved spectroscopic observations of nearby Seyfert galaxies. Stern et al. (2014) showed that when radiation pressure dominates the total pressure, the effective ionization parameter is 0.03, and the final gas density (see Equation 8). A radially stratified NLR arises from the tendency for forbidden transitions to emit most efficiently at densities close to their respective critical densities for collisional de-excitation (). For instance, [O iii] , with cm-3, reaches its peak emissivity at a radius 20 times smaller than that of [O ii] , which has cm-3.
Figure 3 illustrates the variation of [O ii]/[O iii] as a function of and . [O ii]/[O iii] decreases with increasing for , the regime in which the gas pressure dominates the total pressure. In this situation, the gas density remains nearly constant from the illuminated surface of the cloud to the ionization front (Stern et al., 2014). For , radiation pressure dominates the total pressure. From the definition of , increasing at fixed or increasing at fixed will have the same effect as increasing the ionizing photon density. At the same ionizing photon density (constant product of and ), [O ii]/[O iii] is almost a constant. Increasing the ionizing photon density is equivalent to putting a cloud closer to the central ionizing source. Therefore, [O ii]/[O iii] decreases with both higher ( at cm-3) and higher , due to collisional de-excitation of [O ii] at densities above its critical density. Choosing the [O ii]/[O iii] ratio at and cm-3 (to ensure that the cloud is radiation pressure-dominated but [O ii] not yet collisionally de-excited), we obtain
| (6) |
where and are purely from the NLR, which we assume to be radiation pressure-dominated, and the uncertainties reflect the different input AGN SEDs. We only use the ratio where both [O ii] and [O iii] reach their maximum emissivity, which means that the density is below of [O ii]. The true global value of [O ii]/[O iii] is likely slightly lower, considering the contribution from the inner part of the NLR, where the density is probably higher than of [O ii] and hence would produce lower [O ii]/[O iii]. Determining an accurate global value of [O ii]/[O iii] depends on the radial variation of the covering factor. A reasonable assumption of constant covering factor over radius suggests that the total emission is dominated by emission where (Stern et al., 2014). Hence, our predicted values here should be good estimates.
We assume that all of the [O iii] emission arises from the AGN, a reasonable supposition for AGN hosts, which are generally massive (metal-rich) galaxies (Ho, 2005). Combining Equations 5 and 6 yields
| (7) |
where and are the total, extinction-corrected [O ii] and [O iii] luminosities.
Strictly speaking, H ii regions, of course, also emit [O iii], but [O ii]/[O iii] increases with increasing stellar mass and increasing metallicity (Nakajima & Ouchi, 2014). In our star-forming galaxy sample, the distribution of [O ii]/[O iii] flattens and approaches a median value of 6 when . As AGNs predominantly reside in massive systems (Ho et al., 2003; Kauffmann et al., 2003b), after accounting for [O iii] emission produced by star formation with , we find that the NLR contributes 88.5% of the total [O iii] emission and 12.2% of total [O ii] emission in our AGN sample. Neglecting the [O iii] produced by star formation will induce a median difference of only 1.6% on [O ii] (increased to 13.8%), which is smaller than the uncertainties introduced by using the - relation to estimate the metallicity.
5 Discussion
5.1 Intrinsic Ratio in AGNs
Our calculations indicate that over a wide range of plausible conditions the NLR of high-ionization (highly accreting; Ho, 2009) AGNs emits a highly restricted ratio of [O ii]/[O iii] (Figure 3), and the resulting median fraction of [O ii] from AGNs in our sample is 13.8%. These values are somewhat smaller than found by other investigators. For example, Kim et al. (2006) find [O ii]/[O iii] ratios 0.034, with a typical value of 0.3. Davies et al. (2014) quote an AGN contribution to [O ii] of 40% for three nearby AGNs, and the sample of Thomas et al. (2018) indicates AGN fractions of 20% to 100%. This discrepancy can be traced to the smaller ionization parameters invoked in previous calculations (), which effectively produce constant-density models instead of radiation pressure-dominated models (Section 4). When radiation pressure does not dominate the total pressure, the local ionization parameter can be smaller than , which produces larger [O ii]/[O iii]. Here we show that the typical sizes of the radiation pressure-dominated region in the NLR are large and comparable to the dimensions directly observed in well-studied sources.
If the radiation pressure dominates the total gas pressure, the radius of the outer boundary of the NLR can be approximated by (Stern et al., 2014, their Equation 6)
| (8) |
where is the gas density in units of cm-3, is the temperature in units of K near the ionization front, and is the ionizing luminosity at 1–1000 Ryd in units of erg s-1. We use the extinction-corrected [O iii] luminosity to estimate the AGN bolometric luminosity, adopting the luminosity-dependent bolometric corrections from Lamastra et al. (2009), as parameterized by Trump et al. (2015). We infer from the three input SEDs used in our models for /erg s and for /erg s. As in Stern et al. (2014), we assume a typical interstellar medium pressure of cm-3 (Draine, 2011). For the median luminosity of our sample, /erg s, radiation pressure dominates at a radius of kpc. This estimate compares favorably with observations. Spatially resolved studies have established an empirical relation between the physical extent and the luminosity of the NLR (e.g., Bennert et al., 2002; Nascimento et al., 2019). From the radius-luminosity relation of Greene et al. (2011), the median of our sample corresponds to kpc, in reasonably good agreement with the predicted size of radiation pressure-dominated NLRs.
5.2 External Comparison of SFRs
In order to show quantitatively the robustness of our new [O ii]-based SFR estimator for AGNs, we compare our SFRs with independent values derived from the D4000 method, which depend solely on the properties of the stellar population in the host galaxy. Brinchmann et al. (2004) calibrated the relation between sSFR and D4000 in star-forming galaxies and applied it to AGNs. It is important to acknowledge that AGNs may introduce additional uncertainties. Nearby AGNs predominantly live in massive, evolved systems (e.g., Ho et al., 2003; Kauffmann et al., 2003a), a regime where the sSFR-D4000 relation suffers the largest dispersion. Moreover, scattered light from the nonstellar nucleus (e.g., Antonucci & Miller, 1985; Obied et al., 2016) contributes featureless continuum to the integrated spectrum, diluting D4000. Notwithstanding these complications, D4000 offers the only practical avenue to estimate SFRs for the SDSS AGN sample under consideration. We perform this external check in two steps, first by verifying whether our updated [O ii]-based estimator yields SFRs consistent with the H-based SFRs from the MPA-JHU catalog for star-forming galaxies, and then repeating the same cross-check for the active galaxies.
Our SFRs, following Kennicutt (1998), assume that no Lyman continuum photons are absorbed by dust. This is a reasonable approximation, validated by the overall agreement between SFRs derived from H and far-infrared continuum (Moustakas et al., 2006). Meanwhile, the MPA-JHU SFRs for star-forming galaxies, based on H, account for absorption of ionizing photons by dust within the H ii regions (Charlot & Longhetti, 2001; Charlot et al., 2002). In order to compare our [O ii]-based SFRs to those provided by the MPA-JHU catalog for AGNs, we must first ensure that our [O ii]-based SFRs for star-forming galaxies agree with their corresponding MPA-JHU SFRs. Recall, however, that the [O ii]-based SFRs involve a metallicity term. Whereas in star-forming galaxies the oxygen abundance can be inferred from [N ii]/[O ii] (Equation 3), this option is not available for AGNs because of contamination from the NLR, and we must resort to the - relation (Equation 4). To mimic as closely as possible the situation for AGNs, for this comparison our [O ii]-based SFRs for star-forming galaxies also adopt oxygen abundances estimated from the - relation. We use stellar masses from the MPA-JHU catalog.
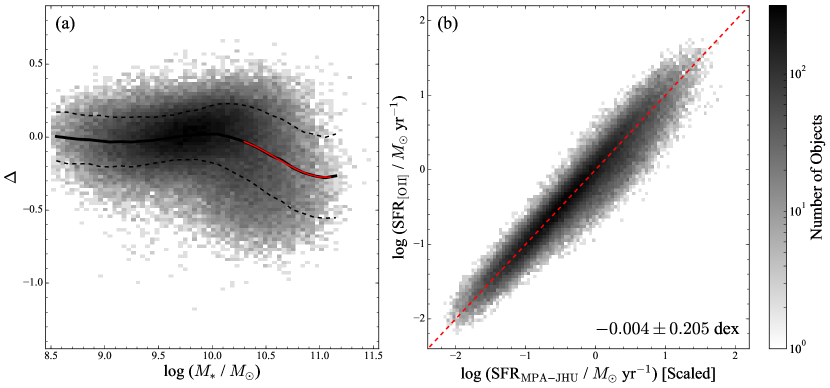
Figure 4a compares the two sets of SFRs as a function of stellar mass for star-forming galaxies. Systematic residuals are clearly present, and they depend on stellar mass. While dex for , at higher masses the residuals become large and mainly negative ( dex), reminiscent of the trend found in Brinchmann et al. (2004, their Figure 8). While plausible explanations have been offered for these trends (Charlot & Longhetti, 2001; Charlot et al., 2002; Brinchmann et al., 2004), of practical relevance here is that the systematic trend at high masses() can be removed with a third-order polynomial (Figure 4, red curve). This allows us to compare SFRs from the MPA-JHU catalog with those derived from our [O ii] method for AGNs. We do not adjust the objects with , and for objects with we set dex, the median difference at . After applying these corrections, the MPA-JHU SFRs are brought into good agreement with our [O ii]-based SFRs (Figure 4b), with the median difference for objects with brought from dex to dex.
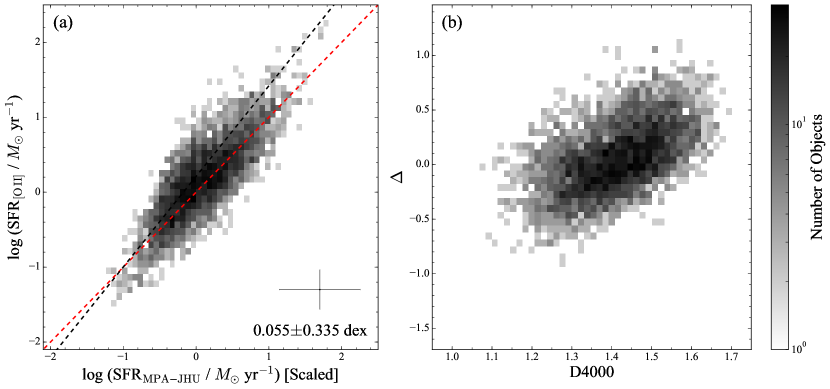
Figure 5a compares the SFRs from our [O ii] calibration for AGNs (Equation 7) with SFRs based on the D4000 method from the MPA-JHU catalog. For the sample as a whole, dex, which we regard as quite satisfactory agreement, in light of the substantial uncertainties (0.6 dex) inherent in the crude D4000-based SFRs. In detail, however, it is apparent that the two sets of measurements exhibit a slight departure from a 1:1 relation. A formal least squares fit yields a slope of 1.21 (black dashed line). Moreover, the residual difference between the [O ii]-based SFRs and MPA-JHU SFRs varies systematically with D4000 (Figure 5b). This systematic trend, which is unphysical, originates from the fact that the MPA-JHU SFRs were estimated using a relation between sSFR and D4000 originally derived for star-forming galaxies (Brinchmann et al., 2004). We verify that most of the AGNs with positive residuals (positive ) and large D4000 tend to be located below the star-forming galaxy main sequence (Noeske et al., 2007). The sSFR-D4000 relation is particularly unreliable for estimating SFRs of galaxies in this regime. This, coupled with the fact that [O ii] probes SFRs on shorter timescales than D4000, may be responsible for the residual discrepancies observed in Figure 5b, which we do not consider to be serious.
6 Summary
We use an extensive sample of star-forming galaxies and narrow-line AGNs from SDSS DR7 to investigate the use of [O ii] as a SFR indicator. The large sample enables us to probe a wide dynamic range in physical properties of galaxies, spanning 4 dex in SFR, more than 3 dex in stellar mass, and nearly 1 dex in metallicity.
Our main results are as follows:
-
•
Consistent with previous work, we show that the [O ii]/H ratio in star-forming galaxies depends strongly on metallicity. Using the better understood H SFR indicator as reference, we expand upon the work of Kewley et al. (2004) and propose a new empirical SFR calibration based on [O ii] that explicitly includes a correction for metallicity estimated from the [N ii]/[O ii] ratio.
-
•
Our [O ii]-based SFRs for star-forming galaxies show excellent consistency with SFRs obtained from H; the scatter is 0.056 dex for metallicities derived from the [N ii]/[O ii] method, increasingly only to 0.12 dex for less accurate metallicities inferred from the mass-metallicity relation.
-
•
With the aid of a set of photoionization models designed to mimic the conditions of the NLR, we demonstrate that high-ionization AGNs (e.g., Seyfert galaxies and quasars) emit a remarkably constant ratio of [O ii] /[O iii] . We introduce a new formalism for estimating SFRs in AGNs based on [O ii]. Our methodology assumes that all of the [O iii] emission arises from the NLR, a reasonable approximation for massive host galaxies.
-
•
The [O ii]-based SFRs agree reasonably well with independent SFRs derived from the stellar continuum (D4000) of the AGN host galaxies, demonstrating the robustness and effectiveness of our new method.
References
- Abazajian et al. (2009) Abazajian, K. N., Adelman-McCarthy, J. K., Agüeros, M. A., et al. 2009, ApJS, 182, 543
- Allende Prieto et al. (2001) Allende Prieto, C., Lambert, D. L., & Asplund, M. 2001, ApJ, 556, L63
- Antonucci & Miller (1985) Antonucci, R. R. J., & Miller, J. S. 1985, ApJ, 297, 621
- Argence & Lamareille (2009) Argence, B., & Lamareille, F. 2009, A&A, 495, 759
- Astropy Collaboration et al. (2013) Astropy Collaboration, Robitaille, T. P., Tollerud, E. J., et al. 2013, A&A, 558, A33
- Astropy Collaboration et al. (2018) Astropy Collaboration, Price-Whelan, A. M., Sipőcz, B. M., et al. 2018, AJ, 156, 123
- Baldwin et al. (1981) Baldwin, J. A., Phillips, M. M., & Terlevich, R. 1981, PASP, 93, 5
- Bennert et al. (2002) Bennert, N., Falcke, H., Schulz, H., Wilson, A. S., & Wills, B. J. 2002, ApJ, 574, L105
- Brinchmann et al. (2004) Brinchmann, J., Charlot, S., White, S. D. M., et al. 2004, MNRAS, 351, 1151
- Cardelli et al. (1989) Cardelli, J. A., Clayton, G. C., & Mathis, J. S. 1989, ApJ, 345, 245
- Chabrier (2003) Chabrier, G. 2003, PASP, 115, 763
- Charlot et al. (2002) Charlot, S., Kauffmann, G., Longhetti, M., et al. 2002, MNRAS, 330, 876
- Charlot & Longhetti (2001) Charlot, S., & Longhetti, M. 2001, MNRAS, 323, 887
- Davies et al. (2014) Davies, R. L., Kewley, L. J., Ho, I. T., & Dopita, M. A. 2014, MNRAS, 444, 3961
- Draine (2011) Draine, B. T. 2011, Physics of the Interstellar and Intergalactic Medium
- Ferland et al. (2017) Ferland, G. J., Chatzikos, M., Guzmán, F., et al. 2017, Rev. Mexicana Astron. Astrofis., 53, 385
- Ferrarese & Merritt (2000) Ferrarese, L., & Merritt, D. 2000, ApJ, 539, L9
- Gallagher et al. (1989) Gallagher, J. S., Bushouse, H., & Hunter, D. A. 1989, AJ, 97, 700
- Gebhardt et al. (2000) Gebhardt, K., Bender, R., Bower, G., et al. 2000, ApJ, 539, L13
- Gilbank et al. (2010) Gilbank, D. G., Baldry, I. K., Balogh, M. L., Glazebrook, K., & Bower, R. G. 2010, MNRAS, 405, 2594
- Greene et al. (2011) Greene, J. E., Zakamska, N. L., Ho, L. C., & Barth, A. J. 2011, ApJ, 732, 9
- Heckman & Best (2014) Heckman, T. M., & Best, P. N. 2014, Annual Review of Astronomy and Astrophysics, 52, 589
- Ho (2004) Ho, L. 2004, Carnegie Observatories Astrophysics 4 Volume Hardback Set (Cambridge University Press)
- Ho (2005) Ho, L. C. 2005, ApJ, 629, 680
- Ho (2008) —. 2008, ARA&A, 46, 475
- Ho (2009) —. 2009, ApJ, 699, 626
- Ho et al. (2003) Ho, L. C., Filippenko, A. V., & Sargent, W. L. W. 2003, ApJ, 583, 159
- Ho & Keto (2007) Ho, L. C., & Keto, E. 2007, ApJ, 658, 314
- Hunter (2007) Hunter, J. D. 2007, Computing in Science & Engineering, 9, 90
- Jansen et al. (2000a) Jansen, R. A., Fabricant, D., Franx, M., & Caldwell, N. 2000a, ApJS, 126, 331
- Jansen et al. (2000b) Jansen, R. A., Franx, M., Fabricant, D., & Caldwell, N. 2000b, ApJS, 126, 271
- Jones et al. (2001–) Jones, E., Oliphant, T., Peterson, P., et al. 2001–, SciPy: Open source scientific tools for Python, , , [Online; accessed 2019-05-27]
- Kauffmann et al. (2003a) Kauffmann, G., Heckman, T. M., White, S. D. M., et al. 2003a, MNRAS, 341, 33
- Kauffmann et al. (2003b) Kauffmann, G., Heckman, T. M., Tremonti, C., et al. 2003b, MNRAS, 346, 1055
- Kennicutt & Evans (2012) Kennicutt, R. C., & Evans, N. J. 2012, ARA&A, 50, 531
- Kennicutt (1992) Kennicutt, Jr., R. C. 1992, ApJ, 388, 310
- Kennicutt (1998) —. 1998, ARA&A, 36, 189
- Kennicutt et al. (2009) Kennicutt, Jr., R. C., Hao, C.-N., Calzetti, D., et al. 2009, ApJ, 703, 1672
- Kewley & Dopita (2002) Kewley, L. J., & Dopita, M. A. 2002, ApJS, 142, 35
- Kewley & Ellison (2008) Kewley, L. J., & Ellison, S. L. 2008, ApJ, 681, 1183
- Kewley et al. (2004) Kewley, L. J., Geller, M. J., & Jansen, R. A. 2004, AJ, 127, 2002
- Kewley et al. (2005) Kewley, L. J., Jansen, R. A., & Geller, M. J. 2005, PASP, 117, 227
- Kim et al. (2006) Kim, M., Ho, L. C., & Im, M. 2006, ApJ, 642, 702
- Kong & Ho (2018) Kong, M., & Ho, L. C. 2018, ApJ, 859, 116
- Kormendy & Ho (2013) Kormendy, J., & Ho, L. C. 2013, ARA&A, 51, 511
- Kroupa (2001) Kroupa, P. 2001, MNRAS, 322, 231
- Lamastra et al. (2009) Lamastra, A., Bianchi, S., Matt, G., et al. 2009, A&A, 504, 73
- Madau & Dickinson (2014) Madau, P., & Dickinson, M. 2014, ARA&A, 52, 415
- Magorrian et al. (1998) Magorrian, J., Tremaine, S., Richstone, D., et al. 1998, AJ, 115, 2285
- Moustakas et al. (2006) Moustakas, J., Kennicutt, Jr., R. C., & Tremonti, C. A. 2006, ApJ, 642, 775
- Nakajima & Ouchi (2014) Nakajima, K., & Ouchi, M. 2014, MNRAS, 442, 900
- Nascimento et al. (2019) Nascimento, J. C. d., Storchi-Bergmann, T., Mallmann, N. D., et al. 2019, MNRAS, 486, 5075
- Noeske et al. (2007) Noeske, K. G., Weiner, B. J., Faber, S. M., et al. 2007, ApJ, 660, L43
- Obied et al. (2016) Obied, G., Zakamska, N. L., Wylezalek, D., & Liu, G. 2016, MNRAS, 456, 2861
- Oliphant (2006) Oliphant, T. E. 2006, A guide to NumPy, Vol. 1 (Trelgol Publishing USA)
- Osterbrock & Ferland (2006) Osterbrock, D. E., & Ferland, G. J. 2006, Astrophysics of gaseous nebulae and active galactic nuclei
- Pagel et al. (1979) Pagel, B. E. J., Edmunds, M. G., Blackwell, D. E., Chun, M. S., & Smith, G. 1979, MNRAS, 189, 95
- Reyes et al. (2008) Reyes, R., Zakamska, N. L., Strauss, M. A., et al. 2008, AJ, 136, 2373
- Richstone et al. (1998) Richstone, D., Ajhar, E. A., Bender, R., et al. 1998, Nature, 395, A14
- Salim et al. (2007) Salim, S., Rich, R. M., Charlot, S., et al. 2007, ApJS, 173, 267
- Salim et al. (2016) Salim, S., Lee, J. C., Janowiecki, S., et al. 2016, ApJS, 227, 2
- Salpeter (1955) Salpeter, E. E. 1955, ApJ, 121, 161
- Scott & Stewart (2014) Scott, A. E., & Stewart, G. C. 2014, MNRAS, 438, 2253
- Stern et al. (2014) Stern, J., Laor, A., & Baskin, A. 2014, MNRAS, 438, 901
- Thomas et al. (2018) Thomas, A. D., Kewley, L. J., Dopita, M. A., et al. 2018, ApJ, 861, L2
- Tremonti et al. (2004) Tremonti, C. A., Heckman, T. M., Kauffmann, G., et al. 2004, ApJ, 613, 898
- Trump et al. (2015) Trump, J. R., Sun, M., Zeimann, G. R., et al. 2015, ApJ, 811, 26
- Weiner et al. (2007) Weiner, B. J., Papovich, C., Bundy, K., et al. 2007, ApJ, 660, L39
- York et al. (2000) York, D. G., Adelman, J., Anderson, Jr., J. E., et al. 2000, AJ, 120, 1579
- Zaritsky et al. (1994) Zaritsky, D., Kennicutt, Jr., R. C., & Huchra, J. P. 1994, ApJ, 420, 87
- Zhuang et al. (2019) Zhuang, M.-Y., Ho, L. C., & Shangguan, J. 2019, ApJ, 873, 103