3.8 m Imaging of 400 – 600 K Brown Dwarfs and
Orbital Constraints for WISEP J045853.90+643452.6AB
Abstract
Half of the energy emitted by late-T- and Y-type brown dwarfs emerges at m . We present new (m) photometry obtained at the Gemini North telescope for nine late-T and Y dwarfs, and synthesize from spectra for an additional two dwarfs. The targets include two binary systems which were imaged at a resolution of 025. One of these, WISEP J045853.90643452.6AB, shows significant motion, and we present an astrometric analysis of the binary using Hubble Space Telescope, Keck Adaptive Optics, and Gemini images. We compare m observations to models, and find that the model fluxes are too low for brown dwarfs cooler than 700 K. The discrepancy increases with decreasing temperature, and is a factor of 2 at K and 4 at K. Warming the upper layers of a model atmosphere generates a spectrum closer to what is observed. The thermal structure of cool brown dwarf atmospheres above the radiative-convective boundary may not be adequately modelled using pure radiative equilibrium; instead heat may be introduced by thermochemical instabilities (previously suggested for the L- to T-type transition) or by breaking gravity waves (previously suggested for the solar system giant planets). One-dimensional models may not capture these atmospheres, which likely have both horizontal and vertical pressure/temperature variations.
1 Introduction
Brown dwarfs form the extended low-mass tail of the stellar initial mass function, and brown dwarfs as low-mass as four Jupiter-masses () have been found in young clusters and associations (e.g., Best et al., 2017; Esplin & Luhman, 2017). The difference between giant planet and brown dwarf formation is an active research area (e.g., Nielsen et al., 2019; Schlaufman, 2018; Wagner et al., 2019). Brown dwarfs have the compositions of stars, but the physics and chemistry of their atmospheres are complex and resemble those of giant planets (e.g., Line et al., 2015; Morley et al., 2014b).
The thermal radiation of a brown dwarf escapes through an atmosphere that is rich in molecules. Light emerges through windows between the broad molecular absorption bands. One of these windows spans m ; for late-type T and Y dwarfs with effective temperature () less than 600 K (e.g., Beichman et al., 2014; Dupuy & Kraus, 2013; Kirkpatrick et al., 2012), 40 – 60% of the total energy emerges through this single window. The W2 filter of the Wide-field Infrared Survey Explorer (WISE, Wright et al., 2010) is centered at m and the coldest known objects outside of the solar system have been discovered by WISE (Cushing et al., 2011; Luhman, 2014). This paper presents new ground-based photometry of cool brown dwarfs using the Maunakea Observatories (MKO) filter, which is centered at m (Tokunaga et al., 2002). In this paper we combine the new photometry with published data to explore the important m spectral region.
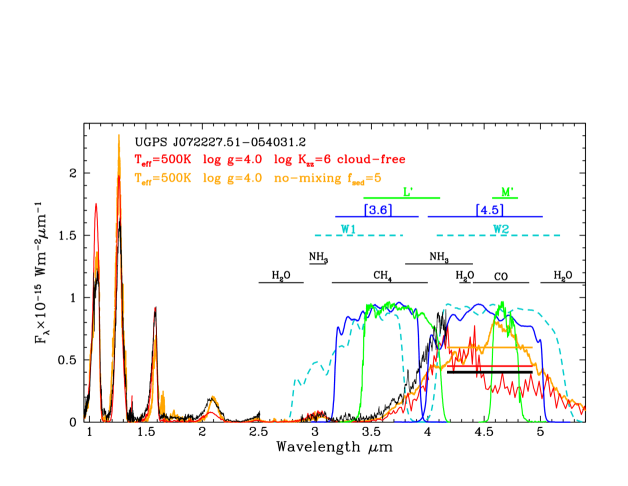
Figure 1 shows the observed and synthetic m spectrum of the 500 K brown dwarf UGPS J072227.51054031.2 (hereafter 0722, Leggett et al., 2012; Lucas et al., 2010). The bandpasses for the Spitzer [3.6] and [4.5], WISE W1 and W2, and ground-based MKO and filters are also shown. The figure shows that these bandpasses sample slightly different regions of the m spectrum and shows also that the spectrum is heavily sculpted by strong absorption bands. At m the atmosphere is opaque; this is the region with the strong P-, Q- and R-branches of the band of methane and the flux emerges from the cold upper layers of the atmosphere. At m the brown dwarf is bright, the atmosphere is transparent, and flux emerges from very deep, hot, high-pressure regions of the atmosphere. The 3 – 5 m colors of brown dwarfs can therefore provide information on very physically different layers of the atmosphere. The figure also illustrates the long-standing problem, for brown dwarfs cooler than 700 K, of significant shortfall in modelled flux at m (Leggett et al., 2010b, 2012, 2013, 2015, 2017; Luhman & Esplin, 2016). We explore this problem later in the paper.
Although space missions are more sensitive than ground-based observatories in the mid-infrared, the WISE and Spitzer cameras have relatively poor angular resolution with full-width half-maxima (FWHMs) of for W1 and W2 (Wright et al., 2010) and for [3.6] and [4.5] (Fazio et al., 2004). This means that source confusion can be a problem, and close binary systems cannot be resolved. Cold brown dwarfs and in particular binaries containing cold brown dwarfs, which can test both atmospheric and evolutionary models, are prime targets for the upcoming James Webb Space Telescope (JWST) mission. The brown dwarf imaging presented here has a resolution of 025 to 10 and will be used to improve JWST observation specifications.
Section 2 of this paper presents the new photometry. Section 3 gives the astrometric data for WISEP J045853.90+643452.6AB (hereafter 0458AB) and presents preliminary orbital constraints for the system. In Section 4 we use astrometric and photometric properties to constrain the masses and ages of the 0458AB and WISEPC J121756.91162640.2AB (hereafter 1217AB) binary systems. In Section 5 we examine the discrepancy between the models and the observations in this waveband. Our conclusions are given in Section 6. The Appendix presents ground-based and space-based 3 – 5 m colors for T and Y dwarfs, so that these datasets can be more easily utilized in the future.
2 Photometry of Brown Dwarfs
2.1 Existing Data
photometry of brown dwarfs with spectral type later than T6 has been published by: Burningham et al. (2009); Geballe et al. (2001); Golimowski et al. (2004); Leggett et al. (2002, 2007). In the next two subsections we present new observations and synthesized photometry from observed spectra. Figure 2 is a color-magnitude diagram which shows as a function of [3.6] [4.5] (see Figure 1 for bandpasses). The Spitzer data are taken from Kirkpatrick et al. (2019); Leggett et al. (2017); Martin et al. (2018) and references therein, the trigonometric parallaxes are taken from Kirkpatrick et al. (2019); Leggett et al. (2017); Martin et al. (2018); Smart et al. (2018); Theissen (2018) and references therein. T and Y dwarfs with photometry presented here are identified.

| WISE | Program | Date | Exposure |
|---|---|---|---|
| Name | Number | YYYMMDD | minutes |
| J000517.48373720.5 | GN-2018B-FT-112 | 20181207 | 8.9 |
| J031325.96780744.2 | GN-2018B-FT-112 | 20181223 | 9.2 |
| J041022.75150247.9 | GN-2018B-FT-112 | 20181207 | 39.0 |
| J045853.90+643452.6AB | GN-2017B-FT-15 | 20171224 | 22.8 |
| J121756.91162640.2AB | GN-2017B-FT-15 | 20180102 | 26.0 |
| J140518.32553421.3 | GN-2018B-FT-112 | 20181223 | 31.4 |
| J205628.88145953.6 | GN-2018B-FT-112 | 20181207 | 15.2 |
2.2 Gemini Observations
photometry was obtained using the Gemini Observatory near-infrared imager (NIRI, Hodapp et al., 2003) on the Gemini North telescope. Two binary systems that are targets for JWST Guaranteed Time Observations were observed via program GN-2017B-FT-15 in excellent natural seeing in order to resolve the binary components: 0458AB and 1217AB. Five (notionally) single brown dwarfs were observed via program GN-2018B-FT-112 in poorer seeing: WISE J000517.48373720.5, WISEPA J031325.96780744.2, WISEA J041022.75150247.9, WISEA J140518.32553421.3 and WISEA J205628.88145953.6. In the rest of this paper we shorten the object names to the first four digits of the Right Ascension values. For GN-2018B-FT-112, brown dwarfs later than T8 with [3.6] 17 mag that were accessible at the Gemini North telescope were selected. The targets were also chosen in order to sample the brightness and color space of Figure 2. No evidence of binarity was seen in the GN-2018B-FT-112 images, for which the seeing was typically .
Table 1 lists the targets, program number, date of observation, and total exposure time. All nights were photometric. Individual exposures were 19 s, composed of 24 coadded 0.8 s frames. NIRI was used in f/32 mode, with a pixel size of and a field of view of 20”. Targets and photometric standards were observed in a fixed 5-position grid pattern with 3” telescope offsets. The photometric standards were selected from the Leggett et al. (2003) catalog and were observed immediately before or after the brown dwarf at a similar airmass.


To compensate for the variable sky background at , adjacent frames were subtracted for each target and photometric standard, and then stacked using the known telescope offsets. The single brown dwarfs were observed on nights with seeing typically . Aperture photometry with annular sky regions was carried out using apertures of diameter – , corresponding to the seeing on the night of observation. Aperture corrections were determined from the photometric standards observed close in time and airmass to the science target.
The two binary systems were observed on nights of excellent seeing. Figure 3 shows the images of the two binary systems. The components of 0458AB were found to be very close at the epoch of observation. Figure 4 shows the image of 0458AB smoothed by pixel binning. Contours are overlaid, and the two photometric on-source apertures of diameter are shown. The contributions to the signal from the background and the other binary component were determined from the radial profile of each source and the outer pixels, for each component. 1217AB is well-separated in the NIRI images (Figure 3) and aperture photometry with annular skies was carried out, using an aperture diameter of . Aperture corrections were determined from the observations of the photometric standards. For both binary systems, the magnitude measurement for each component is consistent with a large-aperture measurement of the system, within the uncertainties.
| Date UT | Separation mas | PA degrees | Instrument/Observatory |
|---|---|---|---|
| 2012 Jan 29aaWeighted mean of six measurements in different filters, Liu et al. (2012). | 758.0 0.8 | 14.37 0.07 | NIRC2LGS/Keck II |
| 2018 Jan 02 | 881 3 | 8.7 0.3 | NIRI/Gemini North |
The 0458AB system has shown significant motion compared to previous imaging, and in the next Section we constrain its orbit. The 1217AB system does not show significant motion and the orbit cannot be constrained. For future reference, Table 2 gives the separation and position angle of this binary measured from the NIRI image presented here, and the values of these parameters in 2012, measured by Liu et al. (2012) using Keck laser guide star adaptive optics (LGS AO, Bouchez et al., 2004; Wizinowich et al., 2006). Table 3 lists our photometry for the nine brown dwarfs.
| Name | Spectral | ||
|---|---|---|---|
| Type | mag | ||
| WISE J000517.48373720.5 | T8.5 | 14.43 | 0.10 |
| WISEPA J031325.96780744.2 | T9 | 14.13 | 0.11 |
| WISEA J041022.75150247.9 | Y0 | 15.39 | 0.06 |
| WISEP J045853.90643452.6A | T8.5 | 14.50 | 0.10 |
| WISEP J045853.90643452.6B | T9 | 14.81 | 0.15 |
| UGPS J072227.51054031.2aa photometry was synthesized from flux-calibrated spectra. | T9 | 13.13 | 0.15 |
| WISE J085510.83071442.5aa photometry was synthesized from flux-calibrated spectra. | Y | 16.31 | 0.15 |
| WISEPC J121756.91162640.2A | T9 | 14.68 | 0.02 |
| WISEPC J121756.91162640.2B | Y0 | 15.62 | 0.05 |
| WISEA J140518.32553421.3 | Y0.5 | 15.56 | 0.11 |
| WISEA J205628.88145953 | Y0 | 14.87 | 0.12 |
2.3 Synthetic Photometry
photometry was synthesized from spectra of 0722 and WISE J085510.83−071442.5 (hereafter 0855). The m spectrum of 0722 was published by Leggett et al. (2012) and the m spectrum of 0855 was published by Morley et al. (2018); each was flux calibrated using Spitzer [3.6] photometry. We assumed a zero flux contribution for m for 0855 (see Figure 1). Table 3 lists the synthesized photometry. Uncertainties were determined from the noise in the spectra and the uncertainty in the calibration photometry.
3 The Orbit of 0458AB
3.1 Astrometric Monitoring of 0458AB
3.1.1 Keck LGS AO
We obtained resolved images of 0458AB at four epochs using the facility infrared imager NIRC2 with the LGS AO system at the Keck II telescope (Bouchez et al., 2004; Wizinowich et al., 2006). For the first two epochs in 2011 and 2012 we used NIRC2’s wide camera ( mas pix-1). The second two epochs in 2018 were obtained after the Gemini imaging with NIRC2’s narrow camera ( mas pix-1). For the 2011 and 2018 data sets we used the CH4s filter, centered on the -band flux peak for T dwarfs (m, m), and for the 2012 data set we used the -band filter (see Appendix of Liu et al., 2012).


We derived binary parameters from our imaging data in the same fashion as in our past work, using a three-component 2D-Gaussian model for PSF fitting and adopting the rms among individual images at a given epoch for the uncertainties in those parameters (e.g., Dupuy et al., 2014; Liu et al., 2006). To convert the instrumental measurements into angular separations and position angles (PAs), we used the same methods as in Dupuy et al. (2016) and Dupuy & Liu (2017). We used the calibration of Fu et al. (2012, priv. comm.)111http://astro.physics.uiowa.edu/~fu/idl/nirc2wide/ for the first two epochs and the calibration of Service et al. (2016) for the second two epochs. We add to our PAs as a correction for the orientation of NIRC2 for data obtained after the AO system realignment in 2015 April (Service et al., 2016), and prior to that (Yelda et al., 2010). Figure 5 shows typical images from all four epochs, and Table 4 reports our derived relative astrometry.
| Date UT | Tel./Inst. | Sep. mas | PA degree | Filter | mag | Ref. |
|---|---|---|---|---|---|---|
| 2010 Mar 24 | Keck/NIRC2 | , | , | G11 | ||
| 2011 Feb 3 | Keck/OSIRIS | B12 | ||||
| 2011 Apr 22 | Keck/NIRC2 | * | ||||
| 2011 Aug 29 | Keck/NIRC2 | , , | , , | B12 | ||
| 2012 Jan 14 | Keck/NIRC2 | * | ||||
| 2012 Feb 27 | HST/ACS-WFC | , | , | * | ||
| 2015 Jan 2 | HST/WFC3-IR | * | ||||
| 2017 Dec 27 | Gemini-N/NIRI | * | ||||
| 2018 Jan 6 | Keck/NIRC2 | * | ||||
| 2018 Oct 18 | Keck/NIRC2 | * |
| Observation Date | Right Ascension | Declination | Airmass | Seeing | |||
|---|---|---|---|---|---|---|---|
| UT | MJD | deg | deg | mas | mas | arcsec | |
| 2011 Feb 11 | 55603.2484 | 074.72535576 | 2.8 | 5.4 | 1.408 | 1.10 | |
| 2011 Sep 18 | 55822.6268 | 074.72556256 | 2.8 | 4.0 | 1.415 | 0.77 | |
| 2011 Sep 23 | 55827.6297 | 074.72556591 | 2.8 | 2.4 | 1.409 | 0.83 | |
| 2013 Oct 20 | 56585.5370 | 074.72581431 | 1.6 | 2.1 | 1.416 | 0.65 | |
| 2013 Dec 11 | 56637.4207 | 074.72577737 | 2.2 | 6.1 | 1.409 | 0.97 | |
| 2014 Oct 9 | 56939.5323 | 074.72594986 | 2.0 | 3.5 | 1.463 | 0.61 | |
| 2014 Oct 13 | 56943.5591 | 074.72594815 | 4.8 | 3.0 | 1.415 | 0.71 | |
| 2014 Oct 15 | 56945.5697 | 074.72594499 | 2.9 | 2.5 | 1.409 | 0.64 | |
Note. — The quoted uncertainties correspond to relative, not absolute, astrometric errors.
3.1.2 HST Imaging
We analyzed archival HST images from two epochs. On 2012 Feb 27 UT the program GO-12504 (PI: Liu) observed 0458AB with ACS-WFC as a PSF reference source, and on 2015 Jan 2 UT the program GO-13705 (PI: Patience) obtained pre-imaging with WFC3-IR for their spectroscopic observations. For the ACS-WFC data, we use only the higher signal-to-noise ratio (SNR) imaging. We analyzed the ACS-WFC images as described in Section 3.1.2 of Dupuy & Liu (2017), using TinyTim-based (Krist et al., 2011) PSF-fitting. For the WFC3-IR data, we used the appropriate TinyTim PSFs for that instrument as in our previous work (e.g., Dupuy et al., 2009b, a; Liu et al., 2008). We used the D2IMARR and WCSDVARR FITS extensions and the CD matrices of the headers to convert our measured into separations and PAs. Table 4 reports the mean and rms of the mean obtained from individual exposures as our best-fit values and uncertainties.
3.1.3 CFHT/WIRCam
We obtained eight epochs of wide-field, unresolved imaging of 0458AB using the facility infrared camera WIRCam (Puget et al., 2004) at the Canada-France-Hawaii Telescope (CFHT) as part of our ongoing Hawaii Infrared Parallax Program. We used an exposure time of 60 s in the band and achieved SNR = 40–70. We measured positions using SExtractor (Bertin & Arnouts, 1996) and converted these to relative astrometry using a custom pipeline described in our previous work (Dupuy & Liu, 2012; Liu et al., 2016). The absolute calibration of the linear terms of our astrometric solution was derived by matching low proper motion sources ( mas yr-1) to the 2MASS point source catalog (Cutri et al., 2003). To convert our relative parallax and proper motion to an absolute frame, we use the mean parallax and proper motion of stars simulated by the Besançon model of the Galaxy (Robin et al., 2003), selecting stars over the same range of apparent magnitudes as in the data. The variance in the conversion from relative to absolute is determined by using many different subsets of model stars. The resulting astrometry for 0458AB in integrated light is given in Table 5.

| Property | Median 1 | 95.4% c.i. | Prior |
|---|---|---|---|
| Fitted parameters | |||
| Orbital period, [yr] | 23, 63 | (log-flat) | |
| Semimajor axis, [mas] | 450, 630 | (log-flat) | |
| 0.5, 0.7 | uniform | ||
| 0.31, 0.61 | uniform | ||
| Inclination, [°] | 71.7, 80.5 | , [°] | |
| PA of the ascending node, [°] | 125.7, 134.8 | uniform | |
| Mean longitude at JD, [°] | 171, 245 | uniform | |
| [mas] | 210, 120 | uniform, | |
| [mas] | 150, 270 | uniform, | |
| Relative proper motion in R.A., [mas yr-1] | 167, 222 | uniform | |
| Relative proper motion in decl., [mas yr-1] | 282, 316 | uniform | |
| Relative parallax, [mas] | 104.4, 111.0 | ||
| Ratio of photocenter orbit to semimajor axis, | 0.62, 0.47 | uniform | |
| Computed properties | |||
| Eccentricity, | 0.00, 0.56 | ||
| Argument of periastron, [°] | 0, 350 | ||
| Time of periastron, [JD] | 1964, 2018 | ||
| Photocenter semimajor axis, [mas] | 340, 250 | ||
| [arcsec3 yr-2] | 0.44, 1.87 | ||
| Correction to absolute R.A. proper motion, [mas yr-1] | 0.19, 0.76 | ||
| Correction to absolute decl. proper motion, [mas yr-1] | 1.13, 0.43 | ||
| Correction to absolute parallax, [mas] | 0.541, 0.630 | ||
| Absolute proper motion in R.A., aaThe absolute parallax, proper motion in RA and proper motion in Declination are consistent with the values determined from Spitzer images by Kirkpatrick et al. (2019), which are , and , respectively. [mas yr-1] | 168, 223 | ||
| Absolute proper motion in decl., aaThe absolute parallax, proper motion in RA and proper motion in Declination are consistent with the values determined from Spitzer images by Kirkpatrick et al. (2019), which are , and , respectively. [mas yr-1] | 281, 315 | ||
| Absolute parallax, aaThe absolute parallax, proper motion in RA and proper motion in Declination are consistent with the values determined from Spitzer images by Kirkpatrick et al. (2019), which are , and , respectively. [mas] | 105.1, 111.7 | ||
| Distance, [pc] | 8.96, 9.52 | ||
| Semimajor axis, [AU] | 4.2, 5.9 | ||
| Total mass, [] | 36, 156 | ||
Note. — The full 13-parameter fit has (23 dof), and the relative orbit has (13 dof). The orbit quality metrics defined by Dupuy & Liu (2017) are dex, , and , indicating a poorly constrained orbit determination. ML is Maximum Likelihood.
| Date UT | Separation mas | PA degrees | Date UT | Separation mas | PA degrees |
|---|---|---|---|---|---|
| 2019 Sep 1 | 2022 Jan 1 | ||||
| 2020 Jan 1 | 2022 Mar 1 | ||||
| 2020 Mar 1 | 2022 Sep 1 | ||||
| 2020 Sep 1 | 2023 Jan 1 | ||||
| 2021 Jan 1 | 2023 Mar 1 | ||||
| 2021 Mar 1 | 2023 Sep 1 | ||||
| 2021 Sep 1 | 2024 Jan 1 | ||||
| 2024 Mar 1 |

3.2 The Orbit, Parallax, and Proper Motion of 0458AB
We combined our resolved astrometry with other published measurements and our integrated-light astrometry in a single analysis, fitting the orbit, parallax, and proper motion. The approach is very similar to our past work (Dupuy et al., 2015; Dupuy & Liu, 2017). Six of the thirteen parameters are shared between the resolved and integrated-light data, all relating to orbit: period (), eccentricity () and argument of periastron () parametrized as and , inclination (), PA of the ascending node (), and mean longitude at the reference epoch (), defined to be 2010 January 1 00:00 UT (2455197.5 JD). There are two parameters for orbit size; the semimajor axis () in angular units, and the ratio of the semimajor axis of the CFHT photocenter orbit to (). The five remaining parameters are all related to the CFHT astrometry: parallax (), proper motion () in Right Ascension and Declination, and the Right Ascension and Declination at the reference epoch . The only parameters without uniform priors were and (log-flat), (, random viewing angles), and an approximately uniform space density ().
We use the parallel-tempering Markov chain Monte Carlo (PT-MCMC) ensemble sampler in emcee v2.1.0 (Foreman-Mackey et al., 2013) that is based on the Earl & Deem (2005) algorithm. “Hot” chains explore essentially all of the allowed parameter space between solutions, while “cold” chains find local minima. Information is exchanged between chains and the solution is the “coldest” of 30 chains. We use 100 walkers to sample our 13-parameter model over steps. The initial state is a random, uniform draw over all of parameter space for bounded parameters: , , , , ; ; ; ; 100 mas around the reference epoch Right Ascension and Declination; 30% around the relative proper motion; and 20% around the relative parallax. The resulting distributions of posteriors are shown in Figure 6 and summarized in Table 6. Figure 7 displays the orbit and Table 7 gives estimates of future configurations of the system.
It should be noted that the total dynamical mass is not well measured from the current data spanning 8.6 years. The derived mass is dependent on the choice of priors for parameters such as period, semimajor axis, and eccentricity. Under our current assumptions, the minimum system mass is 36 (2), suggesting that neither of the components is planetary mass (). One reliable prediction from our orbit analysis is that the separation will continue increasing for the next few years, at least until 2021, the nominal launch year of JWST (Figure 7, Table 7). Our analysis also provides the first parallax measurement for 0458AB that properly accounts for orbital motion, although we do not detect significant astrometric perturbations in our CFHT data over more than three years.
4 Constraints on the Properties of 0458AB and 1217AB from Photometry
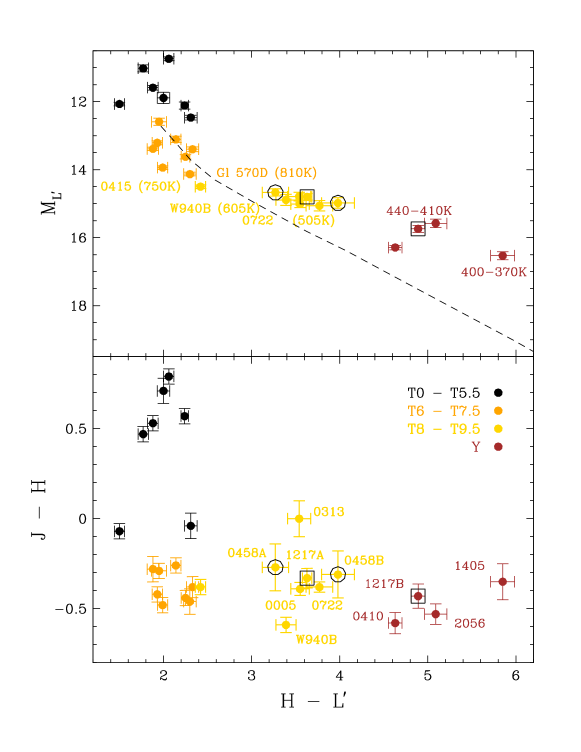
Figure 8 is a color-magnitude and color-color plot using the 1 – 4 m photometry of T and Y dwarfs. Brown dwarfs with 750 K () show a brightening at m relative to the near-infrared. The components of the 0458AB and 1217AB binaries have colors typical of late-T and Y dwarfs, suggesting that their composition and age are typical of a field population. Figure 8 shows that, as would be expected, the T8.5 0458A lies in a similar region of the color-magnitude diagrams as the T8.5 Wolf 940B, and the T9 0458B lies in a similar region as the T9 0722. The T9 1217A also lies in a similar region as the T9 0722, and the Y0 1217B is similar to the Y0 2056.
| , log | |||||||
|---|---|---|---|---|---|---|---|
| Name | Age=0.6 | 1.0 | 3.0 | 4.0 | 6.0 | 8.0 | 10.0 Gyr |
| 0458A | 9, 4.4 | 15, 4.5 | 25, 4.8 | 28, 4.9 | 34, 5.0 | 37, 5.1 | 41, 5.2 |
| 0458B | 12, 4.3 | 11, 4.4 | 19, 4.7 | 22, 4.8 | 26, 4.9 | 29, 5.0 | 32, 5.0 |
| 1217A | 12, 4.3 | 11, 4.4 | 19, 4.7 | 22, 4.8 | 26, 4.9 | 29, 5.0 | 32, 5.0 |
| 1217B | 7, 4.1 | 9, 4.3 | 15, 4.6 | 17, 4.6 | 20, 4.7 | 23, 4.8 | 25, 4.9 |
Wolf 940B is a benchmark object, with age and composition constrained by its distant M dwarf companion. A large amount of data is available for Wolf 940B, including a mid-infrared spectrum from Spitzer. The studies by Burningham et al. (2009) and Leggett et al. (2010a) show this T8.5 to have K, log (cm s-2) and a metallicity within 0.2 dex of solar. 0722 is bright and has also been well studied, although it does not have a stellar companion or a spectrum beyond m. Leggett et al. (2012) and Lucas et al. (2010) find for 0722 that K, log and metallicity is close to solar. For the Y dwarfs, the study of near-infrared spectra and mid-infrared photometry by Leggett et al. (2017) shows that 2056 has K, log and metallicity is solar or slightly super-solar.
Using Wolf 940B, 0722 and 2056 as reference objects, the photometric comparison indicates that 0458A has K, 0458B and 1217A have K, and 1217B has K; the values for the 1217AB system are consistent with previous analyses (e.g., Leggett et al., 2014). Assuming that the binary components have the same age, evolutionary models can be used to constrain gravities and masses for the two systems. Table 8 lists these values as a function of age.
Our preliminary orbit for 0458AB gives a total mass for the system of (, Table 6). Combining the astrometry with the observed photometric difference of mag (Burgasser et al., 2012) constrains the individual masses to and (). Note that when the photocenter orbit is poorly constrained, as it is here (Table 6), the uncertainties in the individual masses are large. Assuming coevality and K for the primary and K for the secondary, the evolutionary models give a broad age range for this system of 3 – 13 Gyr (Table 8). For the 1217AB system, fits to the near-infrared spectrum and mid-infrared photometry of 1217B constrain the likely age to be 0.7 – 6 Gyr (Leggett et al., 2017). The tangential velocities of the 0458AB and 1217AB systems are km s-1 (Table 6) and km s-1 (Leggett et al., 2017) respectively, suggesting thin disk membership and an age 10 Gyr (Dupuy & Liu, 2012; Robin et al., 2003). Adopting a likely age of a few Gyr for both systems, the masses of the primary and secondary are around 35 and 25 for 0458AB, and around 20 and 15 for 1217AB.
5 The micron Problem
All available atmospheric models predict fluxes in the m region that are too low for the late-T and Y dwarfs. These include the cloud-free non-equilibrium chemistry models of Marley et al. (2002), the cloud-free chemical equilibrium models with updated opacities of Saumon et al. (2012), the cloudy chemical equilibrium models of Morley et al. (2012, 2014b), and the cloud-free non-equilibrium chemistry models with updated opacities of Tremblin et al. (2015), as demonstrated by Leggett et al. (2010b, 2012, 2013, 2015, 2017) and Luhman & Esplin (2016). The discrepancy is illustrated in Figure 1 for the K object 0722 (Leggett et al., 2012).
In Figure 1 we show the observed spectrum, and synthetic spectra generated by the models of Morley et al. (2012) and Tremblin et al. (2015), for this 500 K brown dwarf. These two sets of model grids are the best available at this temperature, at the time of writing; the former includes clouds but not the non-equilibrium chemistry brought about by mixing, and the latter includes non-equilibrium chemistry but does not include clouds (work on a grid of model atmospheres that includes both clouds and non-equilibrium chemistry is ongoing by members of our team (Marley et al., 2017)). Morley et al. (2012, 2014b) show that clouds of chloride and sulfide condensates are important for K , and water clouds are important for K. The effect of the clouds is primarily a reduction in the m flux with that energy redistributed to longer wavelengths (Morley et al., 2012, 2014b). Vertical mixing in brown dwarf atmospheres leads to an increase in the abundances of the more stable CO and N2, and a decrease in the abundances of the less stable CH4 and NH3 (e.g., Saumon et al., 2006). The resulting non-equilibrium chemistry has been shown to be important for both T and Y dwarfs (Leggett et al., 2007, 2015; Saumon et al., 2006, 2007; Stephens et al., 2009). The decrease in NH3 absorption leads to an increase in near-infrared flux, especially in the -band, and an increase in flux at m, while the increase in CO absorption leads to less flux at m (e.g. Figure 1; Saumon et al., 2006; Morley et al., 2014b).
Figure 1 suggests that cloudy models are required to reproduce the -band flux, which is the wavelength most impacted by clouds at this temperature (Morley et al., 2014b). Non-equilibrium chemistry is required to reproduce the -band shape and the 4.5 m flux. Neither model reproduces the shape of the -band flux peak and both models are deficient at m. In this work we use as a primary reference the non-equilibrium models of Tremblin et al. (2015); this is because the dominant opacities at m consist of carbon- and nitrogen-bearing molecules (Figure 1), and clouds (as currently modelled) do not significantly impact this wavelength region.
The upper panel of Figure 8 explores the colors of T and Y dwarfs, and shows the color sequence generated by the Tremblin et al. (2015) models. This comparison suggests that the m flux discrepancy starts at K and increases to lower temperatures. Figure 8 suggests that at the models are too faint by mag at 500 K, and too faint by mag at 400 K.

To explore this further, Figure 9 compares observed -band spectra to synthetic spectra generated by Tremblin et al. (2015) models. Observed spectra are shown for 2MASS J041519540935066 (hereafter 0415, Sorahana & Yamamura, 2012), 0722 (Leggett et al., 2012), and 0855 (Morley et al., 2018). The synthetic spectra have atmospheric parameters similar to those of the three targets (see the Figure 9 legends). The top panel of Figure 9 show that, as expected, the synthetic and observed spectra agree quite well at K. However for cooler atmospheres there is a significant discrepancy. Although the principal opacity appears to be CH4 in both the observed and synthetic spectra, the observed slope is flatter than the calculated slope. The strong absorption features at m (see also Figure 1) deepen with decreasing , but the fluxes between the absorption features are much higher than calculated.
In their analysis of the cold brown dwarf 0855, Morley et al. (2018) find that the 3.5 – 4.1 m and 4.5 – 5.1 m spectra can be fit by metal-poor models with a C/O ratio half solar (although the models are then too bright in the near-infrared). As pointed out by Morley et al. (2018), it is unlikely that all the late-T and Y dwarfs have such an unusual atmospheric composition and so it is more likely that there is something occurring in these cool atmospheres that is not captured by the models. Leggett et al. (2017) explored changes to the adiabatic index in models, such that the deep atmosphere was warmer and the upper atmosphere was cooler than the standard model. These experiments could improve the agreement with observations in the -band (m, see Figure 1) but the discrepancy at [3.6] remained.

The fact that the observed flux is higher than calculated suggests that the 3.6 – 4.1 m flux is emerging from warmer atmospheric layers than the models generate. Figure 10 shows a K synthetic spectrum generated by us, based on the models of Morley et al. (2014b), which demonstrates the changes in the spectrum that could be brought about if the atmosphere is heated at 1 bar or 0.1 bar. The pressure-temperature profile for this atmosphere is also shown, illustrating the size of the temperature differential in the upper atmosphere. The heated-atmosphere spectrum is very similar to the standard spectrum in the near-infrared and at m, but is much brighter at m and at – m. This preliminary result suggests that upper atmosphere heating in late-T and Y dwarfs could be the cause of the brighter than expected W1, [3.6] and magnitudes, and may also give rise to the (less well-defined) discrepancy seen in the W3 magnitudes (m , Leggett et al., 2017, Figure 12). The total emitted flux increases, and increases from 500 K to 550 K; this implies that temperatures determined for late-T and Y dwarfs by fitting models to red, near-infrared and 4.5 m data could be significantly too low. However, this heated-atmosphere model is exploratory only, and needs further study.
A cool brown dwarf atmosphere is assumed to be undergoing adiabatic cooling in the deep atmosphere and radiative cooling in the upper atmosphere (e.g., Marley & Robinson, 2015, Figure 1). The retrieval analysis of late-T and Y dwarf atmospheres by Zalesky et al. (2019) found temperature structures largely consistent with radiative-convective equilibrium, and chemical abundances for water, methane and ammonia to be as expected. Their analysis explored fits to spectra covering m only, which is sensitive to deep atmospheric layers and not very sensitive to the upper atmosphere (Figure 10 and Zalesky et al., 2019, Figure 2). Also, as the authors state, the derived gravities are uncomfortably high and radii uncomfortably low, suggesting that sampling this limited wavelength range is not providing reliable parameters.
Energy (or heat) could be introduced into a brown dwarf atmosphere by thermochemical instabilities (Tremblin et al., 2015, 2019) or cloud clearing (Morley et al., 2012). Interestingly, measurements of the atmospheres of the solar system giant planets show the upper layers to be warmer than expected; heat sources such as breaking gravity waves have been invoked (Matcheva & Strobel, 1999; O’Donoghue et al., 2016). The same effect may be present in cold brown dwarfs, which have similar radii and rotation periods (Cushing et al., 2016; Leggett et al., 2016; Manjavacas et al., 2019), and highly dynamic atmospheres (Apai et al., 2017; Showman & Kaspi, 2013).
It is also important to note that these models are one-dimensional, and it is likely that the atmospheres have both horizontal and vertical pressure/temperature variations. Variability at m has been measured at the few-percent level for T and Y0 dwarfs (e.g., Buenzli et al., 2012, 2014; Cushing et al., 2016; Leggett et al., 2016; Manjavacas et al., 2019; Metchev et al., 2015). The variability may be due to irregular cloud cover (e.g., Marley et al., 2010; Morley et al., 2014a), or it may be due to the presence of zones and spots, similar to the solar system giant planets (e.g., Apai et al., 2017; Tan & Showman, 2017). A one-dimensional model fit over the entire wavelength range may underpredict the flux at wavelengths where isolated hot spots are bright.
6 Conclusion
We have imaged two brown dwarf binary systems at high angular resolution using NIRI and its filter on the Gemini North telescope: the T8.5 T9 0458AB, and the T9 Y0 1217AB. We have also imaged five single brown dwarfs in at lower angular resolution: 0005 (T8.5), 0313 (T9), 0410 (Y0), 1405 (Y0.5), and 2056 (Y0). In addition, we have synthesized photometry from published spectra for 0722 (T9) and 0855 (Y1).
The 0458AB system has shown significant orbital motion. The separation of the components was 46 in 2011 and 13 in 2018, a decrease in projected separation from 4.3 AU to 1.2 AU. We have combined the Gemini images with higher resolution Keck LGS AO and HST images to monitor the orbit of the 0458AB system, and with wide-field CFHT images to determine the proper motion and parallax of the system. Our preliminary orbital analysis gives a period of years and a total mass for the system of (). Our analysis will aid the acquisition of the target for observations. The orbital analysis, together with photometry and evolutionary models, suggests that the age of the system is a few Gyr with component masses of around 35 and 25 .
We verify that model fluxes at m are too low, as has been found previously. The discrepancy starts at K and gets worse to lower temperatures — at K model fluxes are about a factor of two too low and at K the fluxes are about a factor of four too low. The spectra suggest that the dominant opacity source in this region is CH4 as expected, and the depths of the features are approximately correct; however, the flux emerging between the features, the pseudo-continuum, is brighter than calculated by the models. We have generated model spectra where heat is introduced into the upper layers of the atmosphere. Such models can significantly increase the flux at m and m without impacting the near-infrared or m flux, offering the potential of a much better match to observations. Departures from pure radiative-convective equilibrium temperature-pressure profiles, such as in the test model, can arise from several physical mechanisms. Tremblin et al. (2019) use hydrodynamic simulations to show that a diabatic profile is appropriate in the event of instabilities brought about by the conversion between CO and CH4 for warmer brown dwarfs with K; at K similar instabilities could be introduced by the conversion between N2 and NH3 (e.g., Lodders, 1999, Figure 2). Another possible source of heat in the upper atmosphere is breaking gravity waves, as has been proposed to explain the higher than expected temperatures in the upper atmospheres of the solar system giant planets (e.g., Matcheva & Strobel, 1999; O’Donoghue et al., 2016). Three-dimensional hydrodynamic models may be necessary to better understand these atmospheres; although computationally challenging, schemes are being developed to make the calculations more tractable (e.g., Venot et al., 2019).
It is important to resolve the discrepancies between models and observations at m, for brown dwarfs with K. For example, the heated-atmosphere model predicts that the m flux contributes significantly to the bolometric luminosity (Figure 10), and therefore current estimates of are systematically and significantly low. We eagerly await JWST spectra covering these wavelengths, and anticipate that the m spectra delivered by JWST and SPHEREx will reveal unexpected climate physics for cool brown dwarfs. This physics is likely to be important not only for the brown dwarfs, but also for exoplanets and the solar system giant planets.
References
- Apai et al. (2017) Apai, D., Karalidi, T., Marley, M. S., et al. 2017, Science, 357, 683, doi: 10.1126/science.aam9848
- Beichman et al. (2014) Beichman, C., Gelino, C. R., Kirkpatrick, J. D., et al. 2014, ApJ, 783, 68, doi: 10.1088/0004-637X/783/2/68
- Bertin & Arnouts (1996) Bertin, E., & Arnouts, S. 1996, A&AS, 117, 393, doi: 10.1051/aas:1996164
- Best et al. (2017) Best, W. M. J., Liu, M. C., Dupuy, T. J., & Magnier, E. A. 2017, ApJ, 843, L4, doi: 10.3847/2041-8213/aa76df
- Bouchez et al. (2004) Bouchez, A. H., Le Mignant, D., van Dam, M. A., et al. 2004, in Proc. SPIE, Vol. 5490, Advancements in Adaptive Optics, ed. D. Bonaccini Calia, B. L. Ellerbroek, & R. Ragazzoni, 321–330
- Buenzli et al. (2014) Buenzli, E., Apai, D., Radigan, J., Reid, I. N., & Flateau, D. 2014, ApJ, 782, 77, doi: 10.1088/0004-637X/782/2/77
- Buenzli et al. (2012) Buenzli, E., Apai, D., Morley, C. V., et al. 2012, ApJ, 760, L31, doi: 10.1088/2041-8205/760/2/L31
- Burgasser et al. (2012) Burgasser, A. J., Gelino, C. R., Cushing, M. C., & Kirkpatrick, J. D. 2012, ApJ, 745, 26, doi: 10.1088/0004-637X/745/1/26
- Burningham et al. (2009) Burningham, B., Pinfield, D. J., Leggett, S. K., et al. 2009, MNRAS, 395, 1237, doi: 10.1111/j.1365-2966.2009.14620.x
- Cushing et al. (2011) Cushing, M. C., Kirkpatrick, J. D., Gelino, C. R., et al. 2011, ApJ, 743, 50, doi: 10.1088/0004-637X/743/1/50
- Cushing et al. (2016) Cushing, M. C., Hardegree-Ullman, K. K., Trucks, J. L., et al. 2016, ApJ, 823, 152, doi: 10.3847/0004-637X/823/2/152
- Cutri et al. (2003) Cutri, R. M., Skrutskie, M. F., van Dyk, S., et al. 2003, 2MASS All Sky Catalog of point sources.
- Dupuy et al. (2016) Dupuy, T. J., Kratter, K. M., Kraus, A. L., et al. 2016, ApJ, 817, 80, doi: 10.3847/0004-637X/817/1/80
- Dupuy & Kraus (2013) Dupuy, T. J., & Kraus, A. L. 2013, Science, 341, 1492, doi: 10.1126/science.1241917
- Dupuy & Liu (2012) Dupuy, T. J., & Liu, M. C. 2012, ApJS, 201, 19, doi: 10.1088/0067-0049/201/2/19
- Dupuy & Liu (2017) —. 2017, ApJS, 231, 15, doi: 10.3847/1538-4365/aa5e4c
- Dupuy et al. (2009a) Dupuy, T. J., Liu, M. C., & Bowler, B. P. 2009a, ApJ, 706, 328, doi: 10.1088/0004-637X/706/1/328
- Dupuy et al. (2009b) Dupuy, T. J., Liu, M. C., & Ireland, M. J. 2009b, ApJ, 692, 729, doi: 10.1088/0004-637X/692/1/729
- Dupuy et al. (2014) —. 2014, ApJ, 790, 133, doi: 10.1088/0004-637X/790/2/133
- Dupuy et al. (2015) Dupuy, T. J., Liu, M. C., Leggett, S. K., et al. 2015, ApJ, 805, 56, doi: 10.1088/0004-637X/805/1/56
- Earl & Deem (2005) Earl, D. J., & Deem, M. W. 2005, Physical Chemistry Chemical Physics (Incorporating Faraday Transactions), 7, 3910, doi: 10.1039/B509983H
- Esplin & Luhman (2017) Esplin, T. L., & Luhman, K. L. 2017, AJ, 154, 134, doi: 10.3847/1538-3881/aa859b
- Fazio et al. (2004) Fazio, G. G., Hora, J. L., Allen, L. E., et al. 2004, ApJS, 154, 10, doi: 10.1086/422843
- Foreman-Mackey et al. (2013) Foreman-Mackey, D., Hogg, D. W., Lang, D., & Goodman, J. 2013, PASP, 125, 306, doi: 10.1086/670067
- Gagné et al. (2015) Gagné, J., Burgasser, A. J., Faherty, J. K., et al. 2015, ApJ, 808, L20, doi: 10.1088/2041-8205/808/1/L20
- Geballe et al. (2001) Geballe, T. R., Saumon, D., Leggett, S. K., et al. 2001, ApJ, 556, 373, doi: 10.1086/321575
- Gelino et al. (2011) Gelino, C. R., Kirkpatrick, J. D., Cushing, M. C., et al. 2011, AJ, 142, 57, doi: 10.1088/0004-6256/142/2/57
- Golimowski et al. (2004) Golimowski, D. A., Leggett, S. K., Marley, M. S., et al. 2004, AJ, 127, 3516, doi: 10.1086/420709
- Hodapp et al. (2003) Hodapp, K. W., Jensen, J. B., Irwin, E. M., et al. 2003, PASP, 115, 1388, doi: 10.1086/379669
- Kirkpatrick et al. (2012) Kirkpatrick, J. D., Gelino, C. R., Cushing, M. C., et al. 2012, ApJ, 753, 156, doi: 10.1088/0004-637X/753/2/156
- Kirkpatrick et al. (2019) Kirkpatrick, J. D., Martin, E. C., Smart, R. L., et al. 2019, ApJS, 240, 19, doi: 10.3847/1538-4365/aaf6af
- Krist et al. (2011) Krist, J. E., Hook, R. N., & Stoehr, F. 2011, in Proc. SPIE, Vol. 8127, Optical Modeling and Performance Predictions V, 81270J
- Leggett et al. (2014) Leggett, S. K., Liu, M. C., Dupuy, T. J., et al. 2014, ApJ, 780, 62, doi: 10.1088/0004-637X/780/1/62
- Leggett et al. (2015) Leggett, S. K., Morley, C. V., Marley, M. S., & Saumon, D. 2015, ApJ, 799, 37, doi: 10.1088/0004-637X/799/1/37
- Leggett et al. (2013) Leggett, S. K., Morley, C. V., Marley, M. S., et al. 2013, ApJ, 763, 130, doi: 10.1088/0004-637X/763/2/130
- Leggett et al. (2010a) Leggett, S. K., Saumon, D., Burningham, B., et al. 2010a, ApJ, 720, 252, doi: 10.1088/0004-637X/720/1/252
- Leggett et al. (2007) Leggett, S. K., Saumon, D., Marley, M. S., et al. 2007, ApJ, 655, 1079, doi: 10.1086/510014
- Leggett et al. (2017) Leggett, S. K., Tremblin, P., Esplin, T. L., Luhman, K. L., & Morley, C. V. 2017, ApJ, 842, 118, doi: 10.3847/1538-4357/aa6fb5
- Leggett et al. (2002) Leggett, S. K., Golimowski, D. A., Fan, X., et al. 2002, ApJ, 564, 452, doi: 10.1086/324037
- Leggett et al. (2003) Leggett, S. K., Hawarden, T. G., Currie, M. J., et al. 2003, MNRAS, 345, 144, doi: 10.1046/j.1365-8711.2003.06943.x
- Leggett et al. (2010b) Leggett, S. K., Burningham, B., Saumon, D., et al. 2010b, ApJ, 710, 1627, doi: 10.1088/0004-637X/710/2/1627
- Leggett et al. (2012) Leggett, S. K., Saumon, D., Marley, M. S., et al. 2012, ApJ, 748, 74, doi: 10.1088/0004-637X/748/2/74
- Leggett et al. (2016) Leggett, S. K., Cushing, M. C., Hardegree-Ullman, K. K., et al. 2016, ApJ, 830, 141, doi: 10.3847/0004-637X/830/2/141
- Line et al. (2015) Line, M. R., Teske, J., Burningham, B., Fortney, J. J., & Marley, M. S. 2015, ApJ, 807, 183, doi: 10.1088/0004-637X/807/2/183
- Liu et al. (2016) Liu, M. C., Dupuy, T. J., & Allers, K. N. 2016, ApJ, 833, 96, doi: 10.3847/1538-4357/833/1/96
- Liu et al. (2012) Liu, M. C., Dupuy, T. J., Bowler, B. P., Leggett, S. K., & Best, W. M. J. 2012, ApJ, 758, 57, doi: 10.1088/0004-637X/758/1/57
- Liu et al. (2008) Liu, M. C., Dupuy, T. J., & Ireland, M. J. 2008, ApJ, 689, 436, doi: 10.1086/591837
- Liu et al. (2006) Liu, M. C., Leggett, S. K., Golimowski, D. A., et al. 2006, ApJ, 647, 1393, doi: 10.1086/505561
- Lodders (1999) Lodders, K. 1999, ApJ, 519, 793, doi: 10.1086/307387
- Lucas et al. (2010) Lucas, P. W., Tinney, C. G., Burningham, B., et al. 2010, MNRAS, 408, L56, doi: 10.1111/j.1745-3933.2010.00927.x
- Luhman (2014) Luhman, K. L. 2014, ApJ, 786, L18, doi: 10.1088/2041-8205/786/2/L18
- Luhman & Esplin (2016) Luhman, K. L., & Esplin, T. L. 2016, AJ, 152, 78, doi: 10.3847/0004-6256/152/3/78
- Manjavacas et al. (2019) Manjavacas, E., Apai, D., Lew, B. W. P., et al. 2019, ApJ, 875, L15, doi: 10.3847/2041-8213/ab13b9
- Marley & Robinson (2015) Marley, M. S., & Robinson, T. D. 2015, ARA&A, 53, 279, doi: 10.1146/annurev-astro-082214-122522
- Marley et al. (2017) Marley, M. S., Saumon, D., Fortney, J. J., et al. 2017, in American Astronomical Society Meeting Abstracts, Vol. 230, American Astronomical Society Meeting Abstracts #230, 315.07
- Marley et al. (2010) Marley, M. S., Saumon, D., & Goldblatt, C. 2010, ApJ, 723, L117, doi: 10.1088/2041-8205/723/1/L117
- Marley et al. (2002) Marley, M. S., Seager, S., Saumon, D., et al. 2002, ApJ, 568, 335, doi: 10.1086/338800
- Martin et al. (2018) Martin, E. C., Kirkpatrick, J. D., Beichman, C. A., et al. 2018, ApJ, 867, 109, doi: 10.3847/1538-4357/aae1af
- Matcheva & Strobel (1999) Matcheva, K. I., & Strobel, D. F. 1999, Icarus, 140, 328, doi: 10.1006/icar.1999.6151
- Metchev et al. (2015) Metchev, S. A., Heinze, A., Apai, D., et al. 2015, ApJ, 799, 154, doi: 10.1088/0004-637X/799/2/154
- Morley et al. (2012) Morley, C. V., Fortney, J. J., Marley, M. S., et al. 2012, ApJ, 756, 172, doi: 10.1088/0004-637X/756/2/172
- Morley et al. (2014a) Morley, C. V., Marley, M. S., Fortney, J. J., & Lupu, R. 2014a, ApJ, 789, L14, doi: 10.1088/2041-8205/789/1/L14
- Morley et al. (2014b) Morley, C. V., Marley, M. S., Fortney, J. J., et al. 2014b, ApJ, 787, 78, doi: 10.1088/0004-637X/787/1/78
- Morley et al. (2018) Morley, C. V., Skemer, A. J., Allers, K. N., et al. 2018, ApJ, 858, 97, doi: 10.3847/1538-4357/aabe8b
- Nielsen et al. (2019) Nielsen, E. L., De Rosa, R. J., Macintosh, B., et al. 2019, arXiv e-prints. https://arxiv.org/abs/1904.05358
- O’Donoghue et al. (2016) O’Donoghue, J., Moore, L., Stallard, T. S., & Melin, H. 2016, Nature, 536, 190, doi: 10.1038/nature18940
- Puget et al. (2004) Puget, P., Stadler, E., Doyon, R., et al. 2004, in Proc. SPIE, Vol. 5492, Ground-based Instrumentation for Astronomy, ed. A. F. M. Moorwood & M. Iye, 978–987
- Robin et al. (2003) Robin, A. C., Reylé, C., Derrière, S., & Picaud, S. 2003, A&A, 409, 523, doi: 10.1051/0004-6361:20031117
- Saumon & Marley (2008) Saumon, D., & Marley, M. S. 2008, ApJ, 689, 1327, doi: 10.1086/592734
- Saumon et al. (2012) Saumon, D., Marley, M. S., Abel, M., Frommhold, L., & Freedman, R. S. 2012, ApJ, 750, 74, doi: 10.1088/0004-637X/750/1/74
- Saumon et al. (2006) Saumon, D., Marley, M. S., Cushing, M. C., et al. 2006, The Astrophysical Journal, 647, 552, doi: 10.1086/505419
- Saumon et al. (2007) Saumon, D., Marley, M. S., Leggett, S. K., et al. 2007, The Astrophysical Journal, 656, 1136, doi: 10.1086/510557
- Schlafly et al. (2019) Schlafly, E. F., Meisner, A. M., & Green, G. M. 2019, The Astrophysical Journal Supplement Series, 240, 30, doi: 10.3847/1538-4365/aafbea
- Schlaufman (2018) Schlaufman, K. C. 2018, ApJ, 853, 37, doi: 10.3847/1538-4357/aa961c
- Service et al. (2016) Service, M., Lu, J. R., Campbell, R., et al. 2016, PASP, 128, 095004, doi: 10.1088/1538-3873/128/967/095004
- Showman & Kaspi (2013) Showman, A. P., & Kaspi, Y. 2013, ApJ, 776, 85, doi: 10.1088/0004-637X/776/2/85
- Smart et al. (2018) Smart, R. L., Bucciarelli, B., Jones, H. R. A., et al. 2018, MNRAS, 481, 3548, doi: 10.1093/mnras/sty2520
- Sorahana & Yamamura (2012) Sorahana, S., & Yamamura, I. 2012, ApJ, 760, 151, doi: 10.1088/0004-637X/760/2/151
- Stephens et al. (2009) Stephens, D. C., Leggett, S. K., Cushing, M. C., et al. 2009, ApJ, 702, 154, doi: 10.1088/0004-637X/702/1/154
- Tan & Showman (2017) Tan, X., & Showman, A. P. 2017, ApJ, 835, 186, doi: 10.3847/1538-4357/835/2/186
- Tennyson & Yurchenko (2012) Tennyson, J., & Yurchenko, S. N. 2012, MNRAS, 425, 21, doi: 10.1111/j.1365-2966.2012.21440.x
- Theissen (2018) Theissen, C. A. 2018, ApJ, 862, 173, doi: 10.3847/1538-4357/aaccfa
- Tokunaga et al. (2002) Tokunaga, A. T., Simons, D. A., & Vacca, W. D. 2002, PASP, 114, 180, doi: 10.1086/338545
- Tremblin et al. (2015) Tremblin, P., Amundsen, D. S., Mourier, P., et al. 2015, ApJ, 804, L17, doi: 10.1088/2041-8205/804/1/L17
- Tremblin et al. (2019) Tremblin, P., Padioleau, T., Phillips, M., et al. 2019, arXiv e-prints. https://arxiv.org/abs/1902.03553
- Venot et al. (2019) Venot, O., Bounaceur, R., Dobrijevic, M., et al. 2019, A&A, 624, A58, doi: 10.1051/0004-6361/201834861
- Wagner et al. (2019) Wagner, K., Apai, D., & Kratter, K. M. 2019, arXiv e-prints. https://arxiv.org/abs/1904.06438
- Wizinowich et al. (2006) Wizinowich, P. L., Le Mignant, D., Bouchez, A. H., et al. 2006, PASP, 118, 297, doi: 10.1086/499290
- Wright et al. (2010) Wright, E. L., Eisenhardt, P. R. M., Mainzer, A. K., et al. 2010, AJ, 140, 1868, doi: 10.1088/0004-6256/140/6/1868
- Yelda et al. (2010) Yelda, S., Lu, J. R., Ghez, A. M., et al. 2010, ApJ, 725, 331, doi: 10.1088/0004-637X/725/1/331
- Yurchenko & Tennyson (2014) Yurchenko, S. N., & Tennyson, J. 2014, MNRAS, 440, 1649, doi: 10.1093/mnras/stu326
- Zalesky et al. (2019) Zalesky, J. A., Line, M. R., Schneider, A. C., & Patience, J. 2019, arXiv e-prints. https://arxiv.org/abs/1903.11658
In this Appendix we describe the relationship between ground-based and photometry and the space-based WISE W1 and W2 and Spitzer [3.6] and [4.5] photometry, so that datasets can be better utilized. See Figure 1 for the location of the filters with respect to a 500 K brown dwarf spectrum. The Spitzer data are taken from Kirkpatrick et al. (2019); Leggett et al. (2017); Martin et al. (2018) and references therein, the trigonometric parallaxes are taken from Kirkpatrick et al. (2019); Leggett et al. (2017); Martin et al. (2018); Smart et al. (2018); Theissen (2018) and references therein. In addition, for this work, we determined W1 magnitudes from images downloaded from the unWISE database222http://unwise.me/imgsearch/// (Schlafly et al., 2019) for four Y dwarfs, WISE J033605.05-014350.4 with , WISEA J035000.31-565830.5 with , WISE J064723.23-623235.5 with , and WISEA J235402.79+024014.1 with .

Figures 11 and 12 are color-magnitude diagrams for the m and m filters. We find that the uncertainty in the W1 colors of the T and Y dwarfs may be underestimated, as the large scatter in the W1 [3.6] color is not seen in the [3.6] color. A spot check of the outliers suggests that the W1 photometry is contaminated by nearby background sources — the brown dwarfs are faint in W1 and the WISE pixels are large (see also Kirkpatrick et al., 2019).
The [3.6] color becomes redder for later spectral types, however W2 [4.5] and [4.5] stay close to zero. This is not surprising given the large degree of overlap in the W2, [4.5] and filters (Figure 1).

Figure 13 shows [3.6] , [4.5], [4.5], and [3.6] as a function of [3.6] [4.5]. Known binaries have been excluded from the sample. Excluding the extremely red 0855, and the low gravity SDSS J111009.99011613.0 (Gagné et al., 2015) which appears discrepant, we find that weighted linear fits can be used to estimate the differences between the ground-based and magnitudes and the Spitzer [3.6] and [4.5] magnitudes as a function of the [3.6] [4.5] color:
[3.6] ([3.6][4.5])
and
[4.5] ([3.6][4.5])
for ([3.6] [4.5]) .
[4.5] ([3.6][4.5])
and
[3.6] ([3.6][4.5])
for ([3.6] [4.5]) . The rms uncertainty in the linear fit is 0.09 mag for all colors.

Figure 14 shows [3.6] , [4.5], [4.5], and [3.6] as a function of and . Weighted quadratic fits were made, excluding known binaries, the extremely red 0855, and the low gravity SDSS J111009.99011613.0, as above. These relationships can be used to estimate [3.6] and [4.5] if only or are available, for example in the case of close binaries unresolved by Spitzer. We use the bandpass to provide the near-infrared color — more measurements are available than (which can be faint for late-type dwarfs), and shorter wavelengths are impacted by clouds (e.g. Section 5). We find:
[3.6]
for , with rms uncertainty 0.08 mag, and
[4.5]
for and spectral type T6 and later, with rms uncertainty 0.11 mag.
[4.5]
for , with rms uncertainty 0.08 mag, and
[3.6]
for , with rms uncertainty 0.13 mag.