Rapidly accreting black hole of the Ly-luminous quasar PSO J006.1240+39.2219
Abstract
We present near-infrared 1.1–1.3 and 1.3–1.6 m spectra of the Ly-luminous quasar PSO J006.1240+39.2219 at obtained with the NIRSPEC spectrograph at the Keck-II telescope. The spectra cover the CIV 1549, CIII] 1909 emission lines and part of the UV continuum of the quasar. From the NIRSPEC observations of PSO J006.1240+39.2219, we constrain the spectral slope of its UV continuum to be and measure an absolute magnitude of . Using the scaling relation between black hole mass, width of the CIV line and ultraviolet continuum luminosity, we derive a black hole mass of ()108, which is consistent but somewhat smaller than the typical black hole masses of quasars of similar luminosities. The inferred accretion rate of indicates that PSO J006.1240+39.2219 is in the phase of the rapid growth of its supermassive black hole characterized by the high NV/CIV line ratio, , and lower level of ionization of its circumnuclear gas than in other high-redshift luminous quasars. The NV/CIV line ratio of PSO J006.1240+39.2219 implies relatively high abundance of nitrogen in its circumnuclear gas. This abundance might be produced by the post-starburst population of stars that provide the fuel for black hole accretion.
1 Introduction
The high-redshift quasars discovered at are among the most luminous known objects with typical absolute magnitudes of (Bañados et al., 2016; Jiang et al., 2016). There is also a growing number of less luminous high-redshift quasars with (e.g., Willott et al., 2010; Matsuoka et al., 2018; Koptelova et al., 2019). The generally high luminosities of high-redshift quasars are powered by accretion onto massive supermassive black holes (SMBHs). The masses of the SMBHs of these quasars are usually estimated from their single-epoch spectra using the widths of the CIV 1549 and MgII 2800 emission lines. The relations between black hole mass and CIV and MgII line widths have been calibrated for a sample of low-redshift active galactic nuclei (AGNs) with their black hole masses directly measured from reverberation mapping (Vestergaard & Peterson, 2006; Vestergaard & Osmer, 2009). Assuming that these relations can be extrapolated from local AGNs to the most luminous distant quasars (see, e.g., Park et al., 2017), the derived black hole masses of high-redshift quasars are typically on the order of 109 (e.g., Jiang et al., 2006, 2007; Kurk et al., 2007, 2009; De Rosa et al., 2011, 2014; Willott et al., 2010; Wu et al., 2015; Onoue et al., 2019). Recently, Bañados et al. (2018) reported the discovery of the most distant luminous quasar at (just 690 Myr after the Big Bang) with an SMBH of 8108. The existence of these SMBHs provides evidence of their extremely rapid and efficient mass growth at early epochs. The discussed scenarios of the mass growth of SMBHs are multiple mergers of smaller initial black holes and gas accretion (e.g., Volonteri & Rees, 2005; Volonteri, 2010; Madau et al., 2014; Lupi et al., 2016; Pezzulli et al., 2016).
The accretion rates of high-redshift quasars are typically between 0.1 and 1 of their Eddington luminosities (De Rosa et al., 2011, 2014; Wu et al., 2015; Mazzucchelli et al., 2017; Onoue et al., 2019). Some quasars with less massive SMBHs (108) but accreting at the Eddington and super-Eddington luminosities have also been discovered (Willott et al., 2010; Mazzucchelli et al., 2017). They might be at the early stages of the growth of their SMBHs. The observations of these less massive, less evolved SMBHs can help us to test different scenarios of the formation of SMBHs at high redshift.
The high-redshift quasars, including the most distant of them at (Mortlock et al., 2011; Bañados et al., 2018), exhibit the same metal lines as quasars at low redshifts. The flux ratios of different metal lines have dependency on the metallicity, density and ionization state of the circumnuclear gas, and also on the spectral energy distribution of the ionizing flux of quasars (e.g., Hamann & Ferland, 1999; Nagao et al., 2006). Assuming that the gas properties of high-redshift quasars (density and ionization state) are similar to those of low-redshift quasars, the metal line ratios of high-redshift quasars indicate that their gas metallicities are supersolar, possibly produced by recent/ongoing star formation in their host galaxies (e.g., Jiang et al., 2007; Juarez et al., 2009; De Rosa et al., 2014). Indeed, the submillimeter observations of the hosts of high-redshift quasars often show signs of a vigorous starburst (e.g., Walter et al., 2009; Wang et al., 2013; Willott et al., 2017). However, the line flux ratios of high-redshift quasars may also indicate that the gas density and ionization state of their circumnuclear gas differ from those of low-redshift quasars.
The quasar PSO J006.1240+39.2219 at (hereafter PSO J006+39) selected by E.K. from the Panoramic Survey Telescope and Rapid Response System 1 survey (PS1) (Kaiser et al., 2002, 2010; Chambers et al., 2016) and confirmed with Subaru/FOCAS (Program S15B0094N; PI: E. Koptelova) has unusual properties. The Ly line of PSO J006+39 is 3 to 4 times narrower (FWHM1300 km s-1) than a typical broad emission line (see Peterson, 1997) and implies a less massive SMBH than typically in the quasars known at . At the same time, the luminosity of PSO J006+39 of , inferred from its discovery spectrum, is comparable to the luminosities of other high-redshift luminous quasars at (Koptelova et al., 2017). The Ly 1216 emission line of PSO J006+39 is unusually strong relative to the continuum (see also Tang et al., 2017). We call PSO J006+39 a Ly-luminous quasar as the luminosity of its Ly line (0.81012⨀) constitutes almost 3% of the total luminosity of PSO J006+39 and is larger than the typical Ly line luminosities of quasars by 2 to 3 times. We also found evidence of a significant quasar contribution to the Ly emission by observing fast variability of the Ly line of PSO J006+39 on timescales of days and weeks in the quasar rest frame (Koptelova et al., 2017). The narrow and variable Ly emission line of PSO J006+39 makes it similar to local Narrow-line Seyfert 1 galaxies (NLSy1; Osterbrock & Pogge, 1985). NLSy1s exhibit narrow broad emission lines as the result of their smaller SMBHs and often show variability of UV lines and continuum (e.g., Collier et al., 2001; Romano et al., 2002). Based on the higher accretion rates and metallicities of NLSy1s in comparison with broad line quasars (e.g., Kuraszkiewicz et al., 2000; Shemmer & Netzer, 2002; Nagao et al., 2002), Mathur (2000) concluded that they might be at early evolutionary stages similar to high-redshift quasars. The signs of a recent star-formation activity in the host galaxies of individual NLSy1s support the idea that these objects are relatively young (e.g., Wang et al., 2004; Wang & Wei, 2006). The properties of PSO J006+39 in comparison with local NLSy1s and known high-redshift quasars can constrain the evolutionary stage of its SMBH.
Here, we present new near-infrared observations of PSO J006+39 obtained at the Keck Observatory which cover the CIV 1549, CIII] 1909 emission lines and part of the UV continuum. Based on these observations, we report the first measurement of the black hole mass and accretion rate of PSO J006+39111During review of our paper, Tang et al. (2019) published the results of their analysis of the near-infrared spectrum of PSO J006+39 obtained using Gemini North Near Infra-Red Spectrograph (GNIRS). As suggested by our referee, we added a comparison between our results derived from the Subaru/FOCAS and Keck/NIRSPEC data, and from the Gemini/GNIRS data. The continuum and line properties of PSO J006+39 estimated by us from the Gemini/GNIRS spectrum are presented in Appendix A.. We also present the analysis of the metallicity of the circumnuclear gas of PSO J006+39 using the flux ratios of the observed emission lines. The results presented in our paper provide new evidence that PSO J006+39 is in an early phase of the black hole growth. In Section 2, we describe the observations and data reduction. In Section 3, we present analysis of the continuum and emission lines of PSO J006+39, and derive the mass of its SMBH. In Section 4, we compare the black hole mass and accretion rate of PSO J006+39 with those of other high-redshift quasars and NLSy1s, and discuss its metal abundance. In Section 5 we present our main conclusions. In the paper, we adopt the following cosmological parameters: km s-1 Mpc-1, and (Planck Collaboration et al., 2016).
2 OBSERVATIONS AND DATA REDUCTION
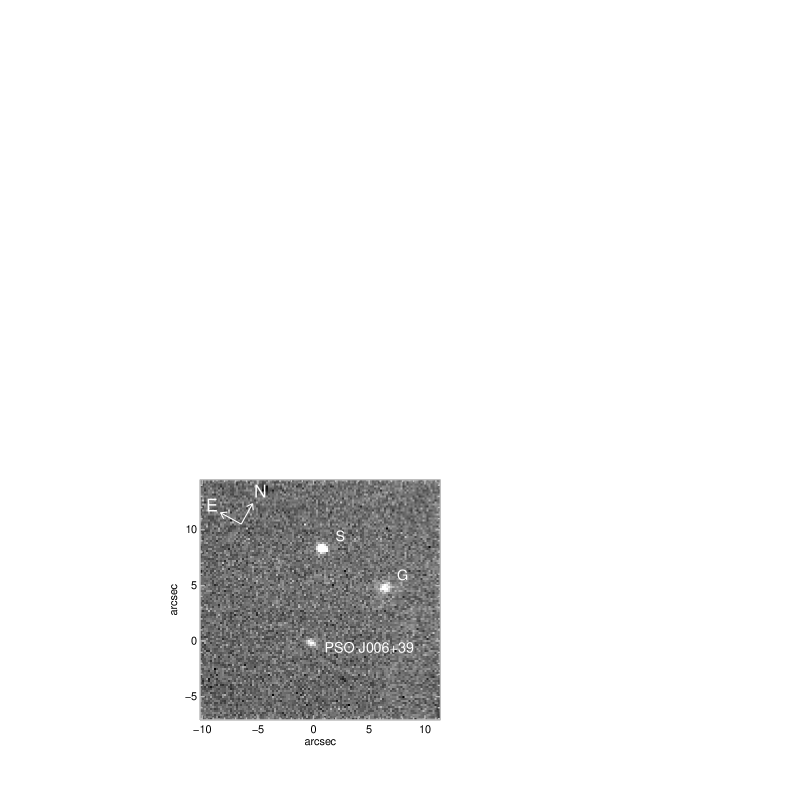
The observations of PSO J006+39 were conducted using NIRSPEC, a cross-dispersed, cryogenic, echelle spectrograph on the Keck-II telescope (McLean et al., 1998). The data were acquired on the second half night of 2017 July 28 (UT) under – seeing and cloudy sky with decreasing cloud coverage during the observations. We used Low Resolution mode of NIRSPEC with a 076-wide and 42-long slit which provided a resolving power of (comparable to that of our previous observations of PSO J006+39 with SUBARU/FOCAS, see Koptelova et al., 2017). The spectra of PSO J006+39 were taken in the two bands, NIRSPEC-2 and NIRSPEC-4222The data are available at https://koa.ipac.caltech.edu/. The observed wavelength intervals corresponding to our spectral setup were 1.1–1.3 and 1.3–1.6 m and included the CIV and CIII] emission lines in the NIRSPEC-2 and NIRSPEC-4 bands, respectively. During these observations, we took 8300 s and 6300 s exposures in NIRSPEC-2 and NIRSPEC-4, respectively. The spectra of the quasar were taken simultaneously with the spectra of a nearby star within 86 north-east of the quasar by rotating the slit by an angle of 216. This star is denoted as star S in Figure 1. The PS1 mean -band magnitude of star S is AB mag. The -band multi-epoch mean magnitude of PSO J006+39 which represents the typical magnitude of the quasar measured over several PS1 epochs is AB mag (see Koptelova et al., 2017). Additionally, we took two 60-s images of the quasar in each of the NIRSPEC-2, NIRSPEC-4 and NIRSPEC-6 filters using a slit-viewing camera (SCAM). The SCAM images had a pixel scale of 018 pixel-1 and 216-square field of view. The SCAM image of the quasar field in the NIRSPEC-6 band is shown in Figure 1.
The spectra were reduced using IRAF333IRAF is distributed
by the National Optical Astronomy Observatories, which are
operated by the Association of Universities for Research in
Astronomy, Inc., under cooperative agreement with the National
Science Foundation. tasks and IRAF-based package
WMKONSPEC444Available at
https://www2.keck.hawaii.edu/inst/nirspec/wmkonspec.html.
The wavelength calibration was performed using night sky emission
lines from the quasar’s frames. For the identification of the sky
lines we used the spectral atlas of Rousselot et al. (2000).
The resulting dispersions of the NIRSPEC-2 and NIRSPEC-4 spectra
as measured from the sky lines were 2.179 and 2.894 Å
pixel-1, respectively. The wavelength calibrated
2-dimensional frames of the quasar were sky corrected, aligned and
combined together. The 1D NIRSPEC-2 and NIRSPEC-4 spectra were
extracted from the combined 2-dimensional frames using IRAF task
. The continuum of PSO J006+39 was detected with low
signal-to-noise ratios of and 1.5–3.9 in the
NIRSPEC-2 and NIRSPEC-4 bands, respectively. Therefore, when
running , we used the spectrum of brighter star S as a
reference spectrum to trace the emission of PSO J006+39. The
resulting NIRSPEC-2 and NIRSPEC-4 spectra were corrected for
telluric lines and absolute flux calibrated using the telluric
standard stars, HIP8535 (type A1V, 2MASS Vega
mag) and HIP114716 (type A0V, 2MASS Vega mag),
observed at similar airmass as the quasar. The accuracy of the
flux calibration of the resulting NIRSPEC-2 and NIRSPEC-4 spectra
is limited by the photometric accuracy (0.03 magnitudes) of
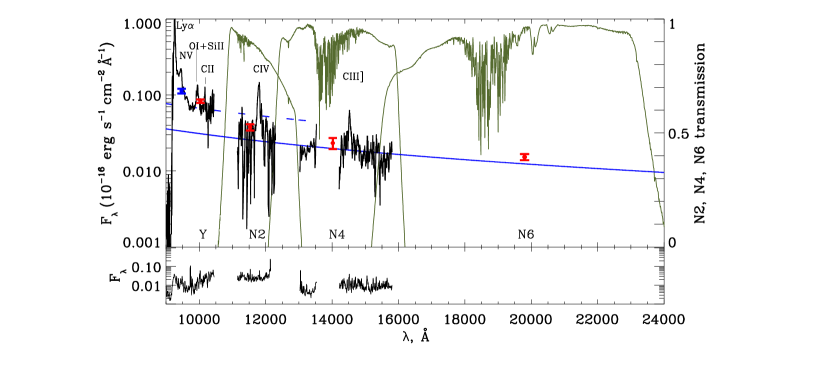
the standard stars. Figure 2 presents the spectrum of
PSO J006+39 from the Keck/NIRSPEC and previous Subaru/FOCAS
observations.
| Band / Epoch | Exp. time | Magnitude | |
|---|---|---|---|
| (s) | (Å) | (AB mag) | |
| FOCAS / Nov 2, 2015 | 270 | 10036 | 20.280.06 |
| NIRSPEC / Jul 28, 2017 | 120 | 11531 | 20.840.10 |
| NIRSPEC / Jul 28, 2017 | 120 | 14022 | 20.940.18 |
| NIRSPEC / Jul 28, 2017 | 120 | 19807 | 20.650.09 |
The photometric calibration of the quasar imaging data was performed using near-infrared standard star Feige 22 (Hawarden et al., 2001) observed on the same night. The NIRSPEC -, -, -band magnitudes of PSO J006+39 measured from the SCAM images are summarized in Table 1. The images of PSO J006+39 were also obtained in the FOCAS band on November 2, 2015 simultaneously with the spectrum of the quasar. Table 1 presents the FOCAS band magnitude of PSO J006+39 calibrated relative to the flux of BD+28d4211 observed together with PSO J006+39 at similar airmass.
3 RESULTS
3.1 CONTINUUM
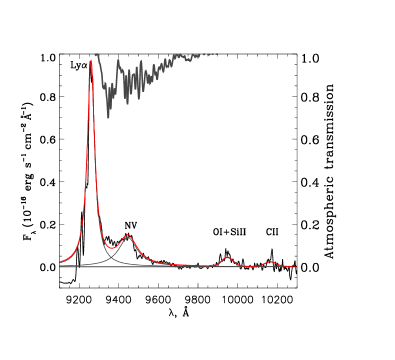
In Koptelova et al. (2017) we derived a spectral slope of the PSO J006+39 UV continuum of using wavelength intervals 9500–9900 and 10000–10150 Å (where is defined such that ). In this previous analysis, the FOCAS spectrum of PSO J006+39 was not corrected for telluric absorption at wavelengths 9300–9800 Å. Moreover, the 9500–9900 Å wavelength interval includes the red wing of the NV line which likely affected the previous slope measurement. Here, we analyze the FOCAS spectrum corrected for telluric absorption. The fraction of the quasar flux absorbed in the earth’s atmosphere was estimated by dividing the FOCAS spectrum of the standard star BD+28d4211 by the flux-scaled black body model of the star with an effective temperature of 82000 K (Latour et al., 2015). The derived atmospheric transmission is displayed in Figure 3. We note that the -band magnitude of PSO J006+39 estimated from the corrected FOCAS spectrum is brighter by 0.1–0.3 than that estimated by us previously in Koptelova et al. (2017).
The FOCAS and NIRSPEC spectra of PSO J006+39 were obtained at two different epochs separated by 1 year and nine months (by slightly less than 3 months in the quasar rest frame). Previously, we found that the PS1 -band light curve of PSO J006+39 shows brightness variations with a peak-to-peak amplitude of 0.7 magnitudes over 4 years (Koptelova et al., 2017), which might be due to the flux variations of both continuum and Ly line of PSO J006+39. To infer the brightness state of PSO J006+39 at the epochs of its FOCAS and NIRSPEC observations, we first calculated the spectral slope of the quasar continuum from the NIRSPEC spectrum with a wider wavelength coverage than that of the FOCAS spectrum. Using wavelength intervals of 11100–11300, 11400–11600, 13085–13400 and 14700–15200 Å we measured a spectral slope of , where the quoted uncertainty is the statistical error of the fit. The fitted power law is shown in Figure 2 with a solid line. The estimated continuum slope is consistent but somewhat flatter than the typical slope of luminous quasars (Zheng & Malkan, 1993; Vanden Berk et al., 2001; Selsing et al., 2016). We then fitted the FOCAS data using the power law with a fixed spectral slope of and spectral windows of 9700–9850 and 10050–10100 Å. The spectral windows adopted for the analysis of the FOCAS and NIRSPEC spectra were taken to be similar to the rest-frame wavelength intervals commonly used to fit the continua of quasars (Vanden Berk et al., 2001; Decarli et al., 2010; Lusso et al., 2015) and less affected by the contribution from emission lines and the Big Blue Bump (BBB) (e.g., Malkan, 1983). The estimated continuum flux of PSO J006+39 at the epoch of its FOCAS observations is shown in Figure 2 with a dashed line. By comparing the continuum flux at the epochs of the FOCAS and NIRSPEC observations, we find that the brightness state of PSO J006+39 was different at these two epochs. PSO J006+39 was brighter by about 0.8 mag during the FOCAS observations than during the NIRSPEC observations. Thus, the continuum flux of PSO J006+39 might be different at different epochs depending on the brightness state of the quasar. Figure 2 also shows the fluxes of PSO J006+39 in the FOCAS , and NIRSPEC , and bands at the epochs of the FOCAS and NIRSPEC observations (see also Table 1).
3.2 EMISSION LINES
To estimate the fluxes and widths of the emission lines in the FOCAS and NIRSPEC spectra of PSO J006+39, we subtracted the power-law continuum () and fitted the lines with analytical profiles. The Ly, NV, CIV and CIII] lines were fitted using Lorentzian profiles. The intrinsic profile of Ly is likely altered by neutral hydrogen absorption seen as the series of absorption lines at its blue side. However, these absorbtion features probably do not significantly affect the total flux of the Ly line due to its intrinsically narrow width (see Koptelova et al., 2017). The OI+SiII and CII emission lines were modelled using Gaussian profiles. The fitted profiles of the emission lines are shown in Figures 3 and 4. The estimated properties of the lines are summarized in Tables 2 and 3. From the line fit, we find that, similar to the Ly line, the CIV and CIII] emission lines of PSO J006+39 are somewhat narrower compared with their usual widths in broad line quasars (2000 km s-1; see Figure 4). The redshift of PSO J006+39 estimated as the mean of the Ly+NV, OI+SiII, CIV and CIII] redshifts is . The estimated redshift is comparable within uncertainties to that of the host galaxy of PSO J006+39 detected in the [CII] 158 m emission by Mazzucchelli et al. (2017) (). However, the UV emission lines of PSO J006+39 are seen slightly blueshifted by about 180–360 km s-1 relative to the [CII] 158-m line.
The absolute magnitude of the continuum of PSO J006+39 at rest frame wavelength 1450 Å estimated from the NIRSPEC data is magnitudes, where the error includes a flux calibration uncertainty of 0.03 mag and an uncertainty of 0.06 mag introduced by the slope error added in quadrature. The uncertainty introduced by the slope error was estimated from a sample of simulated NIRSPEC spectra with the continuum slopes normally distributed around a mean of –1.35 and a standard error of 0.26. We also note that the absolute magnitude of PSO J006+39 at the epoch of the FOCAS observations was (assuming a slope of ).
| Line | Redshift | 10 | EW | FWHM | ||||
|---|---|---|---|---|---|---|---|---|
| (Å) | (erg s-1cm-2) | (Å) | (km s-1) | |||||
| Ly | ||||||||
| NV | ||||||||
| OI+SiII | ||||||||
| CII | ||||||||
| CIV | ||||||||
| CIII] | ||||||||
| Line | Ly | NV | CIII] | |||
|---|---|---|---|---|---|---|
| line/CIV | aaThe uncertainties take into account possible changes in the line fluxes by up to 10% between the epochs of the Subaru/FOCAS and Keck/NIRSPEC observations. | aaThe uncertainties take into account possible changes in the line fluxes by up to 10% between the epochs of the Subaru/FOCAS and Keck/NIRSPEC observations. | ||||

3.3 BLACK HOLE MASS
| –1.350.26 | |
| 1450 | –25.600.07 |
| (1350Å) (1046 erg s-1) | 1.570.12 |
| (3000Å) (1046 erg s-1) | 1.180.15 |
| (108 ), VP06 | 2.190.30 |
| , VP06 | 2.170.34 |
| , VP06 | 2.210.41 |
| (108 ), P17 | 1.200.16 |
| , P17 | 3.950.60 |
| , P17 | 4.020.74 |
To estimate the mass of the SMBH of PSO J006+39, we used the empirical relation between black hole mass, CIV line width and UV continuum luminosity found by Vestergaard & Peterson (2006, hereafter VP06). This relation has been used for the estimation of the black hole masses of other high-redshift quasars which allows for the direct comparison of our results with the previous works. The intrinsic scatter of this relation is 0.36 dex. It is based on the virial equation in which black hole mass is proportional to the size of the broad line region () and to the square of the emission line width (FWHM2). The size of the broad line region of high-redshift quasars is generally unknown. It is estimated using the empirical relation between and the continuum luminosity of the form found from reverberation mapping of local AGNs ( is equal to 0.5 in the relation of VP06).
The method of the black hole mass measurement from broad emission lines of quasars relies on the assumption that the broad line region is virialized. However, the profile of the CIV line of quasars is often altered by non-virial effects (outflows or absorption in the circumnuclear region) which make the CIV line a less reliable black hole mass estimator compared to low-ionization emission lines such as MgII. As discussed in VP06 and Coatman et al. (2017), the blueshifted by 1000 km s-1 CIV line generally leads to overestimation of the CIV black hole masses by a few times.
The CIV line of PSO006+39 is symmetric and is not significantly blueshifted with respect to the other UV emission lines. This suggests that any possible bias in the black hole mass measurement due to the blueshift of the CIV line is likely small. The estimated black hole mass and Eddington ratio of PSO J006+39 are summarized in Table 4. The quoted errors include the uncertainties in the line width of the CIV line and monochromatic luminosity (1350Å). We estimated the bolometric luminosity of PSO J006+39 by applying bolometric correction factors of 3.81 and 5.15 to the continuum luminosities at 1350 and 3000 Å, respectively (Richards et al., 2006; Shen et al., 2008). We note that the estimated continuum luminosities correspond to the brightness state of PSO J006+39 at the epoch of the Keck/NIRSPEC observations and might change with time (see Section 3). The Eddington luminosity was derived as (/) erg s-1 (e.g., Peterson, 1997). The accretion rate of PSO J006+39 presented in Table 4 was estimated for two values of the bolometric luminosity, and , derived from the continuum luminosity at 1350 and 3000 Å, respectively. In previous works, the bolometric luminosities of high-redshift quasars were estimated from their continuum luminosities at 3000 Å by applying a bolometric correction factor of 5.15 (see De Rosa et al., 2011, 2014; Mazzucchelli et al., 2017). In Section 4, to compare the accretion rate of PSO J006+39 with those of other high-redshift quasars, we use the bolometric luminosity estimated in the same way. De Rosa et al. (2014) used both CIV and MgII emission lines and relations of VP06 and Vestergaard & Osmer (2009) to measure the black hole masses of a few quasars at . The CIV and MgII black hole masses of these quasars are consistent within 0.10–0.34 dex. We note that unlike the CIV line of PSO J006+39, the CIV lines of these quasars are significantly blueshifted by 1000 km s-1 (see also Mazzucchelli et al., 2017). Figure 5 presents the comparison of the CIV black hole masses and accretion rates of these quasars and those of PSO J006+39.
We also derived the black hole mass of PSO J006+39 using the relation of Park et al. (2017, hereafter P17) found for a sample of low–redshift AGNs with high-quality HST spectra (see Table 4). P17 considered two cases, when black hole mass depends on line width as FWHM2 and when it depends as FWHMγ, allowing to be different from a physically expected value of 2. For our comparison, we used the P17 relation found for fixed to 2 which has an intrinsic scatter of 0.43 dex. The black hole mass of PSO J006+39 derived from the relations of VP06 and P17 differs by a factor of two which reflects the typical systematic uncertainties in black hole mass measurements using different relations and emission lines. The uncertainties in the black hole mass and accretion rate of PSO J006+39 related to continuum variability are also within the typical systematic uncertainties.
4 DISCUSSION
4.1 Accretion rate
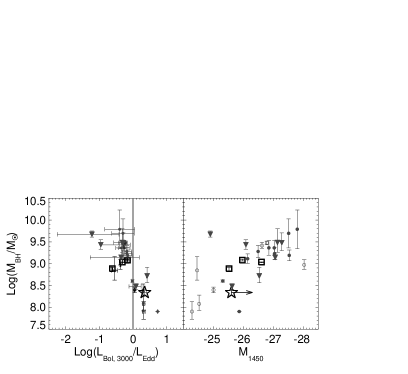
The early analysis of the UV-to-infrared spectra of quasars and Seyfert galaxies by Sun & Malkan (1989) showed that luminous quasars typically have higher accretion rates than low-redshift Seyfert galaxies. The increasing number of quasars found in different surveys at revealed that their Eddington ratios are typically between (Vestergaard & Osmer, 2009; Shen et al., 2008). In Figure 5, we show the black hole masses versus Eddington ratios and absolute magnitudes of high-redshift quasars from the samples of Willott et al. (2010); De Rosa et al. (2011, 2014); Mazzucchelli et al. (2017). As seen in the figure, the accretion rates of high-redshift quasars with SMBHs of ⨀ are also typically between (. There are also less luminous high-redshift quasars with luminosities of and SMBHs of ⨀ which exhibit higher accretion rates (e.g., Willott et al., 2010). De Rosa et al. (2011) analyzed a sample of 19 quasars at including nine low luminosity quasars from Willott et al. (2010). For their sample, De Rosa et al. (2011) found a higher mean Eddington ratio than for luminosity-matched quasars at low redshifts, log/ and log/, respectively. The recent analysis of 11 quasars by Mazzucchelli et al. (2017) did not show significant difference between Eddington ratios and black hole masses of high-redshift and luminosity-matched low-redshift quasars.
As seen in Figure 5, the luminosity of PSO J006+39 is similar to the luminosities of the known luminous quasars at (). However, the mass of the SMBH of PSO J006+39 is 3–4 times smaller than the SMBH masses of these quasars. The high accretion rate of the SMBH of PSO J006+39 compared to other luminous quasars might suggest that it is in an unusual phase of the rapid growth (Pezzulli et al., 2016; Lupi et al., 2016). The efficiency of the growth of SMBHs is expected to decline at masses of 109⨀ caused by gas depletion due to SMBH accretion, quasar outflow and star formation (e.g., Hamann et al., 2002). The high accretion rate of PSO J006+39 indicates that there is probably plenty of gas surrounding its SMBH which provides material for its accretion. The presence of the strong outflow that moves gas away from a SMBH might be indicated by the blueshift of the CIV line. In the known luminous high-redshift quasars, the CIV line is usually significantly blueshifted by 1000 km s-1 (e.g., De Rosa et al., 2014; Mazzucchelli et al., 2017). Compared to these quasars, the CIV line of PSO J006+39 does not show any significant blueshift. Thus, the outflow of gas in PSO J006+39 is probably not too strong to prevent its SMBH from the active growth.
The accretion rate of PSO J006+39 and the amplitude of its intrinsic brightness variations are consistent with the accretion rate–variability distribution of low-luminosity quasars ( erg s-1; Lu et al., 2019, e.g.,). The amplitude of the intrinsic brightness variations of PSO J006+39 estimated from its -band light curve covering 5 months in the quasar rest frame (Koptelova et al., 2017), is 24% (calculated as in Edelson et al., 2002). This amplitude is also consistent (although slightly higher) with brightness variations of 15–19% expected from the dependence of the structure function of quasars on their physical parameters such as luminosity and black hole mass (e.g., MacLeod et al., 2010).

4.2 Metal abundance and ionization of
circumnuclear gas
It is usually assumed that the density and ionization state of the circumnuclear gas in low- and high-redshift quasars are similar (Hamann & Ferland, 1999; Nagao et al., 2006). If this assumption is correct, the flux ratios between different UV lines of high-redshift quasars indicate that their gas metallicities are 3–10 times of solar metallicity even at redshift (Pentericci et al., 2002; Dietrich et al., 2003a, b; Jiang et al., 2007; Kurk et al., 2009). Moreover, the relative abundances of metals seem to have no dependence on redshift (Pentericci et al., 2002; Kurk et al., 2007; De Rosa et al., 2011, 2014; Juarez et al., 2009; Xu et al., 2018). In particular, no redshift evolution was found for the FeII/MgII line ratio up to redshift (see, e.g., De Rosa et al., 2014), suggesting that the metal enrichment of high-redshift quasars happens rapidly and mostly ends before their luminous phase (Hamann et al., 2002).
To infer the metal abundance of PSO J006+39, we examined the following flux ratios: NV/CIV, CIII]/CIV, CII/CIV, and (OI+SiII)/CIV presented in Figure 6. The NV/CIV, CII/CIV, and (OI+SiII)/CIV line ratios involve emission lines observed with FOCAS and NIRSPEC at two different epochs. In general, the fluxes of the same emission lines observed at different epochs could be different. In particular, the high-ionization lines such as NV and CIV might be more variable compared to the CII and OI+SiII lines. The typical brightness change of high-ionization lines in some strongly variable quasars is about 10% over a few years (e.g., Lira et al., 2018). To account for the variations of the NV and CIV line fluxes of PSO J006+39, we added in quadrature 10% of the measured line fluxes to the flux uncertainties of these lines quoted in Table 2. Thus, the errorbars shown in Figure 6 include uncertainties in the measured line fluxes and uncertainties due to the variation of the NV and CIV line fluxes by up to 10% between the epochs of the FOCAS and NIRSPEC observations. Figure 6 also shows the flux ratio between the NV and CIV lines derived by us from the Gemini/GNIRS data in Appendix A. The fluxes of the NV and CIV lines from the GNIRS spectrum were measured at the same epoch and should not be affected by the flux variations of these two lines. Therefore, the NV/CIV flux ratio from the GNIRS spectrum likely represents the typical NV/CIV ratio of PSO J006+39. As seen in Figure 6, both GNIRS and FOCAS/NIRSPEC estimates indicate a relatively high NV/CIV ratio in PSO J006+39 than typically in high-redshift quasars.
To estimate the metallicity of PSO J006+39 from the NV/CIV, CIII]/CIV, and CII/CIV line ratios, we used the results of calculations by Nagao et al. (2006). Using the locally optimally emitting cloud model of Baldwin et al. (1995), Nagao et al. (2006) calculated fluxes of different emission lines relative to the flux of CIV produced by gas clouds of different densities and at different radii, and for the gas metallicity in a range of 0.2 and 10⨀ (see Table 10 of Nagao et al., 2006). To derive the metallicity using the observed line flux ratios, we extrapolated the model predicted line ratios of Nagao et al. (2006). Figure 6 shows the approximate metallicity of PSO J006+39 corresponding to measured line ratios NV/CIV, CIII]/CIV, and CII/CIV. For comparison, Figure 6 also shows the approximate metallicities of the known high-redshift quasars from Dietrich et al. (2003a); Jiang et al. (2007); Kurk et al. (2009); De Rosa et al. (2014) also estimated based on the calculations of Nagao et al. (2006). The relative abundance of nitrogen is proportional to metallicity and therefore the line ratios such as NV/CIV are often used as metallicity indicators of the broad line regions of quasars (Hamann & Ferland, 1993). The NV/CIV line ratio of PSO J006+39 of 1 implies a gas metallicity of 10. The CIII]/CIV and CII/CIV line ratios resulting in metallicities of 2 and 4⨀ might not be reliable metallicity indicators since the CIII] and CII lines originate at different emitting regions with the CIV line (e.g., Hamann et al., 2002). Besides, the CII/CIV and also (OI+SiII)/CIV line ratios might be increasing with redshift as seen for the sample of Jiang et al. (2007). Earlier, Nagao et al. (2006) noted that the (OI+SiII)/CIV line ratio might marginally correlate with redshift (see Figure 24 of Nagao et al., 2006).
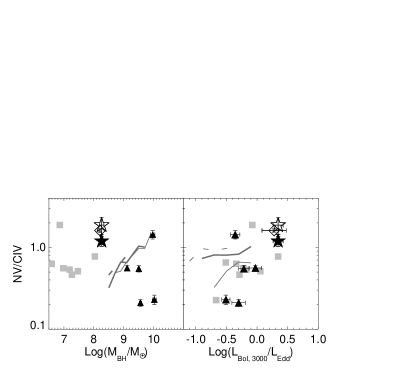
The analysis of a large sample of quasars by Matsuoka et al. (2011) also showed that the NV/CIV line ratio tends to be larger for quasars with more massive SMBHs or higher accretion rates (see also Warner et al., 2003; Shemmer et al., 2004; Matsuoka et al., 2017; Xu et al., 2018). The dependance of the NV/CIV line ratio on black hole mass may possibly result from the mass-metallicity relation of galaxies (e.g., Tremonti et al., 2004). However, its dependence on accretion rate is less clear. Matsuoka et al. (2011) suggested that mass accretion rates onto growing SMBHs might be associated with the post-starburst phase when the mass loss of the post-starburst population of stars (AGB stars) triggers quasar activity. These stars can quickly enrich the central regions of quasars’ host galaxies with nitrogen. Nitrogen might be then ingested into the broad line regions of quasars with stellar winds fuelling the black hole accretion (see also Davies et al., 2007). Given this scenario, the high NV/CIV line ratio of PSO J006+39 might be due to the local overabundance of nitrogen rather than due to the overall high metallicity of its broad line region and the central region of its host galaxy. The quasars showing high NV/CIV line ratios are found to be rare at any redshift which might suggest that this evolutionary phase is relatively short (Araki et al., 2012; Matsuoka et al., 2017). NLSy1 galaxies also typically exhibit somewhat high NV/CIV line ratios for their small black hole masses (Shemmer & Netzer, 2002; Shemmer et al., 2004). In Figure 7, we show the NV/CIV line ratio of PSO J006+39 in comparison with that of the quasars at from Matsuoka et al. (2011), high-redshift quasars at and NLSy1s. As seen in this figure, the NV/CIV line ratio of PSO J006+39 is somewhat high for its black hole mass, but follows the trend of increasing NV/CIV line ratio with accretion rate. Using different emission and absorption lines, the metallicities of the interstellar media in the central regions of NLSy1s are usually estimated to be 1–5 (Shemmer & Netzer, 2002; Nagao et al., 2002; Fields et al., 2005). Given the relatively small SMBH of PSO J006+39 compared to other quasars and its similarity with NLSy1s, the overall metallicity of the central region of its host galaxy is likely a few times smaller than that indicated by the NV/CIV line ratio.
The ratios between the Ly, CIII] and CIV lines are sensitive to the density and ionization state of the circumnuclear gas. In Figure 8, we plot the Ly/CIV and CIII]/CIV line ratios of PSO J006+39 in comparison with the line ratios of quasars from Dietrich et al. (2003a); Warner et al. (2004), NLSy1 galaxies from Kuraszkiewicz et al. (2000) and high-redshift quasars at from De Rosa et al. (2014). The figure also shows the model-predicted line ratios calculated for different values of the gas density and ionization parameter by Kuraszkiewicz et al. (2000) to explain the line ratios of local NLSy1s. As seen in this figure, the Ly/CIV and CIII]/CIV line ratios of PSO J006+39 correspond to a lower ionization parameter of the circumnuclear gas in comparison with the known quasars from De Rosa et al. (2014). Moreover, the Ly/CIV line ratio from the FOCAS–NIRSPEC, and GNIRS data indicates that the ionization parameter of PSO J006+39 may vary significantly depending on the brightness state of the quasar. The low level of gas ionization due to the high density of gas is more typical for the broad line regions of NLSy1s. As also seen in Figure 8, the gas density in the broad line region of PSO J006+39 is consistent with the typical gas densities in the broad line regions of quasars at . Therefore, the overall metal abundance of its circumnuclear gas should not be too different from the typical metal abundances of quasars except for the high nitrogen abundance. The density of the circumnuclear gas of PSO J006+39 seems to be one order higher than typically in the known quasars at (see Figure 8). We note that the actual density/ionization state of the circumnuclear gas of these quasars might be somewhat higher than that indicated by their Ly/CIV line ratios as their Ly line flux is usually severely reduced by neutral hydrogen absorption. The inferred density of gas and low level of ionization similar to that of NLSy1s might imply that PSO J006+39 is at the early evolutionary stage of luminous quasars.

5 CONCLUSIONS
We presented the new Keck/NIRSPEC observations and combined analysis of the Subaru/FOCAS and Keck/NIRSPEC data of the Ly-luminous quasar PSO J006.1240+39.2219 at . Based on these observations, we measured the black hole mass and accretion rate of PSO J006+39. We analyzed the metallicity and ionization state of the circumnuclear gas of PSO J006+39 using the emission lines covered by the Subaru/FOCAS and Keck/NIRSPEC spectra. We summarize our results as follows:
1. From the analysis of the Keck/NIRSPEC spectrum of PSO J006+39, we measured the spectral slope of its UV continuum to be , which agrees but is slightly flatter than the typical continuum slope of quasars. The estimated rest-frame UV absolute magnitude of PSO J006+39 at the epoch of its Keck/NIRSPEC observations is . It might differ at different epochs depending on the brightness state of the quasar.
2. The mass of the SMBH of PSO J006+39 estimated using the CIV line and the relation of VP06 is and is about 3–4 times smaller than the typical masses of the SMBHs of high-redshift quasars within a luminosity range of .
3. The SMBH of PSO J006+39 accretes at 2 times of its Eddington luminosity, which is higher than the typical accretion rates of high-redshift quasars of similar luminosities. The high accretion rate of the SMBH of PSO J006+39 suggests that it is likely in the early stage of its formation, observed during the phase of the intensive growth through accretion of surrounding gas. As indicated by the negligible blueshift of the CIV emission line of PSO J006+39, the quasar outflow in PSO J006+39 is probably not very significant and does not prevent its SMBH from the efficient and rapid growth. We might also suggest that star formation in PSO J006+39 is probably less affected by the quasar feedback than in other known luminous high-redshift quasars.
4. The metallicity of the circumnuclear gas of PSO J006+39 of 10 indicated by the NV/CIV line ratio is somewhat high for the mass of its SMBH. Such high metallicity is unlikely in the early phases of black hole formation. On the other hand, the NV/CIV line ratio of PSO J006+39 might not be due to its high metallicity. It might reflect a particular evolutionary phase characterized by the high abundance of nitrogen. This high abundance of nitrogen might have been produced by the post-starburst population of stars which could trigger the quasar activity of PSO J006+39 by providing the fuel for black hole accretion. The Ly/CIV and CIII]/CIV line ratios also indicate a lower level of ionization of the circumnuclear gas than usually in quasars, which is more typical for NLSy1 galaxies, – the low-redshift analogues of high-redshift quasars. Thus, the evolutionary phase of PSO J006+39 differs from that of other known high-redshift quasars of similar luminosities. Its intensively growing black hole might be in the early phase of quasar activity.
References
- Araki et al. (2012) Araki, N., Nagao, T., Matsuoka, K., et al. 2012, A&A, 543, A143
- Baldwin et al. (1995) Baldwin, J., Ferland, G., Korista, K., & Verner, D. 1995, ApJS, 455, 119
- Bañados et al. (2016) Bañados, E., Venemans, B. P., Decarli, R., et al. 2016, ApJS, 227, 11
- Bañados et al. (2018) Bañados, E., Venemans, B. P., Mazzucchelli, C., et al. 2018, Nature, 553, 473
- Chambers et al. (2016) Chambers, K.C., Magnier, E. A., Metcalfe, N., et al. 2016, arXiv:1612.05560
- Coatman et al. (2017) Coatman, L., Hewett, P. C., Banerji, M., et al. 2017, MNRAS, 465, 2120
- Collier et al. (2001) Collier, S., Crenshaw, D. M., Peterson, B. M., et al. 2001, ApJ, 561, 146
- Davies et al. (2007) Davies, R. I., Müller Sánchez, F., Genzel, R., et al. 2007, ApJ, 671, 1388
- De Rosa et al. (2011) De Rosa, G., Decarli, R., Walter, F., et al. 2011, ApJ, 739, 56
- De Rosa et al. (2014) De Rosa, G., Venemans, B. P., Decarli, R., et al. 2014, ApJ, 790, 145
- Decarli et al. (2010) Decarli, R., Falomo, R., Treves, A., et al. 2010, MNRAS, 402, 2441
- Dietrich et al. (2003a) Dietrich, M., Appenzeller, I., Hamann, F., et al. 2003a, A&A, 398, 891
- Dietrich et al. (2003b) Dietrich, M., Hamann, F., Shields, J. C., et al. 2003b, ApJ, 589, 722
- Dye et al. (2018) Dye, S., Lawrence, A., Read, M. A., et al. 2018, MNRAS, 473, 5113
- Edelson et al. (2002) Edelson, R., Turner, T. J., Pounds, K., et al. 2002, ApJ, 568, 610
- Fields et al. (2005) Fields, D. L., Mathur, S., Pogge, R. W., et al. 2005, ApJ, 634, 928
- Hamann & Ferland (1993) Hamann, F., & Ferland, G. 1993, ApJ, 418, 11
- Hamann & Ferland (1999) Hamann, F., & Ferland, G. 1999, ARA&A, 37, 487
- Hamann et al. (2002) Hamann, F., Korista, K. T., Ferland, G. J., Warner, C., & Baldwin, J. 2002, ApJ, 564, 592
- Hawarden et al. (2001) Hawarden, T. G., Leggett, S. K., Letawsky, M. B., Ballantyne, D. R., & Casali, M. M. 2001, MNRAS, 325, 563
- Hewett et al. (2006) Hewett, P. C., Warren, S. J., Leggett, S. K., & Hodgkin, S. T. 2006, MNRAS, 367, 454
- Jiang et al. (2006) Jiang, L., Fan, X., Hines, D. C., et al. 2006, AJ, 132, 2127
- Jiang et al. (2007) Jiang, L., Fan, X., Vestergaard, M., et al. 2007, AJ, 134, 1150
- Jiang et al. (2016) Jiang, L., McGreer, I. D., Fan, X., et al. 2016, ApJ, 833, 222
- Juarez et al. (2009) Juarez, Y., Maiolino, R., Mujica, R., et al. 2009, A&A, 494, L25
- Kaiser et al. (2002) Kaiser, N., Aussel, H., Burke, B. E., et al. 2002, Proc. SPIE, 4836, 154
- Kaiser et al. (2010) Kaiser, N., Burgett, W., Chambers, K., et al. 2010, Proc. SPIE, 7733, 77330E
- Koptelova et al. (2017) Koptelova, E., Hwang, C.-Y., Yu, P.-C., Chen, W.-P., & Guo, J.-K. 2017, Scientific Reports, 7, 41617
- Koptelova et al. (2019) Koptelova, E., & Hwang, C.-Y. 2019, arXiv:1907.02721, ApJL in press
- Kuraszkiewicz et al. (2000) Kuraszkiewicz, J., Wilkes, B. J., Czerny, B., & Mathur, S. 2000, ApJ, 542, 692
- Kurk et al. (2007) Kurk, J. D., Walter, F., Fan, X., et al. 2007, ApJ, 669, 32
- Kurk et al. (2009) Kurk, J. D., Walter, F., Fan, X., et al. 2009, ApJ, 702, 833
- Latour et al. (2015) Latour, M., Fontaine, G., Green, E. M., & Brassard, P. 2015, A&A, 579, 39
- Lira et al. (2018) Lira, P., Kaspi, S., Netzer, H., et al. 2018, ApJ, 865, 56
- Lu et al. (2019) Lu, K.-X., Huang, Y.-K., Zhang, Z.-X., et al. 2019, ApJ, 877, 23
- Lupi et al. (2016) Lupi, A., Haardt, F., Dotti, M., et al. 2016, MNRAS, 456, 2993
- Lusso et al. (2015) Lusso, E., Worseck, G., Hennawi, J. F., et al. 2015, MNRAS, 449, 4204
- MacLeod et al. (2010) MacLeod, C. L., Ivezić, Ž., Kochanek, C. S., et al. 2010, ApJ, 721, 1014
- Madau et al. (2014) Madau, P., Haardt, F., & Dotti, M. 2014, ApJ, 784, L38
- Malkan (1983) Malkan, M. A. 1983, ApJ, 268, 582
- Mathur (2000) Mathur, S. 2000, MNRAS, 314, L17
- Matsuoka et al. (2017) Matsuoka, K., Nagao, T., Maiolino, R., et al. 2017, A&A, 608, A90
- Matsuoka et al. (2011) Matsuoka, K., Nagao, T., Marconi, A., Maiolino, R., & Taniguchi, Y. 2011, A&A, 527, A100
- Matsuoka et al. (2018) Matsuoka, Y., Iwasawa, K., Onoue, M., et al. 2018, ApJS, 237, 5
- Mazzucchelli et al. (2017) Mazzucchelli, C., Bañados, E., Venemans, B. P., et al. 2017, ApJ, 849, 91
- McLean et al. (1998) McLean, I. S., Becklin, E. E., Bendiksen, O., et al. 1998, Proc. SPIE, 3354, 566
- Mortlock et al. (2011) Mortlock, D. J., Warren, S. J., Venemans, B. P., et al. 2011, Nature, 474, 616
- Nagao et al. (2006) Nagao, T., Marconi, A., & Maiolino, R. 2006, A&A, 447, 157
- Nagao et al. (2002) Nagao, T., Murayama, T., Shioya, Y., & Taniguchi, Y. 2002, ApJ, 575, 721
- Onoue et al. (2019) Onoue, M., Kashikawa, N., Matsuoka, Y., et al. 2019, arXiv:1904.07278, ApJ, in press
- Osterbrock & Pogge (1985) Osterbrock, D. E., & Pogge, R. W. 1985, ApJ, 297, 166
- Park et al. (2017) Park, D., Barth, A. J., Woo, J.-H., et al. 2017, ApJ, 839, 93
- Pentericci et al. (2002) Pentericci, L., Fan, X., Rix, H.-W., et al. 2002, AJ, 123, 2151
- Peterson (1997) Peterson, B. M. 1997, An Introduction to Active Galactic Nuclei (Cambridge: Cambridge Univ. Press)
- Pezzulli et al. (2016) Pezzulli, E., Valiante, R., & Schneider, R. 2016, MNRAS, 458, 3047
- Planck Collaboration et al. (2016) Planck Collaboration XIII, 2016, A&A, 594, A13
- Richards et al. (2006) Richards, G. T., Lacy, M., Storrie-Lombardi, L. J., et al. 2006, ApJS, 166, 470
- Romano et al. (2002) Romano, P., Turner, T. J., Mathur, S., & George, I. M. 2002, ApJ, 564, 162
- Rousselot et al. (2000) Rousselot, P., Lidman, C., Cuby, J.-G., Moreels, G., & Monnet, G. 2000, A&A, 354, 1134
- Selsing et al. (2016) Selsing, J., Fynbo, J. P. U., Christensen, L., & Krogager, J.-K. 2016, A&A, 585, A87
- Shemmer & Netzer (2002) Shemmer, O., & Netzer, H. 2002, ApJ, 567, L19
- Shemmer et al. (2004) Shemmer, O., Netzer, H., Maiolino, R., et al. 2004, ApJ, 614, 547
- Shen et al. (2008) Shen, Y., Greene, J. E., Strauss, M. A., Richards, G. T., & Schneider, D. P. 2008, ApJ, 680, 169
- Sun & Malkan (1989) Sun, W.-H., & Malkan, M. A. 1989, ApJ, 346, 68
- Tang et al. (2017) Tang, J.-J., Goto, T., Ohyama, Y., et al. 2017, MNRAS, 466, 4568
- Tang et al. (2019) Tang, J.-J., Goto, T., Ohyama, Y., et al. 2019, MNRAS, 484, 2575
- Tremonti et al. (2004) Tremonti, C. A., Heckman, T. M., Kauffmann, G., et al. 2004, ApJ, 613, 898
- Vanden Berk et al. (2001) Vanden Berk, D. E., Richards, G. T., Bauer, A., et al. 2001, AJ, 122, 549
- Vestergaard & Peterson (2006) Vestergaard, M., & Peterson, B. M. 2006, ApJ, 641, 689
- Vestergaard & Osmer (2009) Vestergaard, M., & Osmer, P. S. 2009, ApJ, 699, 800
- Volonteri (2010) Volonteri, M. 2010, A&A Rev., 18, 279
- Volonteri & Rees (2005) Volonteri, M., & Rees, M. J. 2005, ApJ, 633, 624
- Walter et al. (2009) Walter, F., Riechers, D., Cox, P., et al. 2009, Nature, 457, 699
- Wang & Wei (2006) Wang, J., & Wei, J. Y. 2006, ApJ, 648, 158
- Wang et al. (2004) Wang, J., Wei, J.-Y., & He, X.-T. 2004, Chinese J. Astron. Astrophys., 4, 415
- Wang et al. (2013) Wang, R., Wagg, J., Carilli, C. L., et al. 2013, ApJ, 773, 44
- Warner et al. (2003) Warner, C., Hamann, F., & Dietrich, M. 2003, ApJ, 596, 72
- Warner et al. (2004) Warner, C., Hamann, F., & Dietrich, M. 2004, ApJ, 608, 136
- Willott et al. (2010) Willott, C. J., Albert, L., Arzoumanian, D., et al. 2010, AJ, 140, 546
- Willott et al. (2017) Willott, C. J., Bergeron, J., & Omont, A. 2017, ApJ, 850, 108
- Wu et al. (2015) Wu, X.-B., Wang, F., Fan, X., et al. 2015, Nature, 518, 512
- Xu et al. (2018) Xu, F., Bian, F., Shen, Y., et al. 2018, MNRAS, 480, 345
- Zheng & Malkan (1993) Zheng, W., & Malkan, M. A. 1993, ApJ, 415, 517