You Write Like You Eat:
Stylistic variation as a predictor of social stratification
Abstract
Inspired by Labov’s seminal work on stylistic variation as a function of social stratification, we develop and compare neural models that predict a person’s presumed socio-economic status, obtained through distant supervision, from their writing style on social media. The focus of our work is on identifying the most important stylistic parameters to predict socio-economic group. In particular, we show the effectiveness of morpho-syntactic features as stylistic predictors of socio-economic group, in contrast to lexical features, which are good predictors of topic.
1 Introduction
In 1966, linguist William Labov set out to corroborate experimentally his observation that in New York City, variation in the pronunciation of postvocalic [r] (as in "car", "for", "pour") is subject to social stratification that is, that NYC people with different socio-economic backgrounds will realise that phoneme in different ways Labov (1966, 2006).
Avoiding artificially elicited language in favour of spontaneous language use, Labov picked three large department stores from the top, middle, and bottom of the price/prestige range, under the assumption that customers (and salespersons) of these establishments would belong to different social strata. "[Labov’s study] was designed to test two ideas […]: first, that the variable (r) is a social differentiator in all levels of New York City speech; and second, that casual and anonymous speech events could be used as the basis for a systematic study of language." (Labov, 2006, p. 40. Italics ours.)
Inspired by Labov’s work and the recent surge of interest in computational social science (Cioffi-Revilla, 2016) and computational sociolinguistics (e.g. Johannsen et al., 2015), we set out to investigate whether and to what extent variations in writing style, analysed in terms of several linguistic variables, are influenced by socio-economic status (RQ1; see below). To do so, we use user-generated restaurant reviews on social media. User-generated content bears important similarities to Labov’s "casual and anonymous speech events" on at least two fronts: 1) anonymity is here still preserved since we are not including personal information about the authors; furthermore 2) social media are now recognised in the literature as a source of naturally (i.e. casual) occurring text that can be used to investigate various sociolinguistic phenomena Herdağdelen (2013); Pavalanathan and Eisenstein (2015).
Labov’s use of the prestige of a store as a proxy for the social class of its customers and employees could be seen as a precursor of distant supervision, an approach which we employ in this study. We leverage online restaurant reviews, and our assumption for acquiring labels is that the socio-economic group of a restaurant’s patrons is in some measure predictable from its price range.
Using this data, we seek to address the following research questions: (a) To what extent can socio-economic status be predicted from a person’s text (RQ1); (b) Can socio-economic groups be differentiated on the basis of syntactic features, compared to lexical features (RQ2)?
Contributions
Our contribution consists of 1) a silver dataset containing user-generated reviews labelled with a (distantly obtained) approximation of the socio-economic status of their author, based on the price range of restaurants; 2) a neural model of stylistic variation that can predict socio-economic status with good performance, and 3) an account of the most important features of style that are predictive of socio-economic status in this domain. Our work can be viewed as a contemporary take on Labov’s approach, with hundreds of subjects instead of only a few, and with a much larger range of proxies for socio-economic grouping, exploiting user-generated content as a natural communicative setting in which stylistic parameters can be sourced to study variation.
To favour reproducibility and future work, we make all code available at https://github.com/anbasile/social-variation.111The repository contains all code and models which can be run by acquiring the freely available Yelp dataset.
2 Data and Labels
To work on our questions we need user-generated texts, and a proxy to facilitate distant labelling of an author’s socio-economic status. Reviews are ideal sources of user-generated content: they are not too noisy and are of sufficient length to enable paralinguistic and stylistic parameters to be identified. Restaurant reviews also carry information about the restaurants themselves, especially their price range, which we can use as proxy (see below). We use the Yelp! Dataset: it is released twice a year from Yelp!, a social network where users discuss and review businesses like restaurants, plumbers, bars, etc.222This data is released within the context of the Yelp! Challenge, a multi-domain shared task which has attracted attention in NLP primarily for benchmarking text classification (e.g. Yang et al., 2016)). We use the dataset released for Round 11.
The review corpus contains more than 5 million documents, from over 1 million authors, with a Zipfian distribution: a small number of authors publish most of the reviews, while most of the authors only leave one review. Grouping reviews per author and filtering out authors with only one review reduces the final dataset to fewer than a thousand authors, though this set of reviews is large and allows us to infer demographic information about the reviewers (see also Hovy et al., 2015).
Language
The Yelp! dataset contains reviews written in multiple languages, though the vast majority are in English. We use langid.py (Lui and Baldwin, 2012) to automatically detect and filter out non-English instances. The need for both good parsing performance and large quantity of text limits us from working with data from other languages.
Price range as proxy
To annotate the Yelp! dataset with labels which denote the social class of the authors we adopt the paradigm of distant supervision. We take the price range of the restaurant as a proxy for socio-economic status. The average price of a meal in a restaurant is encoded by four labels: $, $$, $$$, $$$$. As a first, coarse step, we accept this representation and divide our population into four groups.
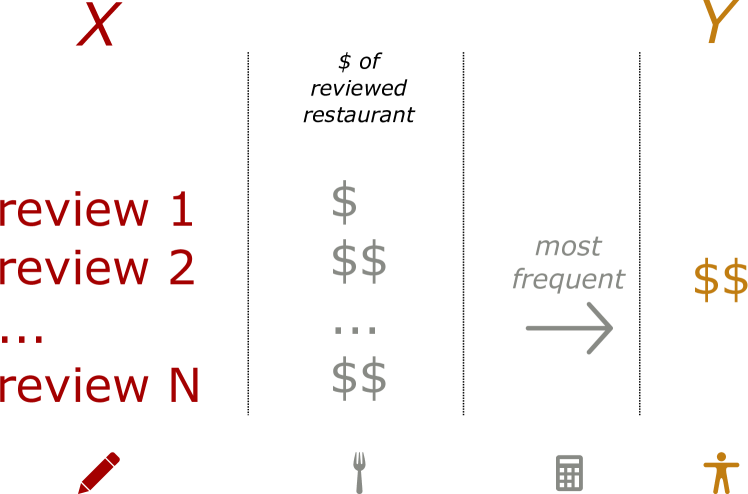
We group all of the reviews per author and represent each author as a vector, where each element is the price range of a restaurant reviewed by the user. We compute the mode of this vector and the resulting value becomes our silver label. In short, we use the price label of a restaurant as an indicator of the socio-economic group(s) to which its patrons belong, under the assumption that the price-range of the most visited venue will be the most indicative of the socio-economic status of a given reviewer. Figure 1 illustrates the process.
This coarse representation must undergo further refinement, to satisfy three requirements:
-
(a)
Label reliability: we want the most representative users only, that is, only those users whose restaurant price-range falls consistently within a restricted set of categories;
-
(b)
Sufficient textual evidence: we want as much text as possible in general, and the highest possible number of reviews per user;
-
(c)
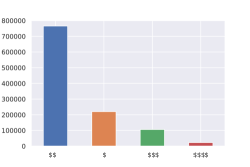
Balance: the raw data is highly skewed towards class $$ (Figure 2), but for our experiments we want equally represented classes to avoid any size-related effects.
In order to address (a), we employ an entropy-based strategy to filter out noisier data points. This is described below. For the size- and balance-related points (b) and (c), we perform two operations over the entropy-filtered dataset. First, we require a minimum number of reviews per author to ensure sufficient evidence per reviewer without excluding too many instances; we empirically set this threshold to nine reviews. Second, we downsample the larger classes to the size of the smallest class.
Entropy-based refinement
Table 1 shows two data points for two instances (reviewers and ): both consist of 16 reviews and both got assigned class 2 (i.e. $$) as a label, since 2 is the class of the restaurant that both authors visited most. However, as can be seen from the column labels, the first reviewer visited restaurants belonging to all four classes, while the second one only visited restaurants of class 2: the second reviewer is clearly a less noisy data point.
| user | labels | y | entropy |
|---|---|---|---|
| a | {2: 5, 4: 4, 1: 3, 3: 4} | 2 | 1.37 |
| b | {2: 16} | 2 | 0.00 |
To maximise the ‘purity’ or consistency of reviews associated with each author, we compute the entropy over the label vector: the lower the entropy, the less noisy the reviewer and the more reliable the assigned label (y). In practice, we filter out the authors whose entropy score is above the mean of the whole dataset, estimated after removing authors with one review only.
Table 2 shows the final label and token distribution, after filtering and downsampling. In Figure 3, we show two sample reviews, one from class $ and one from class $$$$.
| class | authors | tokens |
|---|---|---|
| $ | 138 | 10685 |
| $$ | 138 | 11874 |
| $$$ | 138 | 14872 |
| $$$$ | 138 | 16595 |
3 Label validation: Readability Scores
While distant supervision allows the inference of socio-economic status with minimal manual intervention, it also makes interpretation of results challenging due to the threat of circularity involved in the process of collecting data and modelling it at the same time. Thus, We sought some external label validation that would further ensure the soundness of our labels (and thus our strategy).
Flekova et al. (2016) showed that the readability of a text correlates with income: the higher the readability, the higher the income. This is also consistent with observations that readability correlates with educational level (Davenport and DeLine, 2014), which in itself plays a role in determining a person’s socio-economic profile (Bourdieu, 2013).
Assuming that our labels signal a person’s income bracket, we test whether they correlate with readability scores, which would provide external validation of our distant labelling strategy.
We follow Flekova et al. (2016) and use a battery of readability metrics: Automated Readability Index, Coleman Liau Index, Dale-Chall Score, Flesch-Kincaid Ease, Gunning Fog score, Linsear Write Formula and the Lix index.333We use the implementation of these functions contained in the textstat python library: https://github.com/shivam5992/textstat. The metrics differ in how they measure readability, but they all rely on features such as average number of syllables per sentence, average sentence length, or the percentage of arbitrarily defined complex words in the text. We expect average readability to increase across groups from group 1 ($) to group 4 ($$$$) for all metrics except the Flesch-Reading score, where the metric’s definition leads us to expect an inverse correlation Flesch (1943).
As shown in Table 3, with the exception of Linsear, the correlations go in the predicted direction: average readability score for group K is always higher when compared to group K-1. A Kruskal-Wallis test confirms that differences between groups are significant at p < 0.001.
| Metrics | $ | $$ | $$$ | $$$$ |
|---|---|---|---|---|
| ARI | 6.48 | 6.52 | 6.59 | 6.91 |
| Coleman-Liau | 7.58 | 7.76 | 8.07 | 8.41 |
| Dale-Chall | 6.65 | 6.76 | 6.94 | 7.00 |
| Flesch-Kincaid | 5.42 | 5.55 | 5.59 | 5.82 |
| Flesch-Reading | 81.06 | 79.93 | 79.10 | 77.39 |
| Gunning-Fog | 13.46 | 13.70 | 14.08 | 14.23 |
| Linsear | 6.00 | 5.80 | 5.83 | 5.72 |
| Lix | 30.70 | 31.39 | 31.69 | 32.71 |
4 Task definition and rationale
The prediction of socio-economic status from text can be viewed as a new dimension in the task of author profiling. Due to the nature of the labels (ranging across four classes related to increasing price), this could be seen as an ordinal regression problem. However, following standard practice within the author profiling literature Rangel Pardo et al. (2015); Rangel et al. (2016), especially regarding modelling age (where real values are binned into discrete classes), we treat this as a classification task. This approach results in a more conservative evaluation strategy (since at test time, a class is evaluated as either accurate or not). In an ordinal setting, one could weight classifier output by its proximity to the target class (e.g. $is closer to $$than to $$$). Given the novelty of our task and data, where evaluation benchmarks and settings are not yet available, we deem the more conservative strategy as the most appropriate one.
Given a (collection of) review(s), the task is thus to predict the socio-economic status of its author, assigning one of four classes {$,$$,$$$,$$$$}. First we run a lexicon-based sparse model (the lexical baseline) which we take as a strong baseline (Section 5). Subsequently, we run a battery of dense models experimenting with a variety of abstractions over the lexicon (Section 6).
Given the relative novelty of the task, we consider model performance as secondary to the broader scientific goal of identifying which features are determinants of variation as a function of socio-economic group. Thus, we focus on models that use different features, at increasing removes from lexical or topic-based information, seeking to identify the main parameters of variation.
5 Lexical baseline model
Our baseline uses an ‘open vocabulary’ approach Schwartz et al. (2013), a bag-of-word (BOW) representation of the text including all the words in the corpus, resulting in a vocabulary of 15858 items. We extract (3-6) word and character n-grams; no pre-processing is applied. We feed these features to a Logistic Regression model, which has the advantage of being highly interpretable, allowing us to investigate to what extent the model relies on topic words.
Using the Scikit-learn implementation Pedregosa et al. (2011), we train the model on 80% of the data, and test it on the remaining 20%. With an F1 of , the performance of our lexical baseline is well above a random baseline ().
Analysis
The scores of this simple model are most likely influenced by topic. While successful, a system assigning high weights to features strongly associated with cheap/expensive food, will limit the scope of our conclusions on stylistic variation. In other words, the features identified are more related to the restaurants themselves than to the writing characteristics of their authors. In Table 4 we report the most important features (words) per class.
| $ | $$ | $$$ | $$$$ |
|---|---|---|---|
| fast | tried | at | excellent |
| kids | happy | clubs | gras |
| coffee | staff | wynn | we |
| customer | won | music | las |
| clean | put | pretty | steak |
| they | phoenix | night | tasting |
| order | find | club | foie |
| came | try | vegas | wine |
| always | place | buffet | course |
| pizza | salsa | hotel | vega |
The output can be easily interpreted. In the least expensive class, we find words like coffee and pizza. The second class is noisier, as the model appears to capture aspects of the reviews related to service rather than food. The two most expensive classes confirm our hypothesis since we find words like Vegas, Wynn (a casino in Las Vegas, USA), [foie-?]-gras, wine and steak.
What we observe from this feature analysis is that by relying on words we are capturing aspects of restaurants, to the detriment of a properly stylistic account, whose features would be more author- than topic-oriented. Capturing author-related stylstic features requires an abstraction away from the lexicon (though not necesssarily from non-content based featues of the lexicon, such as word length or structure). This might yield lower performance, but our main goal is to understand the role played by morpho-syntactic and other non-lexical dimensions of social variation, rather than achieving the highest possible score in classifying reviews.
6 Capturing Style
Style and variation can be found at different levels of linguistic abstraction (Eckert and Rickford, 2001). We experiment with a selection of features carefully tailored to capture different aspects of the phenomenon; each feature serves as a representation to be fed to a classifier.
First, we preserve the surface structure but get rid of most lexical information, using the bleaching approach proposed by van der Goot et al. (2018) (Section 6.1). Second, we remove words and replace them with POS tags, so as to cancel out topic information entirely (Section 6.2). In the final representation, we use dependency trees and expand the POS tags into triplets to investigate syntactic variation (Section 6.3).
In order to properly model the structural information encoded in these non-lexical feature representations, we use a Convolutional Neural Network (CNN) classifier (LeCun et al., 1995), rather than rely on sparse models as we did for our lexical baseline.444Although the aim of this paper is not a comparison between sparse and dense models over different representations, we provide all scores for all models in the appendix. The model consists of a single convolutional layer coupled with a sum-pooling operation; a Multi-Layer Perceptron on top improves discrimination performance between classes. We use the Adam optimizer (Kingma and Ba, 2015) with a fixed learning rate (0.001) and L2 regularization (Ng, 2004); a dropout layer (0.2) (Srivastava et al., 2014) helps to prevent overfitting. For the implementation we rely on spaCy (Honnibal and Johnson, 2015).
6.1 Bleached representation
Recently, van der Goot et al. (2018) introduced a language-independent representation termed bleaching for capturing gender differences in writing style, while abstracting away from lexical information. Bleaching preserves surface information while obfuscating lexical content. This allows a focus on lexical variation as a function of personal style, while reducing the possible influence of topic as a determining factor.
We experiment with this idea under the assumption that authors belonging to different groups will show a difference in the formality of their writing, and that a bleached representation is well suited for capturing such a difference.
In particular, we hypothesise that some of our target classes are typified by certain writing styles which differ in their formality and the extent to which they approach informal speech. Thus, we aim to capture the difference between a plainer writing style, with few or no interjections, without abbreviations and/or emojis; and a writing style which more closely approximates speech, making substantial use of exclamation marks and emojis for emphasis, abbreviations, possibly incorrect spelling of words to approximate phonetic form and broad use of direct speech.
As an example, the following is a list of sentences taken from different classes of our dataset:
- $
-
– hand-made pepperoni rolls….. oh yeah
- $$
-
– Their marinara is dee-lish,Super tasty!!!
- $$$
-
– When Jet first opened, I loved the place.
- $$$$
-
– compared to pierre gagnaire in paris, the food here is way less ambitious
We note that orthography seems to differ significantly between these samples: the first two would more likely be viewed as typical web texts, while the last two show a more considered or premeditated writing style.
| token | bleached representation |
|---|---|
| I | X_01_True_V_2117 |
| really | xxxxxx_06_True_CCVVCC_81 |
| love | xxxx_06_True_CVCVCC_15 |
| pizza | xxxxx_04_True_CCVC_617 |
| ! | !_01_False_!_21 |
Table 5 shows some examples of the bleached representation under the abstraction we chose to experiment with, which are as follows. First, we extract the surface form of a word and render each character as either X or x, depending on whether it is capitalised or not. Second, we extract the length of each word prefixed with a 0 to avoid confusion with the frequency of the word (indicated by the number at the end of the bleached string). A boolean label signals whether the token is alphanumeric or not: this feature can be informative in capturing, for instance, the use of emojis. Finally, we approximate the original surface form by substituting all the English vowels with the letter V and all the English consonants with the letter C.
6.2 Morpho-syntax
As a more definitive move away from lexical information, we label each word by its POS-tag, using spaCy (Honnibal and Johnson, 2015) and the universal tagset (Petrov et al., 2012). Within this experiment, we train our model using only such a representation, thus inhibiting topic-related features from becoming prominent. We assume that a good performance of the classifier under such conditions provides support for the existence of phenomena related to social variation at the morpho-syntactic level.
6.3 Dependency trees
Previous research on stylistic variation as a function of age and income shows an important difference in syntax use between groups (Flekova et al., 2016). However, this work reports results based on a shallow interpretation of syntax, i.e. the authors measure the ratio of POS tags in the text: such a strategy is dictated by the relatively poor performance of parsers on the domain investigated by Flekova et al. (2016), i.e. Twitter. Yelp! reviews are closer to canonical English, which allows us to obtain a full syntactic analysis of each document, adopting a strategy closer to that of Johannsen et al. (2015).
We first parse our corpus using a pre-trained dependency parser, namely Honnibal and Johnson (2015)’s parser555We use the largest pre-trained available model, en_core_web_lg., which achieves state-of-the-art accuracy on English. Figure 4 shows an example.
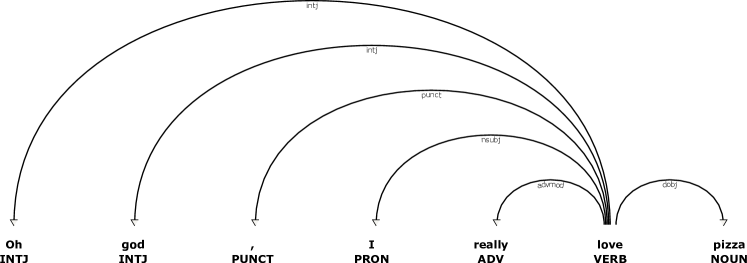

We then transform each word into a triplet that consists of: 1) the POS tag of the word, 2) the incoming arc and 3) the POS tag of the head, as shown in Figure 5. This is fed as feature to the classifier. Johannsen et al. (2015) use a ‘bag-of-relations’ representation in combination with a test, discarding some structural information in order to ease comparison across languages: here, we rely on the performance of a sequence model (i.e. the CNN classifier) over the transformed dependency tree. As we do in Section 6.2, we assume that a good performance of the classifier points toward the existence of significant syntactic patterns between groups.
7 Evaluation
We focus on the comparison of several models against one another and especially against the lexical baseline. This will let us single out which features, or which levels of abstraction (see Section 6), best model style when topic information is reduced or eliminated. For completeness, we also report on the results obtained by a CNN-based version of the LR lexical baseline from Section 5.
In Table 6, we report results training our models on 80% of the data and testing them on the remaining 20%, using exactly the same split as for the simple lexical and random models (Section 5). Note that the results are averaged over two runs: we ran the CNN twice for each representation, since it is known that multiple runs of the same neural model on the same dataset can yield significantly different results due to underlying random processes (Reimers and Gurevych, 2017).
| model | F1 |
|---|---|
| random baseline | 0.25 |
| LR BOW (lexical) baseline | 0.53 |
| CNN lexical | 0.54 |
| CNN pos tags | 0.33 |
| CNN dependency tree | 0.52 |
| CNN bleaching | 0.46 |
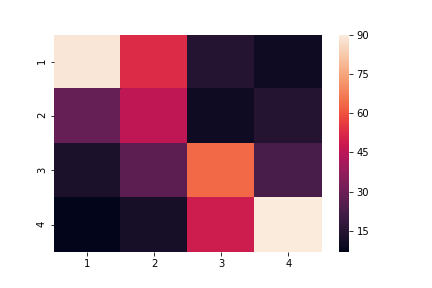
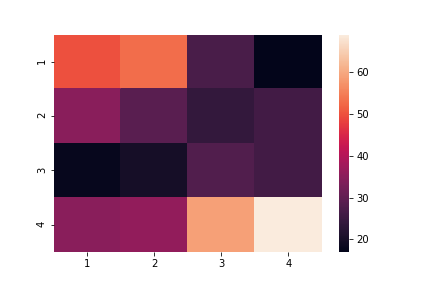
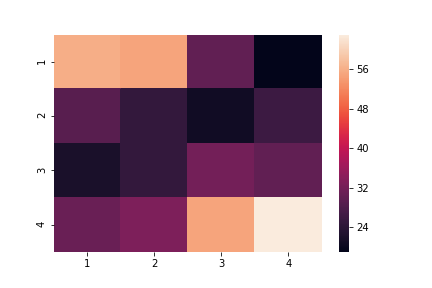
As a general comment, from a class perspective, we observe that class 4 is the easiest to model, while class 2 is the most difficult, for all CNN models (see the confusion matrices in Figure 6). This complements the observation made earlier in relation to Table 4, where it was noted that class 2 is also noisier at the lexical level.
Lexical
This model serves as a comparison to the LR-based lexical baseline model, while also providing a CNN-based version of this model to ensure fair comparison of a lexical or topic-based strategy against other, non-lexical, CNN models. The lexical CNN achieves approximately the same results as the LR-based lexical baseline, with an overall F-score of 0.54.
Bleaching
Our CNN model trained on bleached representations shows the lowest performance, though still above random baseline.666When this feature is used in the logistic regressor instead, it shows good performance. See the Appendix for details. This suggests that abstract, word-level features do have some predictive value, but they do not capture enough lexical content to surpass a simple lexical model that classifies based on topic-based features. At the same time, this result also indicates that the shape of the lexical items used by authors (the outcome of bleaching) is a less reliable predictor of socio-economic status than certain morpho-syntactic properties.
POS tags
When using only POS information without words, we find that, as can be expected, performance drops (). From the confusion matrix reported in Figure 6, it appears once again that class 2 is the hardest class to predict.
Dependency Trees
As an abstraction strategy, this works best out of the three we have tried, and is competitive with the neural lexical model and the logistic regressor. As Figure 6 shows, the model is also predicting each of the four classes more consistently than the other two models. This suggests that we are able to leverage syntactic information as a predictor of social variation, echoing the findings of Johannsen et al. (2015) in a different sociolinguistic domain. Higher accuracy is also achieved without any topic bias, thus providing better evidence that we moved away from a model that predicts which restaurants are the topic of discussion, and moved closer to an account of authorial style.
We believe these results provide a positive answer to our main research question (RQ1): to the extent that authors can be distantly grouped according to their socio-economic status, it is possible to differentiate among them on the basis of stylistic parameters. As for our other question, we find that the two strongest predictors of our labels are lexical information on the one hand, and syntactic dependencies on the other. We attribute this to the fact that these models are ultimately classifying different things: a lexically-based model relies on topic and thus predicts the type of restaurant. A syntax-based model is a better approximation to individual style. That these two models achieve very similar F1 scores (0.52 vs 0.54) can be attributed to the fact that filtering and downsampling created a more consistent dataset in which authors were consistently grouped in specific restaurant price ranges. These two models show that it is possible to differentiate among the resulting classes both on the basis of type of establishment (the lexical model) and on the basis of stylistic features in the writing style of its patrons (the syntactic model).
8 Related Work
The idea that socio-economic status influences language use and is a determinant of language variation has been central to sociolinguistic theory for a long time (Bernstein, 1960; Labov, 1972, 2006). Labov’s work could be viewed as an early form of distant supervision, exploiting established categories (e.g. the price and status of establishments such as department stores) to draw inferences about variables related to social stratification. The work presented here takes inspiration from this paradigm, and contributes to the growing literature on distant supervision in NLP (Read, 2005), especially in social media (e.g. Plank et al., 2014; Pool and Nissim, 2016; Fang and Cohn, 2016; Basile et al., 2017; Klinger, 2017, inter alia).
Computational work on style – i.e. linguistic features characteristic of an individual or group Biber (1988) – has focussed on demographic or personal variables, ranging from geographical location and dialect Zampieri et al. (2014); Han et al. (2014); Eisenstein (2013) to age and gender Argamon et al. (2007); Newman et al. (2008); Sarawgi et al. (2011); Johannsen et al. (2015); Hovy and Søgaard (2015), as well as personality Argamon et al. (2005); Verhoeven et al. (2016); Youyou et al. (2015). An general overview of computational sociolinguistics can be found in Nguyen et al. (2016).
By contrast, there has been relatively little work on socio-economic status. Flekova et al. (2016) show that textual features can predict income, demonstrating a relationship between this and age. Lampos et al. (2016) also report good results on inferring the socio-economic status of social media users from text. Like the present work, they use distant supervision, exploiting occupation information in Twitter profiles. Our work differs from these precedents in that we investigate a broader range of lexical, morphological and syntactic features in a novel domain.
Previous work specifically on the language of food has also found that social media data can be used to validate sociological hypotheses, such as the importance of a specific meal in a certain geographical region Fried et al. (2014). Somewhat closer to the present work, Jurafsky (2014) finds an interesting correlation between the price range of a restaurant and the lengths of food names on its menu.
9 Conclusion
Inspired by Labov and encouraged by recent interest in computational sociolinguistics, we developed accurate neural models to predict socio-economic status from text. While lexical information is highly predictive, it is restricted to topic. In contrast, syntactic information is almost as predictive and is a much better signal for stylistic variation.
From a methodological point of view, we can draw two conclusions from this work. First, as has been noted (Plank et al., 2016), neural networks can perform well with relatively small datasets, in this case proving competitive with the sparse models that are usually favoured in author profiling Malmasi et al. (2017); Basile et al. (2018). Second, distant supervision with proxy labels for socio-economic status yields useful insights and is validated externally via readability scores. This is encouraging for further studies in computational social science in ecologically valid and relatively labour-free settings.
Nevertheless, there are limitations of distant labelling and social media data — with issues related specifically to the language of food Askalidis and Malthouse (2016) — that we will take into account in future work. First, we wish to investigate the role of additional variables (such as age and gender). Second, we will take steps to mitigate the risk of fake reviews and validate the distant labelling with human annotation.
Acknowledgements
We would like to thank the three anonymous reviewers who helped us improve the quality of this paper. The first author’s contribution was made while at the Universities of Malta and Groningen as part of the Erasmus Mundus M.Sc. Program in Human Language Science and Technology.
References
- Argamon et al. (2005) Shlomo Argamon, Sushant Dhawle, Moshe Koppel, and James W Pennebaker. 2005. Lexical predictors of personality type. In Proceedings of the Joint Annual Meeting of the Interface and the Classification Societies of North America.
- Argamon et al. (2007) Shlomo Argamon, Moshe Koppel, James Pennebaker, and Jonathan Schler. 2007. Mining the Blogosphere: Age, gender and the varieties of self-expression. First Monday, 12(9).
- Askalidis and Malthouse (2016) Georgios Askalidis and Edward C. Malthouse. 2016. Understanding and overcoming biases in customer reviews. CoRR, abs/1604.00417.
- Basile et al. (2017) Angelo Basile, Tommaso Caselli, and Malvina Nissim. 2017. Predicting Controversial News Using Facebook Reactions. In Proceedings of the Fourth Italian Conference on Computational Linguistics CLiC-it.
- Basile et al. (2018) Angelo Basile, Gareth Dwyer, Maria Medvedeva, Josine Rawee, Hessel Haagsma, and Malvina Nissim. 2018. Simply the Best: Minimalist System Trumps Complex Models in Author Profiling. In International Conference of the Cross-Language Evaluation Forum for European Languages, pages 143–156. Springer.
- Bernstein (1960) Basil Bernstein. 1960. Language and Social Class. Journal of Sociology, 11(3):271–276.
- Biber (1988) Douglas Biber. 1988. Variation Across Speech and Writing. Cambridge University Press, Cambridge.
- Bourdieu (2013) Pierre Bourdieu. 2013. Distinction: A social critique of the judgement of taste. Routledge.
- Cioffi-Revilla (2016) Claudio Cioffi-Revilla. 2016. Computational social science. Proceedings of the National Academy of Sciences of the United States of America, 113(3):468–470.
- Davenport and DeLine (2014) James RA Davenport and Robert DeLine. 2014. The readability of tweets and their geographic correlation with education. arXiv preprint arXiv:1401.6058.
- Eckert and Rickford (2001) Penelope Eckert and John R Rickford. 2001. Style and sociolinguistic variation. Cambridge University Press.
- Eisenstein (2013) Jacob Eisenstein. 2013. Phonological factors in social media writing. In Proceedings of the NAACL-HLT 2013 Workshop on Language Analysis in Social Media, Atlanta, Georgia. Association for Computational Linguistics.
- Fang and Cohn (2016) Meng Fang and Trevor Cohn. 2016. Learning when to trust distant supervision: An application to low-resource POS tagging using cross-lingual projection. In Proceedings of The 20th SIGNLL Conference on Computational Natural Language Learning, pages 178–186.
- Flekova et al. (2016) Lucie Flekova, Daniel Preoţiuc-Pietro, and Lyle Ungar. 2016. Exploring stylistic variation with age and income on twitter. In Proceedings of the 54th Annual Meeting of the Association for Computational Linguistics (Volume 2: Short Papers), volume 2, pages 313–319.
- Flesch (1943) Rudolf Flesch. 1943. Marks of Readable Style. Columbia University, New York.
- Fried et al. (2014) Daniel Fried, Mihai Surdeanu, Stephen Kobourov, Melanie Hingle, and Dane Bell. 2014. Analyzing the language of food on social media. In 2014 IEEE International Conference on Big Data (Big Data), pages 778–783. IEEE.
- van der Goot et al. (2018) Rob van der Goot, Nikola Ljubešić, Ian Matroos, Malvina Nissim, and Barbara Plank. 2018. Bleaching text: Abstract features for cross-lingual gender prediction. In Meeting of the Association for Computational Linguistics. Association for Computational Linguistics.
- Han et al. (2014) Bo Han, Paul Cook, and Timothy Baldwin. 2014. Text-based twitter user geolocation prediction. Journal of Artificial Intelligence Research, 49:451–500.
- Herdağdelen (2013) Amaç Herdağdelen. 2013. Twitter N-Gram Corpus With Demographic Metadata. Language resources and evaluation, 47(4):1127–1147.
- Honnibal and Johnson (2015) Matthew Honnibal and Mark Johnson. 2015. An Improved Non-monotonic Transition System for Dependency Parsing. In Proceedings of the 2015 Conference on Empirical Methods in Natural Language Processing, pages 1373–1378, Lisbon, Portugal. Association for Computational Linguistics.
- Hovy et al. (2015) Dirk Hovy, Anders Johannsen, and Anders Søgaard. 2015. User review sites as a resource for large-scale sociolinguistic studies. In Proceedings of the 24th International Conference on World Wide Web, pages 452–461. International World Wide Web Conferences Steering Committee.
- Hovy and Søgaard (2015) Dirk Hovy and Anders Søgaard. 2015. Tagging Performance Correlates with Author Age. In Proceedings of the 53rd Annual Meeting of the Association for Computational Linguistics and the 7th International Joint Conference on Natural Language Processing (ACL’15), pages 483–488.
- Johannsen et al. (2015) Anders Johannsen, Dirk Hovy, and Anders Søgaard. 2015. Cross-lingual syntactic variation over age and gender. In Proceedings of the Nineteenth Conference on Computational Natural Language Learning, pages 103–112.
- Jurafsky (2014) Dan Jurafsky. 2014. The language of food: A linguist reads the menu. WW Norton & Company.
- Kingma and Ba (2015) Diederik P Kingma and Jimmy Ba. 2015. Adam: A method for stochastic optimization. In ICLR.
- Klinger (2017) Roman Klinger. 2017. Does optical character recognition and caption generation improve emotion detection in microblog posts? In Proceedings of Natural Language Processing and Information Systems 2017 (NLDB’17), pages 313–319.
- Labov (1966) William Labov. 1966. The social stratification of English in New York city. ERIC, Washington DC: Center for Applied Linguistics.
- Labov (1972) William Labov. 1972. Language in the Inner City: Studies in the Black English Vernacular. University of Pennsylvania Press.
- Labov (2006) William Labov. 2006. The social stratification of English in New York city. Cambridge University Press.
- Lampos et al. (2016) Vasileios Lampos, Nikolaos Aletras, Jens K Geyti, Bin Zou, and Ingemar J Cox. 2016. Inferring the socioeconomic status of social media users based on behaviour and language. In European Conference on Information Retrieval, pages 689–695. Springer.
- LeCun et al. (1995) Yann LeCun, Yoshua Bengio, et al. 1995. Convolutional networks for images, speech, and time series. The handbook of brain theory and neural networks, 3361(10):1995.
- Lui and Baldwin (2012) Marco Lui and Timothy Baldwin. 2012. Langid.Py: An Off-the-shelf Language Identification Tool. In Proceedings of the ACL 2012 System Demonstrations, ACL ’12, pages 25–30. Association for Computational Linguistics.
- Malmasi et al. (2017) Shervin Malmasi, Keelan Evanini, Aoife Cahill, Joel Tetreault, Robert Pugh, Christopher Hamill, Diane Napolitano, and Yao Qian. 2017. A report on the 2017 native language identification shared task. In Proceedings of the 12th Workshop on Innovative Use of NLP for Building Educational Applications, pages 62–75.
- Newman et al. (2008) Matthew L. Newman, Carla J. Groom, Lori D. Handelman, and James W. Pennebaker. 2008. Gender Differences in Language Use: An Analysis of 14,000 Text Samples. Discourse Processes, 45(3):211–236.
- Ng (2004) Andrew Y Ng. 2004. Feature selection, L 1 vs. L 2 regularization, and rotational invariance. In Proceedings of the twenty-first international conference on Machine learning, page 78. ACM.
- Nguyen et al. (2016) Dong Nguyen, A. Seza Dogruöz, Carolyn Penstein Rosé, and Franciska de Jong. 2016. Computational sociolinguistics: A survey. Computational Linguistics, 42:537–593.
- Pavalanathan and Eisenstein (2015) Umashanthi Pavalanathan and Jacob Eisenstein. 2015. Audience-Modulated Variation in Online Social Media. American Speech, 90(2):187–213.
- Pedregosa et al. (2011) Fabian Pedregosa, Gaël Varoquaux, Alexandre Gramfort, Vincent Michel, Bertrand Thirion, Olivier Grisel, Mathieu Blondel, Peter Prettenhofer, Ron Weiss, Vincent Dubourg, et al. 2011. Scikit-learn: Machine learning in python. Journal of machine learning research, 12(Oct):2825–2830.
- Petrov et al. (2012) Slav Petrov, Dipanjan Das, and Ryan McDonald. 2012. A Universal Part-of-Speech Tagset. In Proceedings of the Eighth International Conference on Language Resources and Evaluation (LREC-2012).
- Plank et al. (2014) Barbara Plank, Dirk Hovy, Ryan McDonald, and Anders Søgaard. 2014. Adapting taggers to Twitter with not-so-distant supervision. In Proceedings of COLING 2014, the 25th International Conference on Computational Linguistics: Technical Papers, pages 1783–1792.
- Plank et al. (2016) Barbara Plank, Anders Søgaard, and Yoav Goldberg. 2016. Multilingual part-of-speech tagging with bidirectional long short-term memory models and auxiliary loss. In Proceedings of the 54th Annual Meeting of the Association for Computational Linguistics (Volume 2: Short Papers), volume 2, pages 412–418.
- Pool and Nissim (2016) Chris Pool and Malvina Nissim. 2016. Distant supervision for emotion detection using facebook reactions. In PEOPLES@COLING.
- Rangel et al. (2016) Francisco Rangel, Paolo Rosso, Ben Verhoeven, Walter Daelemans, Martin Potthast, and Benno Stein. 2016. Overview of the 4th author profiling task at PAN 2016: cross-genre evaluations. In Working Notes Papers of the CLEF 2016 Evaluation Labs. CEUR Workshop Proceedings/Balog, Krisztian [edit.]; et al., pages 750–784.
- Rangel Pardo et al. (2015) Francisco Manuel Rangel Pardo, Fabio Celli, Paolo Rosso, Martin Potthast, Benno Stein, and Walter Daelemans. 2015. Overview of the 3rd Author Profiling Task at PAN 2015. In CLEF 2015 Evaluation Labs and Workshop Working Notes Papers, pages 1–8.
- Read (2005) Jonathon Read. 2005. Using Emoticons to Reduce Dependency in Machine Learning Techniques for Sentiment Classification. In Proceedings of the ACL Student Research Workshop, ACLstudent ’05, pages 43–48. Association for Computational Linguistics.
- Reimers and Gurevych (2017) Nils Reimers and Iryna Gurevych. 2017. Reporting Score Distributions Makes a Difference: Performance Study of LSTM-networks for Sequence Tagging. In Proceedings of the 2017 Conference on Empirical Methods in Natural Language Processing, pages 338–348.
- Sarawgi et al. (2011) Ruchita Sarawgi, Kailash Gajulapalli, and Yejin Choi. 2011. Gender attribution: tracing stylometric evidence beyond topic and genre. In Proceedings of the Fifteenth Conference on Computational Natural Language Learning, pages 78–86. Association for Computational Linguistics.
- Schwartz et al. (2013) H Andrew Schwartz, Johannes C Eichstaedt, Margaret L Kern, Lukasz Dziurzynski, Stephanie M Ramones, Megha Agrawal, Achal Shah, Michal Kosinski, David Stillwell, Martin EP Seligman, et al. 2013. Personality, gender, and age in the language of social media: The open-vocabulary approach. PloS one, 8(9):e73791.
- Srivastava et al. (2014) Nitish Srivastava, Geoffrey Hinton, Alex Krizhevsky, Ilya Sutskever, and Ruslan Salakhutdinov. 2014. Dropout: A simple way to prevent neural networks from overfitting. Journal of Machine Learning Research, 15:1929–1958.
- Verhoeven et al. (2016) Ben Verhoeven, Walter Daelemans, and Barbara Plank. 2016. Twisty: a multilingual twitter stylometry corpus for gender and personality profiling. In Proceedings of the 10th Annual Conference on Language Resources and Evaluation (LREC 2016)/Calzolari, Nicoletta [edit.]; et al., pages 1–6.
- Yang et al. (2016) Zichao Yang, Diyi Yang, Chris Dyer, Xiaodong He, Alex Smola, and Eduard Hovy. 2016. Hierarchical attention networks for document classification. In Proceedings of the 2016 Conference of the North American Chapter of the Association for Computational Linguistics: Human Language Technologies, pages 1480–1489.
- Youyou et al. (2015) Wu Youyou, Michal Kosinski, and David Stillwell. 2015. Computer-based personality judgments are more accurate than those made by humans. Proceedings of the National Academy of Sciences, 112(4):1036–1040.
- Zampieri et al. (2014) Marcos Zampieri, Liling Tan, Nikola Ljubešić, and Jörg Tiedemann. 2014. A report on the DSL shared task 2014. In Proceedings of the first workshop on applying NLP tools to similar languages, varieties and dialects, pages 58–67.
Appendix: Additional results
| model | class | precision | recall | f1-score |
|---|---|---|---|---|
| lexical | $ | 0.53 | 0.68 | 0.59 |
| $$ | 0.37 | 0.25 | 0.30 | |
| $$$ | 0.67 | 0.50 | 0.57 | |
| $$$$ | 0.58 | 0.75 | 0.66 | |
| avg/total | 0.54 | 0.54 | 0.53 | |
| abstract | $ | 0.61 | 0.71 | 0.66 |
| $$ | 0.50 | 0.32 | 0.39 | |
| $$$ | 0.39 | 0.32 | 0.35 | |
| $$$$ | 0.42 | 0.57 | 0.48 | |
| avg/total | 0.48 | 0.48 | 0.47 | |
| POS-tags | $ | 0.27 | 0.43 | 0.33 |
| $$ | 0.15 | 0.07 | 0.10 | |
| $$$ | 0.29 | 0.14 | 0.19 | |
| $$$$ | 0.40 | 0.57 | 0.47 | |
| avg/total | 0.28 | 0.30 | 0.27 | |
| dependency triplets | $ | 0.43 | 0.36 | 0.39 |
| $$ | 0.23 | 0.21 | 0.22 | |
| $$$ | 0.21 | 0.25 | 0.23 | |
| $$$$ | 0.37 | 0.39 | 0.38 | |
| avg/total | 0.31 | 0.30 | 0.31 |