The MOSDEF Survey: Sulfur Emission-line Ratios Provide New Insights into Evolving ISM Conditions at High Redshift11affiliation: Based on data obtained at the W.M. Keck Observatory, which is operated as a scientific partnership among the California Institute of Technology, the University of California, and the National Aeronautics and Space Administration, and was made possible by the generous financial support of the W.M. Keck Foundation.
Abstract
We present results on the emission-line properties of galaxies drawn from the complete MOSFIRE Deep Evolution Field (MOSDEF) survey. Specifically, we use observations of the emission-line diagnostic diagram of [OIII]/H vs. [SII]/H, i.e., the “[SII] BPT diagram,” to gain insight into the physical properties of high-redshift star-forming regions. High-redshift MOSDEF galaxies are offset towards lower [SII]/H at fixed [OIII]/H, relative to local galaxies from the Sloan Digital Sky Survey (SDSS). Furthermore, at fixed [OIII]/H, local SDSS galaxies follow a trend of decreasing [SII]/H as the surface density of star formation () increases. We explain this trend in terms of the decreasing fractional contribution from diffuse ionized gas () as increases in galaxies, which causes galaxy-integrated line ratios to shift towards the locus of pure H II-region emission. The relationship between and implies that high-redshift galaxies have lower values than typical local systems, given their significantly higher typical . When an appropriate low-redshift benchmark with zero or minimal is used, high-redshift MOSDEF galaxies appear offset towards higher [SII]/H and/or [OIII]/H. The joint shifts of high-redshift galaxies in the [SII] and [NII] BPT diagrams are best explained in terms of the harder spectra ionizing their star-forming regions at fixed nebular oxygen abundance (expected for chemically-young galaxies), as opposed to large variations in N/O ratios or higher ionization parameters. The evolving mixture of H II regions and DIG is an essential ingredient to our description of the ISM over cosmic time.
Subject headings:
galaxies: evolution — galaxies: high-redshift — galaxies: ISM1. Introduction
Rest-optical emission line ratios provide a powerful probe of the physical conditions in the interstellar medium (ISM). Local star-forming galaxies trace a tight sequence of increasing [NII]/H and decreasing [OIII]/H, as metallicity increases and the overall excitation in star-forming regions decreases. Recent statistical samples of rest-optical spectra of galaxies show that high-redshift galaxies are offset systematically from local galaxies towards higher [OIII]/H and [NII]/H values on average (Steidel et al. 2014; Shapley et al. 2015). There are many possible causes for this observed difference in galaxies, including higher ionization parameters in distant H II regions, harder ionizing spectra at fixed metallicity for the stars photo-ionizing the H II regions, higher densities (or equivalently pressures), variations in the gas-phase N/O abundance patterns, and contributions from active galactic nuclei (AGNs) and shocks (e.g., Kashino et al. 2017; Steidel et al. 2016; Sanders et al. 2016; Masters et al. 2014; Coil et al. 2015; Freeman et al. 2019).
The differences between high-redshift and local emission-line sequences were first noted in the [OIII]/H vs. [NII]/H diagnostic diagram, i.e., the so-called [NII] BPT diagram (Baldwin et al. 1981). However, in interpreting these differences, various authors have considered the properties of galaxies in the [OIII]/H vs. [SII]/H diagram (first introduced in Veilleux & Osterbrock (1987), and referred to hereafter as the “[SII] BPT diagram”) and the space of [OIII]4959,5007/[OII]3726,3729 () vs. ([OIII]4959,5007+[OII]3726,3729)/H (). The lack of a significant positive offset in the [SII] BPT and vs. diagrams has been used to argue that and galaxies follow different N/O abundance patterns (Masters et al. 2014; Shapley et al. 2015). A small positive offset measured in the [SII] BPT diagram has been used to suggest a harder ionizing spectrum at fixed nebular abundance (Strom et al. 2017; Steidel et al. 2016) at . Meanwhile, a negative offset in [SII]/H at fixed [OIII]/H for star-forming galaxies has been attributed to a higher ionization parameter (Kashino et al. 2017, 2019).
While arriving at different conclusions regarding the evolution of the properties of star-forming regions at high redshift, the analyses of local and high-redshift emission-line diagnostic diagrams typically share a common approach. Specifically, integrated slit or fiber spectra of distant galaxies are compared with fiber spectra of local galaxies drawn from the Sloan Digital Sky Survey (SDSS; Abazajian et al. 2009). Each galaxy is effectively represented as a point source, when in fact the integrated spectrum of a galaxy contains the sum of the emission from the ensemble of H II regions that fall within the spectral aperture, along with the contribution from diffuse ionized gas (DIG) in the ISM. DIG exists outside H II regions, and has been shown to contribute typically 30%-60% of the total H flux in local spiral galaxies (Zurita et al. 2000; Oey et al. 2007). Furthermore, the fractional contribution of DIG emission to the Balmer lines declines with increasing star-formation rate (SFR) surface density (; Oey et al. 2007). Zhang et al. (2017) and Sanders et al. (2017) have also demonstrated that distinct physical conditions and ionizing spectra in the DIG and H II regions result in systematically different DIG and H II region excitation sequences in emission-line diagrams featuring [SII] or [OII], while not strongly affecting the [NII] BPT diagram. Clearly, a robust interpretation of the evolving internal properties of H II regions with increasing redshift requires an understanding of the evolving mixture of DIG and H II regions within star-forming galaxies.
In this work, we examine how the different mixtures of DIG and H II region emission at low and high redshifts affect inferences regarding the evolution of H II region properties out to . We analyze galaxies at drawn from the MOSFIRE Deep Evolution Field (MOSDEF) survey (Kriek et al. 2015) in comparison with local SDSS galaxies. Most importantly, we consider the implications of the fact that is typically two orders of magnitude higher in star-forming galaxies at , compared with galaxies. In §2, we describe our observations and samples. In §3, we revisit the comparison between local and high-redshift emission-line diagrams, accounting for their additional differences in . In §4, we discuss the implications for inferring the internal properties of high-redshift star-forming regions. Throughout, we adopt cosmological parameters of , , and , and a Chabrier (2003) IMF.
2. Observations and Samples
2.1. MOSDEF Survey and Sample
Our analysis is based on the complete MOSDEF survey data set. Full details of the survey observations and data reduction are provided in Kriek et al. (2015). In brief, MOSDEF was a 48.5-night observing program over 4 years using the Multi-Object Spectrometer for Infra-Red Exploration (MOSFIRE; McLean et al. 2012) on the 10 m Keck I telescope. With MOSDEF, we obtained rest-optical spectra for a sample of galaxies at in the COSMOS, GOODS-N, AEGIS, GOODS-S, and UDS fields covered by the CANDELS and 3D-HST surveys (Grogin et al. 2011; Koekemoer et al. 2011; Momcheva et al. 2016). These fields are covered by extensive multi-wavelength observations (e.g., Skelton et al. 2014). MOSDEF targets fall within three distinct redshift intervals, where the strongest rest-optical emission lines are accessible through windows of atmospheric transmission: , , and . Here we focus on galaxies in the two lower-redshift intervals, hereafter described as and , for which not only [OII], H, [OIII] are accessible from the ground, but also H, [NII], and [SII].
In addition to measurements of strong rest-optical nebular emission lines for MOSDEF galaxies, we also analyze dust-corrected H star-formation surface densities, i.e., . To obtain , we determined nebular extinction, , from the stellar-absorption-corrected H/H Balmer decrement and the assumption of the Milky Way dust extinction curve (Cardelli et al. 1989). H SFRs (SFR(H)) were then estimated from dust-corrected and slit-loss-corrected H luminosities, based on the calibration of Hao et al. (2011) for a Chabrier (2003) IMF. The procedures for stellar-absorption, dust, and slit-loss corrections are fully described in Reddy et al. (2015) and Kriek et al. (2015). We also require galaxy sizes for . van der Wel et al. (2014) fit single-component Sérsic profiles to the two-dimensional light distributions of galaxies in the CANDELS fields, and derive half-light radii, , as the semi-major axis of the ellipse containing half of the total galaxy light. We use F160W galaxy half-light radii from the publicly-available catalogs of van der Wel et al., and then define SFR surface density as:
| (1) |
Our main analysis is based on samples of MOSDEF galaxies at and with coverage of the H, [OIII], H, [NII], and [SII] emission lines. Specifically, we selected 434 [211] galaxies at [], with robust spectroscopic redshifts, S/N in H emission-line flux, and no evidence for AGN activity based on X-ray luminosity, Spitzer/IRAC colors, or [NII]/H ratios (Coil et al. 2015; Azadi et al. 2017). The sample is characterized by a median redshift and stellar mass of and , respectively, while the corresponding values for the sample are and .
2.2. SDSS Comparison Sample
In order to gain insights into the evolving properties of star-forming regions at high redshift, we selected a comparison sample of local galaxies from the Sloan Digital Sky Survey (SDSS) Data release 7 (DR7; Abazajian et al. 2009). Stellar-absorption-corrected emission-line measurements are drawn from the MPA-JHU catalog of measurements for DR7111Available at http://www.mpa-garching.mpg.de/SDSS/DR7/, as well as the corrections needed to correct fiber to total emission-line fluxes. In order to estimate for SDSS galaxies, we calculated , dust-corrected H luminosities, and SFR(H) for SDSS galaxies using the methodology described above. In analogy with the rest-optical half-light radii adopted for MOSDEF galaxies, we used the elliptical Petrosian -band half-light radii for SDSS galaxies drawn from the NASA-Sloan Atlas v1.0.1222Available at http://www.nsatlas.org., and applied equation 1 to obtain . We restricted the SDSS sample to galaxies at to reduce aperture effects, and required 5 detections for all lines included in the [SII] and [NII] BPT diagrams (i.e., H, [OIII], H, [NII], and [SII]). As we wish to study the star-formation properties of the SDSS sample, we also removed galaxies from our analysis that satisfied the optical emission-line AGN criterion of Kauffmann et al. (2003). We finally required a robust half-light radius entry in the NASA-Sloan Atlas. The above criteria yielded a comparison sample of 60,609 SDSS galaxies with .
3. Emission-Line Ratios at Low and High Redshift
3.1. MOSDEF Emission-Line Diagrams
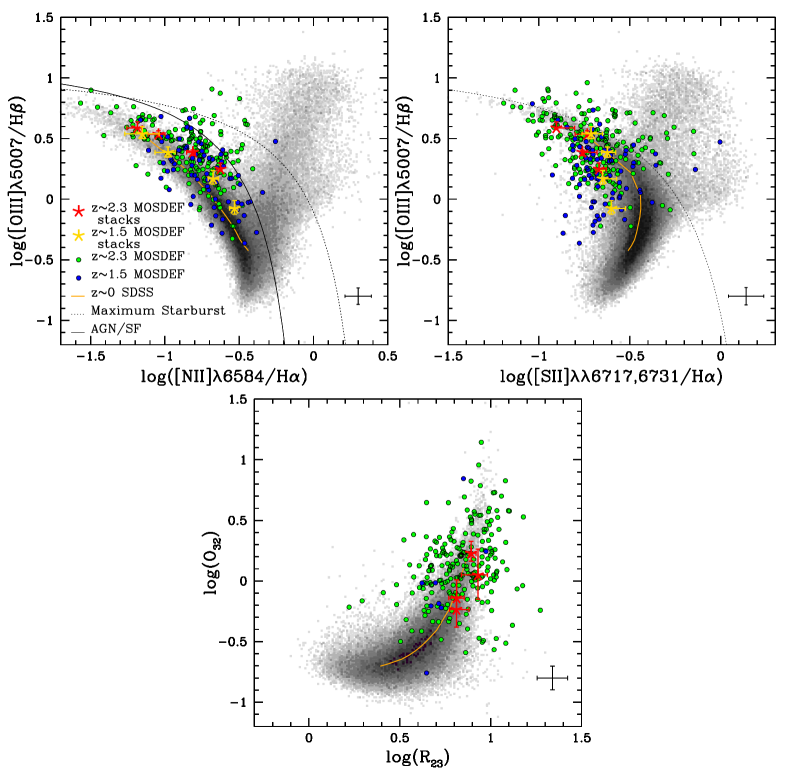
We present here a significantly expanded sample of rest-optical emission-line ratio measurements compared to our previous work (Shapley et al. 2015; Sanders et al. 2016), now based on the completed MOSDEF survey. In addition, for the first time we present the same set of measurements for the MOSDEF sample. Figure 1 shows MOSDEF galaxies in the [NII] and [SII] BPT diagrams, as well as vs. . Of the galaxies in the [NII] and [SII] BPT samples with coverage of all BPT features and detections of H emission, there are 179 [68] objects with all [NII] BPT features individually detected at significance at []. The [] sample size with all features detected in the [SII] BPT diagram is 201 [79]. For the vs. diagram the number of galaxies with [OII], H, [OIII], and H detected is 224 [8] at []. In each of the 3 panels of Figure 1, we show not only the subset of individual detections, but measurements from median stacked spectra from the full sample of MOSDEF galaxies in bins of stellar mass, constructed as described in Sanders et al. (2018).
Based on the full MOSDEF sample, we recover the well-known offset for galaxies in the [NII] BPT diagram, towards higher [NII]/H and [OIII]/H relative to the sequence of star-forming galaxies. In detail, the MOSDEF sample appears to be slightly more offset than the sample. In the [SII] BPT diagram, the spectral stacks reveal the average trend for MOSDEF galaxies is offset from the local sequence towards lower [SII]/H at fixed [OIII]/H, consistent with the results of Kashino et al. (2017, 2019). In the vs. diagram, we highlight the results from , since the sample contains few objects with coverage of [OII]. Spectral stacks show that the sequence is slightly offset towards higher at fixed , relative to the local sequence. In the discussion that follows, we focus on the [SII] BPT diagram in more detail.
3.2. and the [SII] BPT Diagram
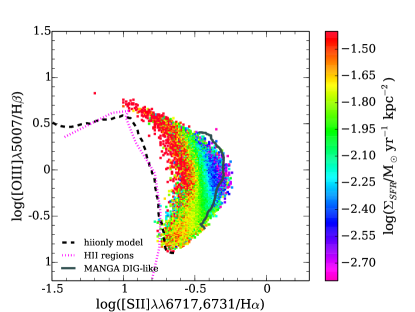
In order to understand the emission-line properties of high-redshift galaxies, we turn to the local [SII] BPT diagram, considering the connection between the location in this diagram and . As previously featured in Masters et al. (2016), Figure 2 shows a clear trend towards lower [SII]/H at fixed [OIII]/H as increases. We now explain this trend based on the result from Oey et al. (2007), according to which the fraction of the Balmer flux contributed by DIG, , is a decreasing function of the dust-corrected H surface brightness – or, equivalently, . Recasting the fit from Sanders et al. (2017) to the Oey et al. data in terms of , we find:
| (2) |
Accordingly, galaxies with higher have lower . In addition to showing the [OIII]/H vs. [SII]/H locus for SDSS galaxies, Figure 2 also features the corresponding median sequence for local H II regions drawn from the sample of Pilyugin & Grebel (2016), and that traced out by the hiionly model from Sanders et al. (2017). The hiionly model represents the ensemble average emission from H II regions in star-forming galaxies, and does not include DIG emission. Figure 2 also shows the median sequence for DIG-dominated spaxels from galaxies in the SDSS MaNGA survey (Zhang et al. 2017). The H II region sequences are offset towards significantly lower [SII]/H at fixed [OIII]/H, relative to SDSS galaxies, while the DIG-dominated spaxels are shifted towards higher [SII]/H. It is worth noting that the same segregation between H II region, SDSS galaxy, and DIG emission sequences is not apparent in the [NII] BPT diagram (Zhang et al. 2017; Sanders et al. 2017). It is clear that, as increases and decreases, the [OIII]/H vs. [SII]/H locus of SDSS galaxies shifts towards the H II region sequence (or, equivalently, the hiionly model, which excludes the contribution of DIG emission).
3.3. at Low and High Redshift
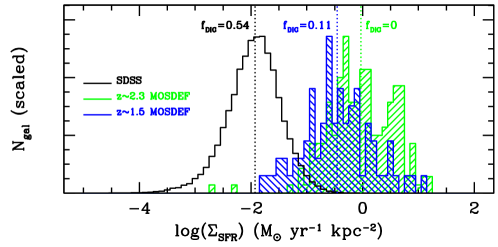
At , star-forming galaxies of the same stellar mass have significantly higher SFRs and smaller radii. The combination of these factors results in dramatically different median values of for the MOSDEF samples presented here, compared with the properties of SDSS galaxies. In Figure 3, we show the distribution of for our SDSS comparison sample (black histogram), as well as the corresponding distributions for the and MOSDEF samples (green and blue shaded histograms, respectively). The median values at , 1.5 and 2.3 are , , and , where is in units of . Therefore, the difference in typical at and is almost two orders of magnitude. We have also used equation 2 to estimate the corresponding value for each median , finding median values of 0.54, 0.11, and 0, for at , 1.5, and 2.3. For these calculations, we are making the simplifying assumption that the same relation between and holds at low and high redshift, although it has only been measured locally. If this assumption is valid, then the emission from the ionized ISM at should be well represented by the ensemble-averaged emission of H II regions, with minimal (or zero, in the case of ) contribution from DIG. This difference in the relative contributions of H II regions and DIG must be accounted for when interpreting the [SII] BPT diagram of high-redshift galaxies.
3.4. Revisiting the High-Redshift [SII] BPT Diagram
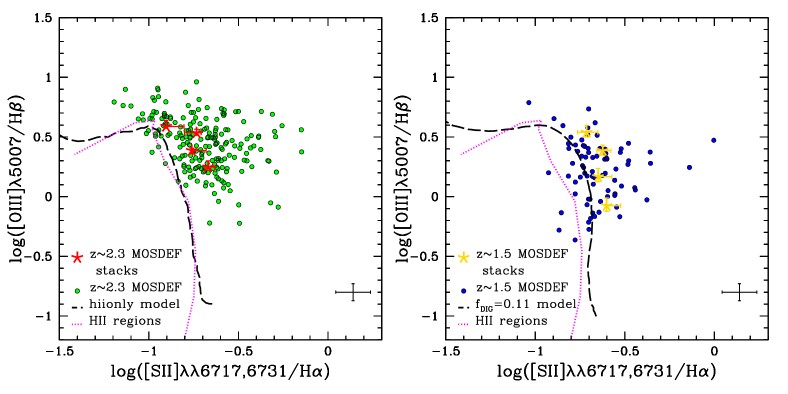
In order to infer the differences between low and high-redshift star-forming regions, we need to consider low- and high-redshift samples with the same . For MOSDEF galaxies, the appropriate comparison sample is either local H II regions, or the hiionly model of Sanders et al. (2017), with . Given the slightly lower and higher inferred for the MOSDEF sample, we generated a model with for the purposes of comparison, based on the methodology of Sanders et al. (2017). Figure 4 shows the [SII] BPT diagrams for the and MOSDEF samples of individual detections, along with the appropriate comparison models. The high-redshift MOSDEF samples are clearly shifted towards higher [SII]/H and [OIII]/H relative to the low-DIG comparison models, with a larger positive shift for the sample.
4. Discussion
Previous comparisons between high-redshift and local SDSS galaxies in the [SII] BPT diagram suggested that there was zero or negative shift in [SII]/H at fixed [OIII]/H. Such results led Shapley et al. (2015) to conclude that differences existed between low- and high-redshift N/O vs. O/H abundance patterns, and Kashino et al. (2017) to infer higher ionization parameters at fixed nebular abundance. However, such analyses did not use the appropriate comparison sample with minimal . Our revised comparison in the [SII] BPT diagram between high-redshift galaxies and local H II regions, or galaxies with minimal DIG contribution, demonstrates definitively that galaxies have significant positive x- and/or y-offsets relative to their appropriate local counterparts in both the [NII] and [SII] BPT diagrams. Sanders et al. (2016) showed that, compared to a fiducial set of photoionization models, those with harder ionizing spectrum at fixed metallicity lead to corresponding positive offsets in both [NII] and [SII] BPT diagrams. Steidel et al. (2016) proposed an underlying physical scenario for such behavior, according to which chemically-young high-redshift galaxies exhibit enhancement, with stellar Fe-based metallicities a factor of several lower than nebular oxygen-based metallicities. Our analysis shows that the [NII] and [SII] BPT diagrams of high-redshift galaxies can be jointly explained by the combination of a harder ionizing spectrum at fixed metallicity due to enhancement, and a lower , compared with local star-forming galaxies.
The evolving mixture of DIG and H II region emission has implications for both photoionization models and strong-line metallicity calibrations. For example, the photoionization models of Levesque et al. (2010) and Hirschmann et al. (2017) neglect a detailed treatment of the DIG contribution to integrated galaxy line ratios, and neither set of model grids overlaps the bulk of galaxies that they aim to describe in the [SII] BPT diagram. In both cases, the model grids fall much closer to the locus of H II regions, and clearly require the addition of DIG emission to correctly describe local galaxies (Sanders et al. 2017). As for metallicity calibrations, the recently-introduced “N2S2” indicator relates metallicity to a linear combination of and (Dopita et al. 2016). However, because it includes [SII], N2S2 is sensitive to both metallicity and . Robust evolutionary comparisons between the integrated oxygen abundances of high- and low-redshift galaxies must be made using empirical indicators that are insensitive to variations in .
Our conclusions are based on the assumption that high-redshift galaxies follow the same relationship between and that is observed in local galaxies (Oey et al. 2007). We now need to test our assumption of redshift invariance by constructing rest-optical emission-line maps of distant galaxies on sub-kpc scales, and measuring both and . Such observations will be possible with the integral-field unit (IFU) of the NIRSpec instrument aboard the James Webb Space Telescope and planned adaptive-optics-assisted IFUs on the next generation of extremely large ground-based telescopes.
Acknowledgements
We acknowledge support from NSF AAG grants AST-1312780, 1312547, 1312764, and 1313171, grant AR-13907 from the Space Telescope Science Institute, and grant NNX16AF54G from the NASA ADAP program. We also acknowledge a NASA contract supporting the “WFIRST Extragalactic Potential Observations (EXPO) Science Investigation Team” (15-WFIRST15-0004), administered by GSFC. We thank the 3D-HST collaboration, who provided us with spectroscopic and photometric catalogs used to select MOSDEF targets and derive stellar population parameters. We acknowledge the First Carnegie Symposium in Honor of Leonard Searle for useful information and discussions that benefited this work. We finally wish to extend special thanks to those of Hawaiian ancestry on whose sacred mountain we are privileged to be guests.
References
- Abazajian et al. (2009) Abazajian, K. N., Adelman-McCarthy, J. K., Agüeros, M. A., et al. 2009, ApJS, 182, 543
- Azadi et al. (2017) Azadi, M., Coil, A. L., Aird, J., et al. 2017, ApJ, 835, 27
- Baldwin et al. (1981) Baldwin, J. A., Phillips, M. M., & Terlevich, R. 1981, PASP, 93, 5
- Cardelli et al. (1989) Cardelli, J. A., Clayton, G. C., & Mathis, J. S. 1989, ApJ, 345, 245
- Chabrier (2003) Chabrier, G. 2003, PASP, 115, 763
- Coil et al. (2015) Coil, A. L., Aird, J., Reddy, N., et al. 2015, ApJ, 801, 35
- Dopita et al. (2016) Dopita, M. A., Kewley, L. J., Sutherland, R. S., & Nicholls, D. C. 2016, Ap&SS, 361, 61
- Freeman et al. (2019) Freeman, W. R., Siana, B., Kriek, M., et al. 2019, ApJ, 873, 102
- Grogin et al. (2011) Grogin, N. A., Kocevski, D. D., Faber, S. M., et al. 2011, ApJS, 197, 35
- Hao et al. (2011) Hao, C.-N., Kennicutt, R. C., Johnson, B. D., et al. 2011, ApJ, 741, 124
- Hirschmann et al. (2017) Hirschmann, M., Charlot, S., Feltre, A., et al. 2017, MNRAS, 472, 2468
- Kashino et al. (2017) Kashino, D., Silverman, J. D., Sanders, D., et al. 2017, ApJ, 835, 88
- Kashino et al. (2019) —. 2019, ApJS, 241, 10
- Kauffmann et al. (2003) Kauffmann, G., Heckman, T. M., Tremonti, C., et al. 2003, MNRAS, 346, 1055
- Kewley et al. (2001) Kewley, L. J., Dopita, M. A., Sutherland, R. S., Heisler, C. A., & Trevena, J. 2001, ApJ, 556, 121
- Koekemoer et al. (2011) Koekemoer, A. M., Faber, S. M., Ferguson, H. C., et al. 2011, ApJS, 197, 36
- Kriek et al. (2015) Kriek, M., Shapley, A. E., Reddy, N. A., et al. 2015, ApJS, 218, 15
- Levesque et al. (2010) Levesque, E. M., Kewley, L. J., & Larson, K. L. 2010, AJ, 139, 712
- Masters et al. (2016) Masters, D., Faisst, A., & Capak, P. 2016, ApJ, 828, 18
- Masters et al. (2014) Masters, D., McCarthy, P., Siana, B., et al. 2014, ApJ, 785, 153
- McLean et al. (2012) McLean, I. S., Steidel, C. C., Epps, H. W., et al. 2012, in Society of Photo-Optical Instrumentation Engineers (SPIE) Conference Series, Vol. 8446, Ground-based and Airborne Instrumentation for Astronomy IV, 84460J
- Momcheva et al. (2016) Momcheva, I. G., Brammer, G. B., van Dokkum, P. G., et al. 2016, ApJS, 225, 27
- Oey et al. (2007) Oey, M. S., Meurer, G. R., Yelda, S., et al. 2007, ApJ, 661, 801
- Pettini & Pagel (2004) Pettini, M., & Pagel, B. E. J. 2004, MNRAS, 348, L59
- Pilyugin & Grebel (2016) Pilyugin, L. S., & Grebel, E. K. 2016, MNRAS, 457, 3678
- Reddy et al. (2015) Reddy, N. A., Kriek, M., Shapley, A. E., et al. 2015, ApJ, 806, 259
- Sanders et al. (2017) Sanders, R. L., Shapley, A. E., Zhang, K., & Yan, R. 2017, ApJ, 850, 136
- Sanders et al. (2016) Sanders, R. L., Shapley, A. E., Kriek, M., et al. 2016, ApJ, 816, 23
- Sanders et al. (2018) —. 2018, ApJ, 858, 99
- Shapley et al. (2015) Shapley, A. E., Reddy, N. A., Kriek, M., et al. 2015, ApJ, 801, 88
- Skelton et al. (2014) Skelton, R. E., Whitaker, K. E., Momcheva, I. G., et al. 2014, ApJS, 214, 24
- Steidel et al. (2016) Steidel, C. C., Strom, A. L., Pettini, M., et al. 2016, ApJ, 826, 159
- Steidel et al. (2014) Steidel, C. C., Rudie, G. C., Strom, A. L., et al. 2014, ApJ, 795, 165
- Strom et al. (2017) Strom, A. L., Steidel, C. C., Rudie, G. C., et al. 2017, ApJ, 836, 164
- van der Wel et al. (2014) van der Wel, A., Franx, M., van Dokkum, P. G., et al. 2014, ApJ, 788, 28
- Veilleux & Osterbrock (1987) Veilleux, S., & Osterbrock, D. E. 1987, ApJS, 63, 295
- Zhang et al. (2017) Zhang, K., Yan, R., Bundy, K., et al. 2017, MNRAS, 466, 3217
- Zurita et al. (2000) Zurita, A., Rozas, M., & Beckman, J. E. 2000, A&A, 363, 9