Downward Terrestrial Gamma-ray Flash observed in Winter Thunderstorm
Abstract
During a winter thunderstorm on 2017 November 24, a strong burst of gamma rays with energies up to 10 MeV was detected coincident with a lightning discharge, by scintillation detectors installed at Kashiwazaki-Kariwa Nuclear Power Station at sea level in Japan. The burst had a sub-second duration, which is suggestive of photoneutron productions. The leading part of the burst was resolved into four intense gamma-ray bunches, each coincident with a low-frequency radio pulse. These bunches were separated by 0.7–1.5 ms, with a duration of 1 ms each. Thus, the present burst may be considered as a “downward” terrestrial gamma-ray flash (TGF), which is analogous to up-going TGFs observed from space. Although the scintillation detectors were heavily saturated by these bunches, the total dose associated with them was successfully measured by ionization chambers, employed by nine monitoring posts surrounding the power plant. From this information and Monte Carlo simulations, the present downward TGF is suggested to have taken place at an altitude of 2500 500 m, involving avalanche electrons with energies above 1 MeV. This number is comparable to those in up-going TGFs.
pacs:
Valid PACS appear hereI Introduction
Terrestrial gamma-ray flashes (TGFs) are sub-millisecond gamma-ray emissions coincident with lightning discharges. Since their discovery in 1991Fishman et al. (1994), TGFs have been observed by gamma-ray astronomy satellitesSmith et al. (2005); Marisaldi et al. (2010); Tavani et al. (2011); Briggs et al. (2010, 2011); Mailyan et al. (2016), and by aircraftsSmith et al. (2011); Bowers et al. (2018). The TGF photons, reaching 20 MeV or higherSmith et al. (2005); Tavani et al. (2011), originate from bremsstrahlung by energetic electrons. These electrons are thought to be accelerated by the relativistic runaway electron avalanche (RREA) mechanismGurevich et al. (1992); Dwyer (2004) in strong electric fields of lightning, and multiplied via such processes as the relativistic feedback processesDwyer (2012) or the leader-seeded processesCelestin and Pasko (2011); Babich et al. (2015).
Ground-level observations of naturalTran et al. (2015); Colalillo (2017); Abbasi et al. (2017, 2018) and rocket-triggeredDwyer et al. (2004); Hare et al. (2016) lightning have discovered gamma-ray flashes, similar to TGFs but beamed downward. These bursts, called downward TGFs, indeed have characteristics common with ordinary TGFs, such as coincidence with lightning, sub-millisecond duration, and photon energies of . Recently, several downward TGFs in winter thunderstorms have been found to be so intense as to cause atmospheric photonuclear reactions, such as Bowers et al. (2017); Smith et al. (2018); Enoto et al. (2017).
Since downward TGFs take place close to the ground, brighter ones with high gamma-ray fluxes can heavily saturate detectorsHare et al. (2016). In particular, those bright enough to produce observable numbers of photoneutrons completely exceeded counting capabilities of typical scintillation detectorsBowers et al. (2017); Enoto et al. (2017); Smith et al. (2018). As a result, we have not been able to estimate the gamma-ray fluence of downward TGFs that involve photonuclear reactions. Here we report on the detection, with scintillation detectors, of a downward TGF which triggered photonuclear reactions, and estimate the gamma-ray fluence using ionization chambers tolerant to high-flux radiation.
II Instruments
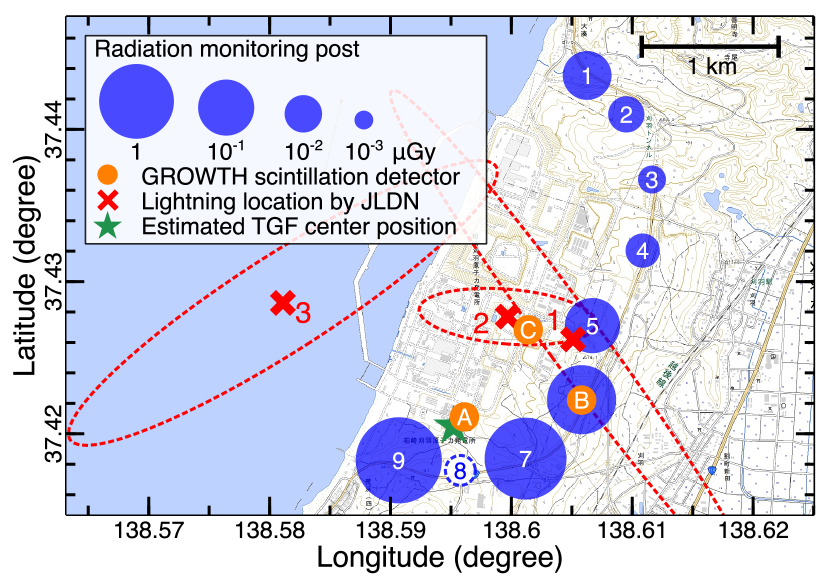
We have been performing the Gamma-Ray Observation of Winter Thunderclouds (GROWTH) experiment in coastal areas of Japan SeaTsuchiya et al. (2007, 2011, 2013); Umemoto et al. (2016); Enoto et al. (2017); Wada et al. (2018). The present observation was performed in Kashiwazaki-Kariwa Nuclear Power Station, one of the GROWTH’s sites. This site, successfully operated since December 2006, was enhanced in 2016, with three gamma-ray detectors (Detectors A–C), of which the locations are shown in Fig.1.
Detectors A, B, and C employ a (BGO) crystal scintillator of 25.08.02.5 cm3 each, and are sensitive to 0.2–18.0 MeV, 0.2–26.0 MeV, and 0.3–15.0 MeV gamma rays, respectively. Scintillation pulses from these BGO crystals are read by phototubes. Analog outputs from each phototube are processed by a charge amplifier and a shaping amplifier, with time constants of and , respectively. The amplified analog waveforms are sampled by our original data acquisition (DAQ) system with 50 MHz analog-to-digital convertorsEnoto et al. (2017); Wada et al. (2018). Once the DAQ system detects a pulse, it stores the digitized pulse waveform during a gate time, and measures its maximum and minimum values. The maximum value, corresponding to the pulse height, is converted into the deposited energy in the crystal via energy calibration. Minimum values present baseline of the analog outputs, and normally remain 0 volt. The DAQ system can count pulses up to 10 kHz properly. The absolute timing of the detectors is adjusted by global-positioning-system signals to an accuracy of .
In addition, radiation monitoring posts (MPs), operated by the power station and distributed as in Fig.1, measure dose rates every 30 seconds. Each station consists of a NaI scintillation detector (NaI), and an ionization chamber (IC), a sphere of 2-mm thick stainless steal filled with 14-L argon gas at 4 atms. These NaIs and ICs are sensitive to gamma rays of 0.05–3.0 MeV and , respectively. While NaIs are dedicated to low-dose-rate measurements up to 10 , ICs stand high rates up to .
Lightning activities are monitored by a broadband low-frequency (LF) radio receiver which we installed at Nyuzen (36.954∘N, 137.498∘E), 110 km west-southwest from the observation site. The LF receiver consists of a flat-plate antenna sensitive to the 0.8–500 kHz band. Analog outputs from the antenna are sampled by a 4 MHz digitizerTakayanagi et al. (2013). We also utilize commercial information of Japan Lightning Detection Network (JLDN), to obtain position, timing, discharge current, and classification (cloud-to-ground or in-cloud) of lightning pulses.
III Results
During a thunderstorm on 2017 November 24, we observed a lightning discharge and a radiation burst simultaneously, at 10:03:02.282827 UTC, which we hereafter employ as the origin of the elapsed time. Figure 2(a)–(c) present time series of count rates obtained by Detectors A–C, respectively, and Fig. 2(d) an LF waveform which continued for . The gamma-ray burst had a steep onset () coincident with the lightning discharge, followed by an exponential decay with a time constant of 59, 47 and 48 ms for Detectors A, B, and C, respectively. As shown in Enoto et al.Enoto et al. (2017), these decay constants are consistent with those of neutron thermalization, and subsequent emission of de-excitation gamma rays through neutron captures (mainly ). In addition, Detector A detected an afterglow, lasting for and mainly consisting of 511-keV annihilation photons. This is due to positrons emitted from -decaying nuclei such as Enoto et al. (2017). Therefore, we infer that photonuclear reactions such as occured following the lightning discharge.

Figure 2(e)–(g) expand the initial phase of the gamma-ray burst, where the maximum and minimum values of the analog outputs measured every 20 s are plotted in photon-by-photon basis. During , the maximum values of several photons exceeded the saturation level of the analog amplifier (4 volts). At the same time, the minimum values went significantly negative, and gradually returned to their normal baseline level. This behavior, called “baseline undershoot”, is most clearly seen in Fig.2(e) and (g). These saturated pulses and baseline undershoots are caused when large charge pulses from the phototube are fed into the charge amplifier. As inEnoto et al. (2017), this provides clear evidence of a downward TGF, namely, large energy deposits into the BGO crystals in 1 ms.
In Fig.2(g), the saturated signals of Detector C, accompanied by the undershoots, can be recognized on four occasions, at , 1.5, 3.1, and 3.7 ms. The same effects, though less obvious, are seen by Detectors A and B. Therefore, the downward TGF is considered to consist of four gamma-ray “bunches” with a duration of 1 ms each, and each of them reached our three detectors simultaneously. The interval between adjacent bunches ranges over 0.71–1.52 ms, on average 1.22 ms.
Although these bunches must contain a large number of gamma-ray photons, our DAQ system can record only one photon event during each 20 gate time, even if multiple photons arrive in this period. Furthermore, once saturated, our charge amplifiers take 1 ms to recover from the negative undershoot (Fig.2g). The forepart of this interval becomes a dead time, in which subsequent events cannot be acquired. Thus, our detectors were not able to resolve these bunches into individual photons. Instead, we can use the saturated signals as the onset of a gamma-ray bunch. As the negative undershoot becomes volts, the detectors resume detecting the photons (mainly from the neutron capture processes), but their pulse heights can be incorrect by at least to ms.
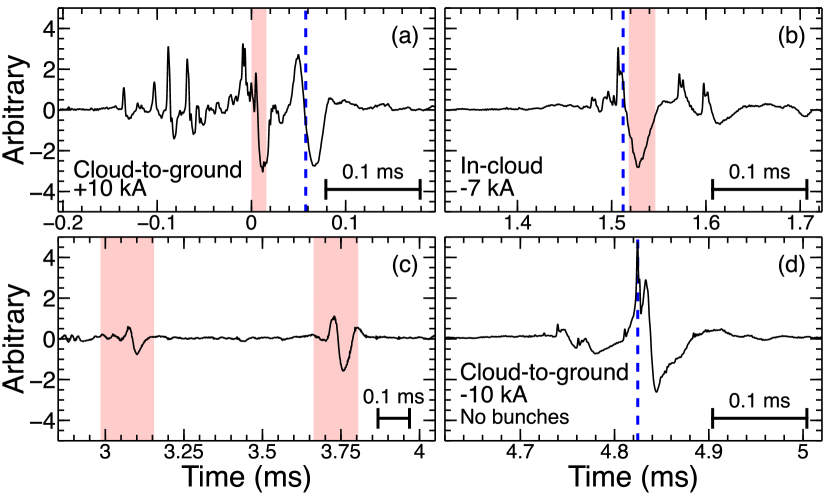
Figure 2(h) expands the LF waveform. Over , when the bunches were detected, we notice 5 to 6 LF spikes. The highest three of them are coincident with discharges reported by JLDN, a cloud-to-ground pulse of at , an in-cloud pulse ( kA, ), and a cloud-to-ground pulse ( kA, ), indicated as (1), (2), and (3) in Fig.2(h), respectively. Their positions reported by JLDN are shown in Fig.1. The first two of them coincide with the first two gamma-ray bunches, and furthermore, two smaller LF pulses at and 3.7 ms, though too faint for JLDN, are approximately coincident with the third and fourth bunches. In contrast, we observed no gamma-ray bunches coincident with the third JLDN-reported pulse.
To examine the suggested association between the LF pulses and the gamma-ray bunches, we further expand, in Fig 3, the five pulses of Fig.2(h), where the onset timing of the four gamma-ray bunches are also displayed. The first bunch at took place with a positive LF pulse, which followed a train of negative-polarity fast pulses in , namely stepped leaders, and preceded the return stroke at ms which JLDN reported. The second bunch coincides with an JLDN-reported in-cloud pulse. The third and forth bunches are also correlated with LF pulses which have bipolar shapes. However the onset timings of these bunches have larger uncertainties by 0.1–0.2 ms, which are caused probably because the trigger timing of the subsequent bunch is affected by the charge amplifier recovery from the preceding bunch.
Besides Detectors A–C, eight ICs also detected the entire burst, in the form of a clear increase in their 30-sec dose rates. In particular, those at MP9 and MP6 reached 170 and 25 h-1, respectively. After subtracting the environmental background, the IC doses integrated for 30 sec become 1.4 and 0.2 , respectively (Fig.1). Assuming a bunch duration as 1 ms (4 ms in total), the instantaneous dose rates reach 1.3 and 0.2 Gy h-1, respectively. The data of MP8 were unavailable because it temporarily went down just after the lightning discharge. Since ICs have tolerance for high gamma-ray fluxes by measuring accumulated doses instead of counting photons, their increases must be contributed by both the downward TGF (the 4 bunches) and the sub-second emission component.
A slight dose increase, by or less, was also detected by NaIs. Being typical scintillation detectors, they also failed to properly count gamma rays in the bunches, and hence have measured doses only of the sub-second component, which originates from neutron capturesEnoto et al. (2017) and contains multiple emission lines up to 10.8 MeV. By extrapolating from the 0.05–3.0 MeV NaI doses, those up to 10.8 MeV were estimated as at MP9, which is 1% of the actually measured IC doses. Therefore, we conclude that the IC dose increases were caused predominantly by the downward TGF, rather than by the sub-second emission from neutrons. In the same way, doses by the direct neutrons are negligible. The present gamma-ray burst, as a whole, is inferred to have involved 100 times larger number of gamma-ray photons than those apparently recorded in Fig.2(e)–(g).
IV Monte Carlo Simulations
To quantify the present downward TGF, we performed Monte Carlo simulations with Geant4Agostinelli et al. (2003). As a preliminary attempt, we irradiated a mass model of IC with 0.05–50 MeV gamma rays, which follow a spectrum as , with being the gamma-ray energy, as expected for bremsstrahlung emission by avalanche electronsDwyer et al. (2012). Then, a typical IC dose, 0.050 , was found to correspond to a gamma-ray fluence of photons cm-2. This calibration gives the fluences at MP9 and MP6 as and , respectively. The present TGF spectrum, although not measured by our detectors, could have had an additional power-law component at higher energiesTavani et al. (2011); Celestin et al. (2012). Its inclusion into this simulation, with parameters fixed to those of Tavani et al.(Tavani et al., 2011), was found to increase the fluences necessary to explain the IC doses by only 30% or less. Further assuming the total TGF duration conservatively as ms, the gamma-ray fluxes which arrived at MP9 and MP6 are estimated as and , respectively. Although similar fluxes must have arrived at Detectors A–C, the peak gamma-ray fluxes they actually measured are at most (from their effective areas and Fig.1). Thus, we conclude that the present TGF had a gamma-ray flux which is to times higher than those apparently recorded by Detectors A–C, and completely saturated them.
Then, we performed full simulations starting from electrons. A two-stage simulation was employed for computational economy. In the first stage, initial particles, namely, avalanche electrons were injected in a mass model of the atmosphere, to simulate their atmospheric interactions and track their bremsstrahlung gamma rays. Information of the gamma rays, such as energy, position and momentum vector was collected when they reached the ground. In the second stage, the gamma rays reaching the ground were input into the IC mass model, like in the preliminary examination.
In the above simulation, the initial electrons were assumed to follow the theoretical spectrum of RREA, Dwyer and Babich (2011), where is the electron energy. The electron beam is assumed to be narrow and downward, with neither a tilt angle nor beam divergence. At an altitude from 1000 m to 3000 m with a 250-m step, electrons of 1–50 MeV were injected. Initial electrons below 1 MeV were ignored because their products are mostly absorbed before reaching the ground. The left panel of Fig.4 shows the results from these simulations, in the form of lateral spread of gamma-ray doses, as caused by struggling of electrons and scatterings of bremsstrahlung photons.
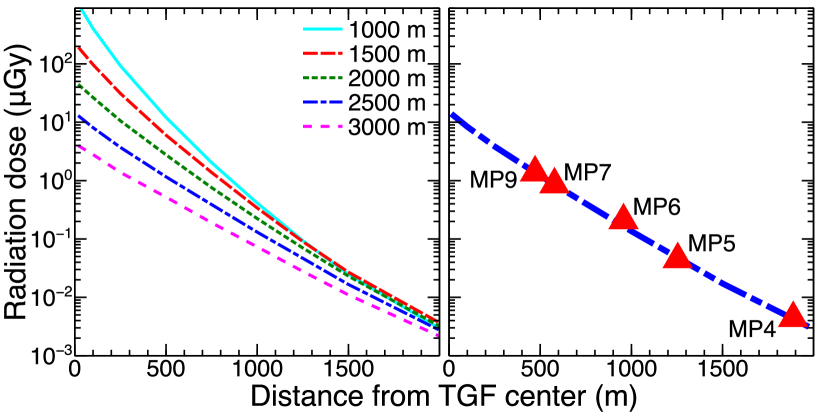
The Monte-Carlo predicted doses at each altitude were compared with the IC measurements at different locations. By changing the TGF center position with the 50-m step, and using the IC data (including 15% systematic errors) within 2000 m of the assumed TGF center, we searched for the best fit solution via chi-square evaluation. Then, as shown in the right panel of Fig.4, the fitting has become acceptable with for 1 degree of freedom (5 data points and 4 parameters, namely 2-dimensional position, altitude and normalization), for the total avalanche electrons above 1 MeV of , the TGF height of altitude, and the TGF center being 100 m southwest from Detector A (Fig.1). Errors are at a 1 confidence level. The on-ground fluences of 1 MeV gamma rays from the four bunches are estimated as at the TGF center, and at an offset of 1 km.
V Discussion
The present burst can be understood as a downward TGF, which consisted of the four gamma-ray bunches like multi-pulse TGFs observed from spaceFoley et al. (2014). The intervals between adjacent bunches in the present case, a few millisecond, are similar to those of multi-pulse TGFsFishman et al. (1994); Foley et al. (2014). As seen in Fig.3(a), the first bunch took place at the last phase of the leader development, in agreement with several previous reportsLu et al. (2010); Cummer et al. (2015); Abbasi et al. (2018); Smith et al. (2018). Since the LF pulses for ms are negative, the relevant leaders must be downward negative ones or upward positive ones. In either case, electrons should be accelerated downward, as required for the occurrence of downward TGFs. In addition, the first bunch clearly preceded the return stroke. This agrees with a simple physical expectation that electrostatic acceleration should be hampered in return strokes, due to azimuthal magnetic filed created by the strong electric current. The other bunches, though coincident with negative LF pulses, also have less clear relations to return strokes of cloud-to-ground currents.
Ordinary TGFs, observed from space, typically initiate at altitudes of 8 kmCummer et al. (2015); Mailyan et al. (2016), namely in middle to upper layers of summertime thunderclouds. In contrast, the estimated altitude of 2.50.5 km in the present case is much lower, where the atmosphere is approximately twice denser. Since winter thunderstorms in Japan typically have 5 km cloud tops and 1 km cloud basesKitagawa (1992), the present TGF is likely to have taken place in a lower to middle layer of the winter thunderclouds,
Using the RHESSI TGF data, Dwyer and SmithDwyer and Smith (2005) estimated the number of involved electrons ( 1 MeV) as –, and Mailyan et al.Mailyan et al. (2016), using inidividual Fermi TGF data, derived as –, with an average of . The estimated electron number of the present burst is in the range of Mailyan et al. Therefore, the downward TGF in the present case have approximately the same properties as ordinary TGFs, despite the atmospheric density difference.
During winter thunderstorms in Japan, Bowers et al.Bowers et al. (2017) detected a downward TGF, and indirectly estimated its total number of photons above 1 MeV as , considering that it produced neutrons via photonuclear reactions. The electron number above 1 MeV of our estimation, , can be converted into the initial number of bremsstrahlung photons as . Therefore, the case of Bowers et al. is similar to ours. Furthermore, we succeeded for the first time in directly measuring the doses included in a downward TGF that triggered photonuclear reactions, and in evaluating the number of avalanche electrons. At the Kashiwazaki-Kariwa site, we previously observed another gamma-ray burst that involved photonuclear reactionsEnoto et al. (2017). We infer that this burst is similar to the present one and that of Bowers et al.Bowers et al. (2017), because the number of photoneutrons in this case is estimated to be of the same order as that of Bowers et al.
In summary, we observed, during a winter thunderstorm, a downward TGF consisting of four gamma-ray bunches coincident with LF pulses. The IC doses and the Monte Carlo simulations allowed us to estimate the total number of avalanche electrons as above 1 MeV, produced at the 2500 m altitude. The present result suggests that downward TGFs in winter thunderclouds have characteristics very similar to those of up-going TGFs, except the electrons being accelerated in the opposite directions into much thicker atmosphere.
Acknowledgements.
We thank the radiation safety group of Kashiwazaki-Kariwa Nuclear Power Station of Tokyo Electric Power Company Holdings for providing the observation site and the MP data. The BGO scintillation crystals were provided by Sakurai Radioactive Isotope Physics Laboratory of RIKEN Nishina Center. We appreciate discussions with T. Torii, M. Ikuta, A. Bamba, H. Odaka, T. Tamagawa, and advice for simulations by G. S. Bowers. The Monte Carlo simulations were performed on the HOKUSAI BigWaterfall supercomputing system of RIKEN Advanced Center for Computing and Communication. The deployment of the LF receiver was supported by Town of Nyuzen, Toyama Prefecture. This research is supported by JSPS/MEXT KAKENHI grants 15K05115, 15H03653, 16H06006, 16K05555, 18J13355, 18H01236, 19H00683, by SPIRITS 2017 and Hakubi projects of Kyoto University, by the Hayakawa Satio Fund of the Astronomical Society of Japan, and by citizen supporters via an academic crowdfunding platform “academist”. The background image in Fig.1 was provided by the Geospatial Information Authority of Japan.References
- Fishman et al. (1994) G. J. Fishman, P. N. Bhat, R. Mallozzi, J. M. Horack, T. Koshut, C. Kouveliotou, G. N. Pendleton, C. A. Meegan, R. B. Wilson, W. S. Paciesas, and et al., Science 264, 1313 (1994).
- Smith et al. (2005) D. M. Smith, L. I. Lopez, R. P. Lin, and C. P. Barrington-Leigh, Science 307, 1085 (2005), http://science.sciencemag.org/content/307/5712/1085.full.pdf .
- Marisaldi et al. (2010) M. Marisaldi, F. Fuschino, C. Labanti, M. Galli, F. Longo, E. Del Monte, G. Barbiellini, M. Tavani, A. Giuliani, E. Moretti, and et al., Journal of Geophysical Research: Space Physics 115 (2010), 10.1029/2009ja014502.
- Tavani et al. (2011) M. Tavani, M. Marisaldi, C. Labanti, F. Fuschino, A. Argan, A. Trois, P. Giommi, S. Colafrancesco, C. Pittori, F. Palma, and et al., Physical Review Letters 106 (2011), 10.1103/physrevlett.106.018501.
- Briggs et al. (2010) M. S. Briggs, G. J. Fishman, V. Connaughton, P. N. Bhat, W. S. Paciesas, R. D. Preece, C. Wilson-Hodge, V. L. Chaplin, R. M. Kippen, A. von Kienlin, and et al., Journal of Geophysical Research: Space Physics 115 (2010), 10.1029/2009ja015242.
- Briggs et al. (2011) M. S. Briggs, V. Connaughton, C. Wilson-Hodge, R. D. Preece, G. J. Fishman, R. M. Kippen, P. N. Bhat, W. S. Paciesas, V. L. Chaplin, C. A. Meegan, and et al., Geophysical Research Letters 38 (2011), 10.1029/2010gl046259.
- Mailyan et al. (2016) B. G. Mailyan, M. S. Briggs, E. S. Cramer, G. Fitzpatrick, O. J. Roberts, M. Stanbro, V. Connaughton, S. McBreen, P. N. Bhat, and J. R. Dwyer, Journal of Geophysical Research: Space Physics 121, 11,346 (2016).
- Smith et al. (2011) D. M. Smith, J. R. Dwyer, B. J. Hazelton, B. W. Grefenstette, G. F. M. Martinez-McKinney, Z. Y. Zhang, A. W. Lowell, N. A. Kelley, M. E. Splitt, S. M. Lazarus, and et al., Journal of Geophysical Research 116 (2011), 10.1029/2011jd016252.
- Bowers et al. (2018) G. S. Bowers, D. M. Smith, N. A. Kelley, G. F. Martinez-McKinney, S. A. Cummer, J. R. Dwyer, S. Heckman, R. H. Holzworth, F. Marks, P. Reasor, and et al., Journal of Geophysical Research: Atmospheres 123, 4977 (2018).
- Gurevich et al. (1992) A. Gurevich, G. Milikh, and R. Roussel-Dupre, Physics Letters A 165, 463 (1992).
- Dwyer (2004) J. R. Dwyer, Geophysical Research Letters 31 (2004), 10.1029/2004gl019795.
- Dwyer (2012) J. R. Dwyer, Journal of Geophysical Research: Space Physics 117 (2012), 10.1029/2011ja017160.
- Celestin and Pasko (2011) S. Celestin and V. P. Pasko, Journal of Geophysical Research: Space Physics 116 (2011), 10.1029/2010ja016260.
- Babich et al. (2015) L. P. Babich, E. I. Bochkov, I. M. Kutsyk, T. Neubert, and O. Chanrion, Journal of Geophysical Research: Space Physics 120, 5087 (2015).
- Tran et al. (2015) M. Tran, V. Rakov, S. Mallick, J. Dwyer, A. Nag, and S. Heckman, Journal of Atmospheric and Solar-Terrestrial Physics 136, 86 (2015).
- Colalillo (2017) R. Colalillo, Proceedings of 35th International Cosmic Ray Conference — PoS(ICRC2017) (2017), 10.22323/1.301.0314.
- Abbasi et al. (2017) R. Abbasi, M. Abe, T. Abu-Zayyad, M. Allen, R. Anderson, R. Azuma, E. Barcikowski, J. Belz, D. Bergman, S. Blake, and et al., Physics Letters A 381, 2565 (2017).
- Abbasi et al. (2018) R. U. Abbasi, T. Abu-Zayyad, M. Allen, E. Barcikowski, J. W. Belz, D. R. Bergman, S. A. Blake, M. Byrne, R. Cady, B. Cheon, and et al., Journal of Geophysical Research: Atmospheres 123, 6864 (2018).
- Dwyer et al. (2004) J. R. Dwyer, H. K. Rassoul, M. Al-Dayeh, L. Caraway, B. Wright, A. Chrest, M. A. Uman, V. A. Rakov, K. J. Rambo, D. M. Jordan, and et al., Geophysical Research Letters 31 (2004), 10.1029/2003gl018771.
- Hare et al. (2016) B. M. Hare, M. A. Uman, J. R. Dwyer, D. M. Jordan, M. I. Biggerstaff, J. A. Caicedo, F. L. Carvalho, R. A. Wilkes, D. A. Kotovsky, W. R. Gamerota, and et al., Journal of Geophysical Research: Atmospheres 121, 6511 (2016).
- Bowers et al. (2017) G. S. Bowers, D. M. Smith, G. F. Martinez-McKinney, M. Kamogawa, S. A. Cummer, J. R. Dwyer, D. Wang, M. Stock, and Z. Kawasaki, Geophysical Research Letters 44, 10,063 (2017).
- Smith et al. (2018) D. M. Smith, G. S. Bowers, M. Kamogawa, D. Wang, T. Ushio, J. Ortberg, J. R. Dwyer, and M. Stock, Journal of Geophysical Research: Atmospheres (2018), 10.1029/2018jd029105.
- Enoto et al. (2017) T. Enoto, Y. Wada, Y. Furuta, K. Nakazawa, T. Yuasa, K. Okuda, K. Makishima, M. Sato, Y. Sato, T. Nakano, and et al., Nature 551, 481 (2017).
- Tsuchiya et al. (2007) H. Tsuchiya, T. Enoto, S. Yamada, T. Yuasa, M. Kawaharada, T. Kitaguchi, M. Kokubun, H. Kato, M. Okano, S. Nakamura, and et al., Physical Review Letters 99 (2007), 10.1103/physrevlett.99.165002.
- Tsuchiya et al. (2011) H. Tsuchiya, T. Enoto, S. Yamada, T. Yuasa, K. Nakazawa, T. Kitaguchi, M. Kawaharada, M. Kokubun, H. Kato, M. Okano, and et al., Journal of Geophysical Research 116 (2011), 10.1029/2010jd015161.
- Tsuchiya et al. (2013) H. Tsuchiya, T. Enoto, K. Iwata, S. Yamada, T. Yuasa, T. Kitaguchi, M. Kawaharada, K. Nakazawa, M. Kokubun, H. Kato, and et al., Physical Review Letters 111 (2013), 10.1103/physrevlett.111.015001.
- Umemoto et al. (2016) D. Umemoto, H. Tsuchiya, T. Enoto, S. Yamada, T. Yuasa, M. Kawaharada, T. Kitaguchi, K. Nakazawa, M. Kokubun, H. Kato, and et al., Physical Review E 93 (2016), 10.1103/physreve.93.021201.
- Wada et al. (2018) Y. Wada, G. S. Bowers, T. Enoto, M. Kamogawa, Y. Nakamura, T. Morimoto, D. M. Smith, Y. Furuta, K. Nakazawa, T. Yuasa, and et al., Geophysical Research Letters 45, 5700 (2018).
- Takayanagi et al. (2013) Y. Takayanagi, M. Akita, Y. Nakamura, S. Yoshida, T. Morimoto, T. Ushio, Z.-i. Kawasaki, D. Wang, N. Takagi, H. Sakurano, and et al., IEEJ Transactions on Fundamentals and Materials 133, 132 (2013).
- Agostinelli et al. (2003) S. Agostinelli, J. Allison, K. Amako, J. Apostolakis, H. Araujo, P. Arce, M. Asai, D. Axen, S. Banerjee, G. Barrand, and et al., Nuclear Instruments and Methods in Physics Research Section A: Accelerators, Spectrometers, Detectors and Associated Equipment 506, 250 (2003).
- Dwyer et al. (2012) J. R. Dwyer, D. M. Smith, and S. A. Cummer, Space Science Reviews 173, 133 (2012).
- Dwyer and Babich (2011) J. R. Dwyer and L. P. Babich, Journal of Geophysical Research: Space Physics 116 (2011), 10.1029/2011ja016494.
- Celestin et al. (2012) S. Celestin, W. Xu, and V. P. Pasko, Journal of Geophysical Research: Space Physics 117, n/a (2012).
- Foley et al. (2014) S. Foley, G. Fitzpatrick, M. S. Briggs, V. Connaughton, D. Tierney, S. McBreen, J. R. Dwyer, V. L. Chaplin, P. N. Bhat, D. Byrne, and et al., Journal of Geophysical Research: Space Physics 119, 5931 (2014).
- Lu et al. (2010) G. Lu, R. J. Blakeslee, J. Li, D. M. Smith, X.-M. Shao, E. W. McCaul, D. E. Buechler, H. J. Christian, J. M. Hall, and S. A. Cummer, Geophysical Research Letters 37 (2010), 10.1029/2010gl043494.
- Cummer et al. (2015) S. A. Cummer, F. Lyu, M. S. Briggs, G. Fitzpatrick, O. J. Roberts, and J. R. Dwyer, Geophysical Research Letters 42, 7792 (2015).
- Kitagawa (1992) N. Kitagawa, Res. Lett. Atmos. Electr. 12, 143 (1992).
- Dwyer and Smith (2005) J. R. Dwyer and D. M. Smith, Geophysical Research Letters 32 (2005), 10.1029/2005gl023848.