Shock fronts in the long GRB031203 host galaxy
Abstract
The detailed modelling of the spectra observed from the long GRB031203 host galaxy at different epochs during the 2003-2009 years is presented. The line profiles show FWHM of 100 . A broad line profile with FWHM 400 appears in the line sockets from the 2009 observations. We suggest that the narrow lines show the velocity of star-burst (SB) debris, while the broad ones are due to the wind from SB stars. The spectra are emitted from the gas downstream of different shock fronts which are at work on the edges of the emitting clouds. A head-on-back shock appears when the wind from the SB stars reaches the internal edge of the SB debris moving outwards. A head-on shock is created by collision of the debris with the ISM clouds. Line ratios in both cases are calculated by the coupled effect of shock and photoionization from the SB. The models selected by fitting the calculated to the observed line ratios show that the ionization parameters, the shock velocities and the gas pre-shock densities slowly decrease with time. Oxygen metallicities (12+log(O/H)=8.3-8.48) are lower than solar (8.82) by a factor 3 and nitrogen metallicities are lower than solar (12+log(N/H)=8.0) by factors of 3-5.
keywords:
radiation mechanisms: general — shock waves — galaxies: GRB host — galaxies: high redshift1 Introduction
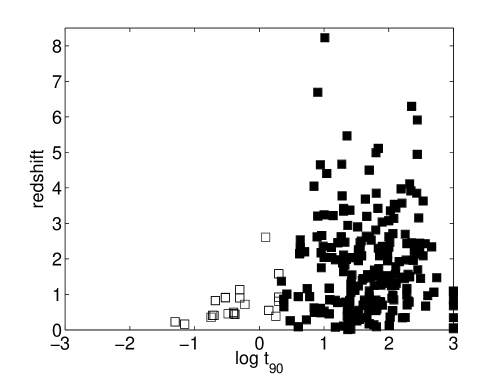
Long duration gamma-ray bursts (LGRB) and short duration GRB (SGRB) have different origins. LGRB derive from implosion of a massive star while SGRB are the product of (neutron star) NS-NS or NS-BH (black hole) collisions. LGRBs appear among young population stars (Fruchter et al 2006, Savaglio et al 2009, etc), while for SGRBs both young and old population stars were found (e.g. Berger 2009, Savaglio et al. 2009, etc.). GRB are distinguished by time periods, which are evident from the distribution of the data. The burst period is T 2s for SGRB, where T is the time interval between 5 percent to 95 percent gamma-ray photons collected by a given instrument (Kouveliotou et al 1993). LGRB have longer duration times, up to several minutes (Kouveliotou et al). Fig. 1 shows the dicotomy of the GRB phenomenon. GRB031203 triggered the imager on-Board the Integral Satellite (IBIS) instrument of the international gamma-ray astrophysics laboratory (INTEGRAL) on 2003 December 3 (Gotz et al 2003) with a duration of 30s and a peak flux of 1.3 10 (20-200 keV, Meneghetti & Gots 2003). A compact dwarf galaxy coinciding with the X-ray source (Hsia et al 2003) was later identified as the GRB031203 host at z=0.1055 (Prochaska et al 2004). A SN event led to the discovery of supernova SN2003lw (Tagliaferri et al 2004). The X-ray and radio afterglows were soon discovered at European Southern Observatory (ESO), starting near infrared (NIR) observations at the New Technology Telescope (NTT) 7 hours after the GRB and then for the X-ray source in GRB031203. Guseva et al (2011) reported the general claim that ”there are no evidences that host galaxies are not peculiar and are similar to star-forming galaxies in the local and distant universe”. They concluded that for galaxies at z0.1, the properties of the LGRB environment can be retrieved from the ISM of the entire galaxy as occurs for GRB031203. The afterglow of GRB031203 was very weak, the faintest ever detected in the optical/NIR. The detection of the SN optical light implies that an extreme dust obscuration was not the reason for such faintness.
In the latest years we have been investigating LGRB and SGRB host galaxy spectra by the detailed calculation of the physical conditions and the element abundances. The results suggest that LGRB and SGRB host galaxies may be distinguished by the N/O distribution trend as function of the redshift at low z (z4 Contini 2017). Moreover, it seems that in some of the SGRB hosts (e.g. SGRB100628A) an active galactic nucleus (AGN) can be present and even coupled to the star-burst (Contini 2019). In this paper we calculate by detailed modelling the line and continuum spectra of LGRB031203 host galaxy. Observations at different epochs were presented by Prochaska et al (2004), Margutti et al (2007), Guseva et al (2011), Watson et al (2011), etc. Observations of the spectra by Margutti et al (2007) at different times in the years 2003-2004 provide the opportunity to follow the variations of the emitted line ratios observed from GRB031203 host on a short time scale. We focus on line and continuum modelling throughout the host galaxy, in particular on the physical conditions and metallicities, on the contribution to the continuum SED of gas bremsstrahlung and reradiation by dust, on the contribution of the underlying old star population in the IR and of radio synchrotron emission. To calculate the physical conditions and the element abundances in LGRB031203 host we use composite models which account for the photoionizing flux from the star-burst (SB) coupled with shocks.
Afterglow issues, host physical features and metallicities which characterize GRB031203 are summarized in Sect. 2. The calculations are presented in Sect. 3 and the results of modelling the line ratios observed by Prochaska et al, Margutti et al (2007), Guseva et al (2011) and Watson et al (2011) appear in Sect. 4. In Sect. 5 the continuum SED observations are compared with the results of the models that were adopted to fit the line ratios. Concluding remarks follow in Sect. 6.
2 General GRB features
In the following we summarize some of the GRB issues which are significant to GRB031203, in particular, a weak afterglow, a complex hydrodynamic host field and low metallicities.
2.1 Afterglow
An afterglow arises when the GRB ejecta are slowed down by collision with circum-burst matter. It shows lower energy than the GRB, long lasting X-ray, optical emission and a long-lived radio emission due to a blast wave subrelativistic envelope. The overall observed isotropic luminosity is 10 erg s (Piran 2004). Berger (2009) by the observational evidence suggests a link of LGRB with the end of life of massive stars (Woosley 1993, Woosley & Bloom 2006) from their association with core collapse supernovae (Hjorth et al 2003). As a consequence the fireball shell expands (Kobayashi & Zhang 2003) into the pre-burst stellar wind of the progenitor star. The wind has a density distribution R. The interaction between the shell and the wind leads to two shocks: one propagating in reverse into the shell and the other propagating forward into the wind. The velocity of the shock propagating in reverse towards the burst decreases due to high density in the ejecta. This could explain the short lifetimes of some afterglows. Giannios et al (2008) claim that the early optical afterglow light curves depend critically on the existence of a reverse shock into a strong magnetized ejecta. In the first afterglow period the reverse shock plays a main role or disappears due to a strong magnetic field (Giannios et al 2008, Zhang & Kobayashi 2005, Sari & Piran 1999, etc). A reverse shock may also dominate the emission in later afterglow phases. After the reverse shock reaches the back part of the ejecta, there is an initial phase of interaction where shocks and rarefaction waves cross the ejecta. Then the whole structure relaxes to a self-similar solution. The X-ray energy emitted during the afterglow is relatively high (e.g. 2-10 keV at 11 hours after GRB, Piran 2004) and is most probably emitted during free expansion. Optical afterglows disappear after a few months, therefore they do not prevent to search for GRB host galaxies (Chen 2018). Recombination coefficients downstream of the shock fronts determine the lifetime of the afterglow. The recombination lifetime of hydrogen ions is t 1/(n ), where =4 10 (T/10) is the recombination coefficient of H (Aldrovandi & Péquignot 1973). A very high density n (adapted to the ejecta) can reduce t to the order of seconds. In the low density case, emission features from the afterglow can be seen even after its disappearance. The afterglow is characterised by synchrotron radiation observable from several days to a few months (Chen 2018). After the first afterglow period and an initial stage of expansion in a dilute ISM, the ejecta will interact with a higher density medium in the host galaxy.
2.2 Host galaxy radiation and collisional ionization sources
A SB is generally present in the GRB host galaxy. The full width at half maximum (FWHM) of the GRB031203 line profiles from Guseva et al (2011, fig. 7) indicates a complex kinetic field with high and low velocities. The narrow line velocity range is 90-130 while the broad line one is 200-330 . This suggests that composite models which account for the photoionization flux from the SB and for shocks, could be appropriate and could add some information about the physical conditions in the host galaxy. The wind from the SB stars affects the host galaxy clouds. The gas is ionized to high levels by radiation and collisional process. Recombination times depend on the physical conditions in the surrounding medium and within the host galaxy. Temperatures can reach T 10K. The expanding shock propagates outwards throughout the circumstellar medium. The evolution of the emitted spectra (line and continuum) observed from the host galaxy is smooth or disturbed depending on the ISM physical conditions throughout the host. After a certain time, the direct effect of the burst on the emitting gaseous and dusty clouds may disappear.
2.3 Metallicities
In GRB hosts, star formation and star formation rates (SFR) are at most calculated from the H line and therefore they depend on the emitting gas conditions such as the density and the temperature. Perley et al (2016) investigating whether the GRB is affecting the SFR independently from other factors, concluded that the most ”invoked possibility” is a dependence on metallicity. GRBs affect the host galaxy properties in the surrounding medium. Therefore, the heavy elements cannot be neglected. SFR is proportional to the fractional abundance of the different ions in different ionization levels. A low metal abundance ”both discourages mass loss from the parent stars and encourage mixing”. Therefore, Perley et al predicted that GRB should occur in very metal poor environments. Single star models (MacFadyen & Woosley 1999, Maeder et al 2005, Hitschi et al 2005, etc ) imply that GRBs should occur mainly in very metal poor environments. On the other hand, to produce GRB through an energetic jet, a high metallicity is needed, because a higher metal abundance produces stronger stellar winds, greater mass loss and less interior mixing (Crowther et al 2002, Heger et al 2003, Vink & de Koter 2005, Hirschi et al 2008). How much does the progenitor’s low metallicity affect the metallicity of the host clouds depends also on the merging processes. The metallicity upper limit to GRB production is estimated by Wolf & Podsidlowski (2007) to 12+log(O/H) 8.7. Chen (2018) reconciled the GRB origin from the death of rapid evolving massive stars with active forming regions into the epoch of reionization.
3 Calculations
3.1 Description of the code
We use composite models which account consistently for photoionization and shocks. The code suma (see also Ferland et al 2016) is adopted. The main input parameters are those which are used for the calculations of the line and continuum fluxes. They account for photoionization and heating by primary and secondary radiation and collisional process due to shocks. The input parameters such as the shock velocity , the atomic preshock density and the preshock magnetic field (for all models =10Gauss is adopted) define the hydrodynamical field. They are used in the calculations of the Rankine-Hugoniot equations at the shock front and downstream. They are combined in the compression equation (Cox 1972) which is resolved throughout each slab of the gas in order to obtain the density profile downstream. Primary radiation for SB in the GRB host galaxies is approximated by a black-body (bb). The input parameters that represent the primary radiation from the SB are the effective temperature and the ionization parameter . A pure blackbody radiation referring to is a poor approximation for a star burst, even adopting a dominant spectral type (see Rigby & Rieke 2004). However, it is the most suitable because the line ratios that are used to indicate also depend on metallicity, electron temperature, density, ionization parameter, morphology of the ionized clouds and, in particular, the hydrodynamical picture. For an AGN, the primary radiation is the power-law radiation flux from the active centre in number of photons cm s eV at the Lyman limit and spectral indices =-1.5 and =-0.7. The primary radiation source does not depend on the host physical condition but it affects the surrounding gas. This region is not considered as a unique cloud, but as a sequence of slabs with different thickness calculated automatically following the temperature gradient. The secondary diffuse radiation is emitted from the slabs of gas heated by the radiation flux reaching the gas and by the shock. Primary and secondary radiation are calculated by radiation transfer.
In our model the line and continuum emitting regions throughout the galaxy cover an ensemble of fragmented clouds. The geometrical thickness of the clouds is an input parameter of the code () which is calculated consistently with the physical conditions and element abundances of the emitting gas. The fractional abundances of the ions are calculated resolving the ionization equations for each element (H, He, C, N, O, Ne, Mg, Si, S, Ar, Cl, Fe) in each ionization level. Then, the calculated line ratios, integrated throughout the cloud thickness, are compared with the observed ones. The calculation process is repeated changing the input parameters until the observed data are reproduced by the model results, at maximum within 10-20 percent for the strongest line ratios and within 50 percent for the weakest ones.
However, some parameters regarding the continuum SED, such as the dust-to-gas ratio and the dust grain radius a are not directly constrained by fitting the line ratios. Dust grains are heated by the primary radiation and by mutual collision with atoms. The intensity of dust reprocessed radiation in the infrared (IR) depends on and a. In this work we use =10 by number for all the models which corresponds to 4.1 10 by mass for silicates (Draine & Lee 1994). The distribution of the grain size along the cloud starting from an initial radius is automatically derived by suma, which calculates sputtering of the grains in the different zones downstream of the shock. The sputtering rate depends on the gas temperature, which is V in the immediate post-shock region. In the high-velocity case ( 500 ) the sputtering rate is so high that the grains with a0.1 m are rapidly destroyed downstream. So, only grains with large radius (a0.1 m ) will survive. On the other hand, the grains survive downstream of low-velocity shocks (200). Graphite grains are more sputtered than silicate grains for T= 10 K (Draine & Salpeter 1979). Small grains (e.g. PAH) survive in the extended galactic regions on scales of hundred parsecs and lead to the characteristic features that appear in the SED. In conclusion, cold dust or cirrus emission results from heating by the interstellar radiation field, warm dust is associated with star formation regions and hot dust appears around AGN (Helou 1986) and in high velocity shock regimes. Therefore, we will consider relatively large grains, e.g. silicate grains with an initial radius of 0.1 -1.0 m .
In the radio range the power-law spectrum of synchrotron radiation created by the Fermi mechanism at the shock front is seen in most galaxies. It is calculated by suma adopting a spectral index of -0.75 (Bell 1977).
3.2 Calculation details
The calculations initiate at the shock front where the gas is compressed and adiabatically thermalised, reaching a maximum temperature in the immediate post-shock region T 1.5 (/100 ). T decreases downstream following recombination. The cooling rate is calculated in each slab. The downstream region is cut into a maximum of 300 plane-parallel slabs with different geometrical widths calculated automatically, to account for the temperature gradient. In each slab, compression is calculated by the Rankine-Hugoniot equations for the conservation of mass, momentum and energy throughout the shock front. Compression (n/) downstream ranges between 4 (the adiabatic jump) and 10, depending on and . The stronger the magnetic field, the lower the compression downstream, while a higher shock velocity corresponds to a higher compression. The ionizing radiation from an external source is characterised by its spectrum and by the flux intensity. The flux is calculated at 440 energies from a few eV to keV. Owing to radiative transfer, the spectrum changes throughout the downstream slabs, each of them contributing to the optical depth. In addition to the radiation from the primary source, the effect of the diffuse radiation created by the gas line and continuum emission is also taken into account, using 240 energies to calculate the spectrum. For each slab of gas, the fractional abundance of the ions of each chemical element is obtained by solving the ionization equations X/X=X+X+X (Contini & Shaviv 1980), where X represents the contribution to ionization from the primary source (stars or AGN) (Williams 1973), X represents the contribution of collisional ionization (Cox & Tucker 1969) and X is the contribution of secondary radiation (Williams 1967). The parameters are described by Contini & Aldrovandi (1983 and references therein) and Viegas-Aldrovandi & Contini (1989 and references therein).
These equations account for the ionization mechanisms (photoionization by the primary and diffuse radiation, and collisional ionization) and recombination mechanisms (radiative, dielectronic recombinations), as well as charge transfer effects. The ionization equations are coupled to the energy equation if collision processes dominate, and to the thermal balance if radiative processes dominate. The latter balances the heating of the gas due to the primary and diffuse radiations reaching the slab with the cooling due to recombinations and collisional excitation of the ions followed by line emission, dust collisional ionization and thermal bremsstrahlung. The coupled equations are solved for each slab, providing the physical conditions necessary for calculating the slab optical depth, as well as its line and continuum emissions. The slab contributions are integrated throughout the cloud. In particular, the absolute line fluxes corresponding to the ionization level i of element K are calculated by the term nK(i), which represents the density of the ion i. We consider that nK(i) = X(i) [K/H] n, where X(i) is the fractional abundance of the ion i calculated by the ionization equations, [K/H] is the relative abundance of the element K to H and n is the density of H (in number cm). In models including shock, n is calculated by the compression equation (Cox 1972) in each slab downstream. Accordingly, the abundances of the elements are given relative to H as input parameters.
Dust grains are coupled to the gas across the shock front by the magnetic field (Viegas & Contini 1994). They are heated by radiation from the AGN and collisionally by the gas to a maximum temperature, which is a function of the shock velocity, of the chemical composition and of the radius of the grains, up to the evaporation temperature (T(dust) 1500 K). The grain radius distribution downstream is determined by sputtering, which depends on the shock velocity and on the density. Throughout shock fronts and downstream, the grains might be destroyed by sputtering.
Summarizing, the code starts by adopting an initial (10 K) and the input parameters for the first slab. It then calculates the density from the compression equation, the fractional abundances of the ions from each level for each element, line emission, free-free emission and free-bound emission. It re-calculates by thermal balancing or the enthalpy equation, and calculates the optical depth of the slab and the primary and secondary fluxes. Finally, it adopts the parameters found in slab i as initial conditions for slab i + 1. Line and continuum intensities are integrated accounting for all the slabs. The number of lines calculated by suma is 200 for each model. They are calculated at the gaseous nebula that emits the spectrum, while the data are observed at Earth. Therefore they diverge by a factor (r/d) that depends on the distance of the nebula from the radiation centre (r), and on the distance (d) of the galaxy to Earth. We then calculate the line ratios to a specific line (in the present case H , which is a strong line), and compare them with the observed line ratios.
On this basis we calculate a grid of models. The set of models (e.g. Table 1) which best reproduce the line ratios is selected. We obtain the final model by cross-checking the fit of the calculated continuum SED to the observed one.
3.3 Modelling the continuum SED
The models constrained by the line spectra give a hint about the relative importance of the different ionization and heating mechanisms which are recognised throughout the continuum SED in each of the objects.
The gas ionized by the SB (or AGN) radiation flux emits continuum radiation (as well as the line fluxes) from radio to X-ray. The continuum accounts for free-free and free-bound radiation (hereafter addressed to as bremsstrahlung). The bremsstrahlung at 10 Hz has a similar slope in all the diagrams. In fact, the bremsstrahlung continuum, emitted by free electrons accelerated in Coulomb collisions with positive ions (mostly H, He and He) in nebulae of charge Z has an emission coefficient (Osterbrock 1974):
J NZ(/3kT) e (1)
The photoionization radiation flux can heat the gas to T 2-4 10 K, while the gas is heated collisionally by the shock to a maximum of T (), where is the shock velocity. The cooling rate downstream depends on N (N is the proton density). The trend of the bremsstrahlung as function of follows the interplay between T and . High temperatures of the emitting gas determine the bremsstrahlung maximum at high . At T1-410 K the exponential term is significant at frequencies between 10 and 10 Hz. The temperatures are calculated by thermal balancing between the heating rates which depend on the photoionizing flux and the cooling rates by free-free, free-bound and line emission. Therefore, the radiation effect is seen mainly in this frequency range. In the radio range, the exponent in eq (1) tends to 0 and the continuum is . So the SEDs in all the diagrams of all galaxy types have similar trends at relatively low frequencies and the dust reprocessed radiation bump in the IR is clearly recognizable.
In conclusions, i) the black body radiation corresponding directly to the temperature dominating in the star-burst is seldom observed in the UV, because absorption is very strong in this frequency range due to strong line formation. ii) The shock effect throughout the SED can be recognized from the maximum frequency and intensity of the dust reprocessed radiation peak in the infrared and of the bremsstrahlung at high frequencies. iii) The gas ionized by the SB (or AGN) radiation flux emits bremsstrahlung from radio to X-ray. The black body emission from the background old star population with T 3000-8000 K generally emerges over the bremsstrahlung throughout the SED in the near-IR(NIR) - optical range. iv) In the radio range synchrotron radiation created by the Fermi mechanism is recognized by its spectral index. Thermal bremsstrahlung in the radio range has a steeper trend which becomes even steeper by self-absorption at low . In the far-IR only comparison with the observation data indicates the source of the continuum radiation flux, because thermal bremsstrahlung, synchrotron radio and cold dust reradiation may be blended.
4 Modelling GRB031203 line spectra
4.1 Spectral characteristics
In the following we present the results obtained by the detailed modelling of the LGRB031203 host galaxy spectra observed by Prochaska et al (2004) on the Magellan/Baade 6.5m telescope and Inamori Magellan Areal Camera and Spectrograph (IMACS), at different epochs (2003-2004) by Margutti et al (2007) on the ESO-Very Large Talescope (VLT) focal reducer/low-resolution spectrograph (FORS) and by Guseva et al (2011) by the VLT X-shooter. Both narrow and broad lines were observed at later times by Guseva et al, in March 2009. Watson et al (2011) presented the first spectroscopic study of the LGRB031203 host galaxy in the mid-IR (5-40 m ) by VLT X-shooter on 2009 March 17 and Spitzer photometric observations from the UV -mid-IR (0.35-40 m ) with detections and upper limits at far-IR, submillimeter and radio wavelengths. They were carried out on 2005 May 28. Observation epochs and H observed fluxes are summarised in Table 1.
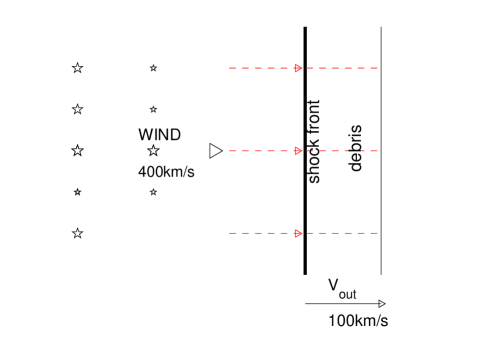
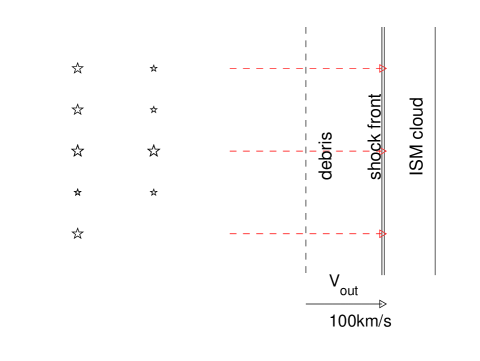
The sketch in Fig. 2 (right panel) represents the clouds emitting the narrow lines (models mod0-mod6 in Tables 2-4), while the left panel explains the broad lines emission (model mod7 in Tables 3 and 4). Both strong and weak shock fronts are reached by the photoionization flux from the SB. In the case of a SB, the clouds (representing the debris from the SB) propagate outwards with velocity V100 from the radiation source i.e. from the SB. The SB debris collide with the ISM clouds which are nearly standing with velocities V30. A head-on shock follows with =V+V100-130. Moreover, a relatively high velocity wind (V400 ) originating from the SB stars reaches the expanding debris yielding a head-on-back shock with =V-V 300 . A high velocity wind at earlier times ( 1000 ) could have easily destroyed the gaseous clouds by collisions. It was shown by Schiano (1985, 1986) that clouds with preshock densities 100 are swept from the region of free flowing winds (Contini & Viegas-Aldrovandi 1990). Regarding line profiles in wind regimes, although in a different contest, Vogel & Nussbaumer (1994) noticed that the luminosity of the hot component of the symbiotic star AG Peg decreased from 1600L in 1978 to 500L in 1990 and furthermore to 400L in 1993. NV and HeII lines exhibited a pure wind profile on top of which a nebular contribution appeared in 1981 and 1986, respectively. These profiles were recognised by Penston & Allen (1985) as a convolution of a nebular component and a broad line component, which they attributed to a wind lost by the hot companion with a velocity of 900 . In all the observations the wind velocity retained this value, although the strength gradually decreased. This decline was followed by qualitative changes in the profiles of the emission features.
| obs | obs | obs | obs | obs | obs | obs | |
| day | 2003 Dec 6.3 | 2003 Dec 20 | 2003 Dec 30 | 2004 Mar 2 | 2004 Sep 2 | 2009 Mar 17 | 2009 Mar 17 |
| H | 51.80.8 | 2142.39326.70 | 2135.9110 | 1932.24571.15 | 1949.33263.49 | 3.850.04 | - |
| Telescope | Magellan/Baade | ESO-VLT | ESO-VLT | ESO-VLT | ESO-VLT | VLT | VLT |
| IMACS | FORS2 | FORS1 | FORS1 | FORS1 | X-shooter | X-shooter |
Prochaska et al (2004); Margutti et al (2007); Margutti et al (2007); Margutti et al (2007); Margutti et al (2007); Guseva et al (2011); Watson et al (2011); in 10 observed at Earth
| obs | mod0 | obs | mod1 | obs | mod2 | obs | mod3 | obs | mod4 | |
| [OII]3728.8 | 1.06 | 1.06 | 1.20 | 1.26 | 1.33 | 1.33 | 1.20 | 1.23 | 1.11 | 1.10 |
| [NeIII]3868+ | 0.83 | 0.90 | 0.98 | 1.00 | 0.88 | 0.97 | 0.84 | 1. | 0.83 | 1.00 |
| H | 0.49 | 0.46 | 0.46 | 0.46 | 0.45 | 0.46 | 0.43 | 0.46 | 0.45 | 0.46 |
| [OIII]4363 | 0.11 | 0.08 | 0.08 | 0.08 | 0.08 | 0.08 | 0.07 | 0.08 | 0.08 | 0.08 |
| HeI 4471.5 | 0.05 | 0.05 | 0.03 | 0.05 | - | - | - | - | - | - |
| H | 1 | 1 | 1 | 1 | 1 | 1 | 1 | 1 | 1 | 1 |
| [OIII]5007+ | 8.46 | 8.40 | 8.72 | 8.50 | 8.52 | 8.69 | 8.61 | 8.55 | 8.53 | 8.50 |
| HeI 5876 | 0.12 | 0.14 | 0.11 | 0.14 | 0.12 | 0.14 | 0.12 | 0.14 | 0.14 | 0.14 |
| [OI] 6300+ | 0.02 | 0.01 | 0.04 | 0.02 | 0.03 | 0.016 | 0.04 | 0.01 | 0.03 | 0.01 |
| [SIII]6312 | 0.02 | 0.02 | 0.02 | 0.02 | 0.02 | 0.02 | 0.02 | 0.02 | 0.01 | 0.02 |
| [NII]6548+ | 0.21 | 0.21 | 0.21 | 0.25 | 0.19 | 0.20 | 0.18 | 0.20 | 0.19 | 0.18 |
| H | 2.82 | 2.90 | 2.83 | 2.9 | 2.78 | 2.91 | 2.79 | 2.89 | 2.96 | 2.89 |
| [SII]6717 | 0.08 | 0.08 | 0.09 | 0.08 | 0.10 | 0.08 | 0.10 | 0.1 | 0.10 | 0.10 |
| [SII]6731 | 0.07 | 0.09 | 0.07 | 0.08 | 0.07 | 0.08 | 0.08 | 0.08 | 0.08 | 0.08 |
| [AIII]7136 | 0.07 | 0.06 | 0.07 | 0.10 | 0.07 | 0.07 | 0.07 | 0.1 | 0.06 | 0.10 |
| [OII]7320+ | - | - | 0.03 | 0.04 | 0.04 | 0.03 | 0.03 | 0.02 | 0.02 | - |
obs - obs observations are described in Table 1;
| obs | mod5 | obs | mod6 | obs | mod7 | |
| [OII]3728.8 | 0.86 | 086 | 0.98 | 0.99 | - | 1.03 |
| [NeIII]3868+ | 0.38 | 0.40 | - | - | - | 0.49 |
| H | 0.50 | 0.46 | - | - | 0.48 | 0.46 |
| [OIII]4363 | 0.09 | 0.10 | - | - | - | 0.07 |
| HeI 4471.5 | 0.04 | 0.05 | - | - | - | 0.05 |
| [ArIV]4711 | 0.016 | 0.02 | … | - | - | 0.1 |
| H | 1 | 1 | 1 | 1 | 1 | 1 |
| [OIII]5007+ | 9.78 | 9.20 | 5.89 | 5.60 | 10.20 | 10.30 |
| HeI 5876 | 0.12 | 0.13 | - | - | 0.10 | 0.14 |
| [OI] 6300 | 0.03 | 0.01 | 0.03 | 0.01 | - | 0.01 |
| [SIII]6312 | 0.02 | 0.02 | - | 0.02 | - | 0.01 |
| [NII]6548+ | 0.18 | 0.17 | 0.13 | 0.17 | - | 0.17 |
| H | 2.85 | 2.92 | - | 2.96 | - | 2.90 |
| [SII]6717 | 0.09 | 0.08 | 0.18 | 0.16 | 0.20 | 0.70 |
| [SII]6731 | 0.07 | 0.08 | - | - | 0.20 | 0.10 |
| [AIII]7136 | 0.06 | 0.05 | - | - | 0.08 | 0.06 |
| [OII]7320+ | 0.03 | 0.03 | - | - | - | 0.05 |
| [SIII]9069 | 0.25 | 0.26 | - | - | 0.45 | 1.00 |
| [SIV]10.61 | 0.47 | 0.60 | - | - | 0.50 | |
| [NeII]12.8 | 0.04 | 0.04 | - | - | 0.04 | |
| [NeIII]15.56 | 0.59 | 0.53 | - | - | - | 0.80 |
| [SIII]18.71 | 0.29 | 0.27 | - | - | - | 0.36 |
| H | 0.07 | 0.06 | - | 0.25 |
obs observations by Guseva et al and obs reported by Watson et al are described in Table 1; obs the broad line ratios presented by Guseva et al.; H absolute flux calculated at the nebula in .