Supplemental Materials
for the paper entitled
Thermal evolution of silicon carbide electronic bands
I Description of the hexagonal silicon carbide crystals
Silicon carbide (SiC) has over 250 polytypes which share the same hexogonal lattice in the basal plane and different stacking sequences of Si-C bilayers perpendicular to the basal plane. The most important polytypes are the so-called and SiC as shown in Fig. S1(a) and Fig.1(a) in the main text. They consist of 4 and 6 Si-C double layers having a close-packed hexagonal arrangement. There are three types of hexagonal close packing (A, B and C) in arranging the Si-C double atomic layers. In and the stacking sequences are ABCBABCB and ABCACBABCACB, respectively. Each atom (Si or C) has a local quasicubic () or hexagonal () environment with respect to the immediate neighbors. The experimental lattice constants are a = 3.08 Å with c = 10.08 Å Stockmeier et al. (2009) and a = 3.08 Å with c = 15.12 Å Stockmeier et al. (2009) for and SiC, respectively, and the ideal values for the internal parameters follow from the space group symmetry Käckell et al. (1994).
II Electronic structure of hexagonal silicon carbide crystals
We applied density functional theory (DFT) within local density approximation (LDA) as reported in the main text. The calculation of the phonon dispersion curves required the optimization of the lattice constants. This results into a = 3.07 Å with c = 10.0 Å Stockmeier et al. (2009) and a = 3.07 Å with c = 15.0 Å for and SiC, respectively, that are close to the experimental values. The optimized internal parameters remain close to the ideal ones Käckell et al. (1994).


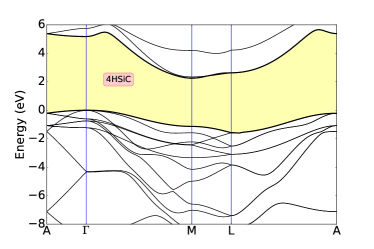

and SiC are indirect semiconductors with relatively large band gaps at room temperature, and eV, respectively Hellwege et al. (1982). The calculated electronic band structures are shown in Fig. S1(c) and (d) versus high symmetry lines ---- within the Brillouin-zone (BZ) of the hexagonal system (see Fig.S1(b)). The overall features show the agreement with previous calculations Käckell et al. (1994); Park et al. (1994); Wenzien et al. (1995). The top of the occupied valence-band states is located at in both polytypes. As reported by Käckell et al. (1994); Lambrecht et al. (2001) the exact position of conduction band minimum depends on the details of the calculation, on the ratio of the hexagonal lattice constants, as well as on the atomic positions inside the hexagonal unit cell. We find the conduction band minimum at for SiC and at about for SiC. However, the lowest conduction band is rather flat between and in SiC case. For this reason, we assume that the bottom of the conduction band occurs at the point of the BZ, yielding just a minor error in the calculated LDA fundamental gap for SiC. Moreover, we observe that at the CBM two bands are very close in energy. We will label them in the follow as and .
At DFT-LDA level we obtain 2.25 eV for SiC and 2.04 eV for SiC, about 1.0 eV lower than the corresponding measured values, and in agreement with other theoretical works Wenzien et al. (1995); Käckell et al. (1994). The discrepancy in the absolute value of the indirect band gaps comes from the well-known self-interaction error of the LDA but the curvature of the individual bands are well reproduced by this approximation. As a consequence, the effective masses of the electrons, i.e., the inverse of the second derivatives of the energies around the point for the conduction band minimum, can be accurately calculated by DFT-LDA.
III Quasiparticle correction in the electronic structure of hexagonal silicon carbides
Assuming DFT-LDA orbitals as a good approximation to the quasi-particle (QP) orbitals, the first-order correction to the Kohn-Sham eigenenergies is obtained within a single iteration of Hedin’s GW approximation Hedin (1965); Hedin and Lindqvist (1969). For SiC, the exact position of the conduction band minimum (CBM) on the line has been under discussion Park et al. (1994); Käckell et al. (1994); Lambrecht et al. (2001). Wenzien et al. Wenzien et al. (1995) found a tendency of CBM of -SiC to move towards point after the inclusion of QP effects. They used a simplified GW method, meaning a model dielectric function and an approximate treatment of the local filed effects. Ummels et al. Ummels et al. (1998) performed GW calculations for the , , and SiC polytypes using the Engel and FaridEngel and Farid (1993) plasmon pole model for the description of the energy dependence of the screened interaction. They obtained G0W0 indirect band gaps of eV and eV for and SiC, respectively (see Table I in the main manuscript). Our correction obtained with Godby-Needs plasmon-pole model Godby and Needs (1989); Hedin (1965); Hedin and Lindqvist (1969); Bockstedte et al. (2010) as implemented in Yambo Sangalli et al. (2019) code, results to be lower with respect to those calculated by Ummels et al.Ummels et al. (1998). This is due to the different plasmon pole model (PPM) used. Godby-Needs PPM best reproduces the model-free contour deformation (CD) resultsFriedrich et al. (2011), when other PP models are applied the gap obtained is significantly higher and in particular Engel and Farid PPM gives for ZnO a GW correction - eV larger than the CD one Stankovski et al. (2011).
In our study, we have to rely on the DFT-LDA geometries as we have to calculate phonon bands which assumes to stay close to the global energy minimum of the adiabatic potential energy surface. Our GW calculations justify to apply a simple scissor correction on the DFT-LDA band gaps, in order to reproduce the experimental ones.
IV Phonons of hexagonal silicon carbides
In view of the calculation of the temperature dependent renormalization of the electronic gap, the phonon dispersion curve is an essential input for phonon-related properties. Besides the fact that the phonon dispersion curve reflects the structure of a material and its symmetries, phonon spectra are one of the key ingredients that help in understanding the coupling between electrons and lattice vibrations. Symmetry analysis shows that phonon modes can be decomposed into modes, where for SiC and SiC, respectively. Whose modes are acoustic and are optic modes. Except for modes which are infrared and Raman forbidden, all the other are Raman active modes. Out of them and modes are also infrared active.


The calculated phonon dispersion curves are shown in Fig. S2. Table SI reports the theoretical and experimental phonon frequencies at point for and SiC. All the available experimental modes were readily assigned. The phonon modes with longer wavelength are divided into axial or basal plane modes, depending if the atoms displace parallel or perpendicular to the -axis, as explained in Ref. Patrick (1968). The planar modes consist of Raman and IR active modes and Raman active modes. The axial modes consist of Raman active and Raman inactive modes. Our vibrational frequencies at point are in excellent agreement with previously published calculations and with experimental phonon dispersion curves obtained by infrared and Raman spectroscopies Feldman et al. (1968a, b); Nienhaus et al. (1995); Nakashima and Harima (1997); Bluet et al. (1999), being the average error smaller than 4 cm-1. This supports our choice of using DFT-LDA eigenergies and DFPT-LDA phonon frequencies as key ingredients for the calculation of the electron-phonon interaction.
| Irrep | DFPT-LDA | Exp.111Refs. Feldman et al.,1968a; Nakashima and Harima,1997 | Exp.222Ref. Bluet et al.,1999 | Branch |
|---|---|---|---|---|
| freq. | Raman | IR reflectivity | ||
| 192.3 | 196.0 | - | B.Ac. | |
| 200.3 | 204.0 | - | B.Ac. | |
| 259.2 | 266.0 | B.Ac. | ||
| 401.1 | - | - | Ax.Ac. | |
| 409.2 | - | - | Ax.Ac. | |
| 608 | 610.0 | 610.5 | Ax.Ac. | |
| 763.9 | N.O. | B.Opt. | ||
| 771.4 | N.O. | - | B.Opt. | |
| 779.7 | 776.0 | - | B.Opt. | |
| 790.2 | 797 | B.Opt. | ||
| 838.7 | 838 | 839 | Ax.Opt. | |
| 910.6 | - | - | Ax.Opt. | |
| 920.1 | - | - | Ax.Opt. | |
| 958.8 | 964 | Ax.Opt. |
| Irrep | DFPT-LDA | Exp.333Ref. Feldman et al.,1968b | Exp.444Ref. Bluet et al.,1999 | Branch |
|---|---|---|---|---|
| freq. | Raman | IR reflectivity | ||
| 142.7 | 145.0 | - | B.Ac. | |
| 147.4 | 149.0 | - | B.Ac. | |
| 229.6 | 236.0 | B.Ac. | ||
| 235.2 | 241.0 | B.Ac. | ||
| 259.7 | 262.0 | - | B.Ac. | |
| 281.0 | - | - | Ax.Ac. | |
| 283.4 | - | - | Ax.Ac. | |
| 504.1 | 504 | Ax.Ac. | ||
| 511.9 | 508 | Ax.Ac. | ||
| 610.5 | - | - | Ax.Ac. | |
| 763.1 | 766 | - | B.Opt. | |
| 765.7 | 769 | B.Opt. | ||
| 773.3 | 777 | B.Opt. | ||
| 782.0 | N.O. | - | B.Opt. | |
| 783.2 | 788 | - | B.Opt. | |
| 789.5 | 797 | 789 | B.Opt. | |
| 837.9 | - | - | Ax.Opt. | |
| 882.9 | N.O. | 884 | Ax.Opt. | |
| 887.6 | 889 | 889 | Ax.Opt. | |
| 937.1 | - | - | Ax.Opt. | |
| 944.8 | - | - | Ax.Opt. | |
| 960.1 | 964 | Ax.Opt. |
V Additional data on the calculated electron-phonon interaction
This section provides details about the convergence of the temperature dependent electron-phonon coupling of the valence bands as well as the the calculated temperature shifts for the two lowest energy conduction bands around point.
We find that the calculated temperature shifts of the valence bands depends on the number of conduction bands used in the calculation of electron-phonon coupling whereas the temperature shifts of the conduction bands converge much faster with the number of conduction bands as shown in Fig. S3(c). As can be inferred in Fig. S3(a), the calculated temperature shifts in the valence band and the indirect band gap are absolutely convergent by using 100 bands in the calculation of the electron-phonon coupling for SiC, as the 90 bands and 100 bands data are practically identical. This corresponds to about of the number of valence bands ( bands without core electrons). As a consequence, the convergent number of bands should be around 150 for SiC that has valence bands. However, it is technically prohibitive to carry out such calculations for SiC. Thus, we carried out electron-phonon coupling calculations with non-converged 120 bands, which is only of the number of valence bands. We estimated the converged data by taking the difference in the calculated 80 bands data ( of the number of valence bands in SiC) and the convergent 100 bands data of SiC. Then we extrapolated the convergent 150 bands numerical data by these differences at the given temperature in SiC obtaining the thermal evolution of the indirect band gap and of VBM and CBM as shown in Fig. S3(b)-(d).


Next we turn to the calculated temperature shifts for the two lowest energy conduction bands around point. We found an energy separation of meV at DFT level between the two lowest conduction bands of -SiC, as reported in Table I of the main manuscript. QP corrections shift down the second conduction band with respect to the first one of meV. The final inclusion of the electron-phonon interaction leads to a positive zero point energy correction of meV and meV at K. For SiC the energy separation is meV at DFT level, it increases up to meV by the inclusion of QP effects, and then it gets to meV with zero point energy correction.


VI Additional data about conductivity of electrons in SiC
In extrinsic semiconductors, containing donor impurities, the presence of donor levels shifts the Fermi level from the middle of the energy gap toward the edge of the conduction band. Let us define the ionization temperature of the donor levels as
| (1) |
where is the binding energy of the donor levels, is the Boltzmann constant and the density of donor impurities is supposed to be uniform in the sample. Within the perspective of employing SiC in devices operating at temperature of around 800 K, we expect that all the donor levels at meV below the bottom of the conduction band, are occupied and the chemical potential must be located in the energy range , where is the donor level and is the lowest conduction band position. In the low temperature regime, the temperature dependence of carrier conductivity is given by Refs. Grosso and Pastori Parravicini, 2000; Yepifanov, 1974
| (2) |
being inversely proportional to the effective mass of the electron, which is the inverse of the second derivative of the conduction band along a given direction in the Brillouin-zone. The effective masses of the second conduction band () is generally greater (except along line) than of the first conduction band () (see Table SII). is the donor impurities density and electronic charge . The carrier conductivity as a function of temperature for binding energy donor levels equal to 120 meV in SiC is represented in Fig. S5.

On the other hand for binding energy donor levels equal to 60 meV the carrier conductivity as a function of temperature is given by Refs. Grosso and Pastori Parravicini, 2000; Yepifanov, 1974
| (3) |
| Effective mass | direction | (exp.) | ||
|---|---|---|---|---|
| 0.48 | 0.42 | 0.67 | ||
| 0.27 | 0.29 | 0.61 | ||
| 0.28 | 0.16 |
References
- Stockmeier et al. (2009) M. Stockmeier, R. Müller, S. A. Sakwe, P. J. Wellmann, and A. Magerl, Journal of Applied Physics 105, 033511 (2009).
- Käckell et al. (1994) P. Käckell, B. Wenzien, and F. Bechstedt, Phys. Rev. B 50, 10761 (1994).
- Lambrecht et al. (2001) W. R. L. Lambrecht, S. Limpijumnong, S. N. Rashkeev, and B. Segall, physica status solidi (b) 202, 5 (2001).
- Hellwege et al. (1982) K. Hellwege, O. Madelung, and Landolt-Börnstein, eds., Semiconductors Physics of Group IV Elements and III-V Compounds, Vol. New Series (Springer, Berlin, 1982).
- Park et al. (1994) C. H. Park, B.-H. Cheong, K.-H. Lee, and K. J. Chang, Phys. Rev. B 49, 4485 (1994).
- Wenzien et al. (1995) B. Wenzien, P. Käckell, F. Bechstedt, and G. Cappellini, Phys. Rev. B 52, 10897 (1995).
- Hedin (1965) L. Hedin, Phys. Rev 139, A796 (1965).
- Hedin and Lindqvist (1969) L. Hedin and S. Lindqvist, Solid State Physics, Advances in Research and Application 23, 1 (1969).
- Ummels et al. (1998) R. T. M. Ummels, P. A. Bobbert, and W. van Haeringen, Phys. Rev. B 58, 6795 (1998).
- Engel and Farid (1993) G. E. Engel and B. Farid, Phys. Rev. B 47, 15931 (1993).
- Godby and Needs (1989) R. Godby and R. Needs, Physical review letters 62, 1169 (1989).
- Bockstedte et al. (2010) M. Bockstedte, A. Marini, O. Pankratov, and A. Rubio, Phys. Rev. Lett. 105, 026401 (2010).
- Sangalli et al. (2019) D. Sangalli, A. Ferretti, H. Miranda, C. Attaccalite, I. Marri, E. Cannuccia, P. Melo, M. Marsili, F. Paleari, A. Marrazzo, G. Prandini, P. Bonfà, M. O. Atambo, F. Affinito, M. Palummo, A. Molina-Sánchez, C. Hogan, M. Grüning, D. Varsano, and A. Marini, Journal of Physics: Condensed Matter 31, 325902 (2019).
- Friedrich et al. (2011) C. Friedrich, M. C. Müller, and S. Blügel, Phys. Rev. B 84, 039906 (2011).
- Stankovski et al. (2011) M. Stankovski, G. Antonius, D. Waroquiers, A. Miglio, H. Dixit, K. Sankaran, M. Giantomassi, X. Gonze, M. Côté, and G.-M. Rignanese, Phys. Rev. B 84, 241201 (2011).
- Patrick (1968) L. Patrick, Phys. Rev. 167, 809 (1968).
- Feldman et al. (1968a) D. W. Feldman, J. H. Parker, W. J. Choyke, and L. Patrick, Phys. Rev. 173, 787 (1968a).
- Feldman et al. (1968b) D. W. Feldman, J. H. Parker, W. J. Choyke, and L. Patrick, Phys. Rev. 170, 698 (1968b).
- Nienhaus et al. (1995) H. Nienhaus, T. Kampen, and W. Mönch, Surface Science 324, L328 (1995).
- Nakashima and Harima (1997) S. Nakashima and H. Harima, physica status solidi (a) 162, 39 (1997).
- Bluet et al. (1999) J. Bluet, K. Chourou, M. Anikin, and R. Madar, Materials Science and Engineering: B 61-62, 212 (1999).
- Choyke (1969) W. Choyke, Mater. Res. Bull. 4, 141 (1969).
- Ščajev and Jarašiūnas (2009) P. Ščajev and K. Jarašiūnas, Journal of Physics D: Applied Physics 42, 055413 (2009).
- Miedema et al. (2014) P. S. Miedema, M. Beye, R. Könnecke, G. Schiwietz, and A. Föhlisch, Journal of Electron Spectroscopy and Related Phenomena 197, 37 (2014).
- Klahold et al. (2017) W. Klahold, C. Tabachnick, G. Freedman, R. P. Devaty, and W. J. Choyke, in Silicon Carbide and Related Materials 2016, Materials Science Forum, Vol. 897 (Trans Tech Publications, 2017) pp. 250–253.
- Grosso and Pastori Parravicini (2000) G. Grosso and G. Pastori Parravicini, Solid State Physics (Academic Press, 2000).
- Yepifanov (1974) G. Yepifanov, Physical principles of micro-electronics (MIR Publichers Moscow, 1974).
- Son et al. (1995) N. T. Son, W. M. Chen, O. Kordina, A. O. Konstantinov, B. Monemar, E. Janzén, D. M. Hofman, D. Volm, M. Drechsler, and B. K. Meyer, Applied Physics Letters 66, 1074 (1995), https://doi.org/10.1063/1.113576 .