Controlled and robust two-mode emission from the interplay of driving and thermalization in a dye-filled photonic cavity
Abstract
Two dimensional photon gases trapped in dye-filled microcavities can undergo thermalization and nearly ideal equilibrium Bose-Einstein condensation. However, they are inherently driven-dissipative systems that can exhibit an intricate interplay between the thermalizing influence of the environment given by the dye solution and the pump and loss processes driving the system out of equilibrium. We show that this interplay gives rise to a robust mechanism for two-mode emission, when the system is driven by an off-centered pump beam. Namely, after the system starts lasing in the dominantly pumped excited mode, in a second transition a photon condensate is formed in the ground mode, when the pump power is increased further. This effect is a consequence of the redistribution of excited dye molecules via the lasing mode in combination with thermalization. We propose to exploit this effect for engineering controlled two-mode emission and demonstrate that by tailoring the transverse potential landscape for the photons, the threshold pump power can be tuned by orders of magnitude.
pacs:
A system of photons in a dye-filled cavity can be used as a platform for studying the interplay between gain and loss on the one hand and thermalization (via the rovibrational relaxation of the dye molecules interacting with the environment given by the solvent) on the other. While the former process describes simple lasing Siegman (1986), in the last decade the regime where thermalization is the dominant process, has been realized and equilibrium-like Bose condensation of photons was observed in various systems Klaers et al. (2010a); Marelic and Nyman (2015); Weill et al. (2019); Rajan et al. (2016); Nyman and Walker (2018); Walker et al. (2018). Also the temporal Hesten et al. (2018a, b); Schmitt (2018) and spatial Keeling and Kirton (2016) features of photon BECs driven out of equilibrium have been studied, as well as the demarcation of photon BECs from lasers Schmitt et al. (2015, 2016); Leymann et al. (2017); Vorberg et al. (2018); Radonjić et al. (2018), the grand-canonical statistics in photon BECs Schmitt et al. (2014), the breakdown of equilibrium-like behavior Kirton and Keeling (2015) and the thermo-optic interaction effects Stein et al. (2019). Very recently, it was found both theoretically Hesten et al. (2018c) and experimentally Walker et al. (2018) that excited cavity modes start to emit coherently together with the ground mode, when the pump power and the photon loss are increased relative to the thermalizing coupling to the dye. A complex network of small patches in parameter space corresponding to various phases characterized by different combinations of modes with macroscopic occupation is predicted Hesten et al. (2018c).
While the last described situation gives rise to rich physics, it is not an ideal starting point for the robust engineering and the control of multi-mode emission. In this paper we, therefore, explore an alternative non-equilibrium scenario, where, in contrast to previous studies, the interplay between driving and thermalization is controlled by an off-centered pump beam. We find that the system undergoes two pump-power driven non-equilibrium phase transitions. First, the system starts to lase in an excited mode, which is directly determined by the position of the pump spot. When the pump power is increased further, the spatial redistribution of pump power mediated by this lasing mode then triggers a second transition, where thermalization leads to the additional formation of an equilibrium-like Bose condensate in the ground mode. In a system where both drive and thermalization are present, a sharp distinction between lasing and Bose condensation is, strictly speaking, no longer possible. Nevertheless, the characterizations of the first transition as lasing and the second as condensation provides a useful way to mark the mechanisms (selective pumping vs. thermalization) that are mainly responsible for the mode selection. The fact that the lasing mode can be selected by adjusting the pump spot, while the second transition always corresponds to the on-set of ground-state condensation, makes this mechanism of lasing-assisted Bose condensation a promising tool for engineering systems with robust and tunable two-mode emission. In order to explore this prospect further, we investigate how far the effect can be controlled by shaping the transverse potential landscape in the cavity, as it can be done by using recently developed experimental tools based on thermo-optic imprinting Dung et al. (2017). When pumping the upper minimum of an asymmetric double well, the second transition threshold can be shifted by orders of magnitude by tuning the system close to or further away from interwell resonances.
We describe the system in terms of semiclassical rate equations Kirton and Keeling (2013); Keeling and Kirton (2016); Hesten et al. (2018c) for the photon mode populations , and the fraction of excited dye molecules at position , ,
| (1) | |||||
| (2) | |||||
Here is the rate of spontaneous losses into non-cavity modes and the photon loss rate, which is assumed to be mode independent. The density of the dye molecules is denoted by . The transverse photonic modes resulting from the two-dimensional (2D) trap imposed by the mirrors correspond to frequencies . The spatially varying pump rate has the form , where is a normalized 2D off-centered Gaussian with standard deviation and mean . The gain of mode is quantified by its overlap with the distribution of excited dye molecules . In a solution, the rovibrational states of the dye molecules relax rapidly to equilibrium. As a result, their occupation numbers need not to be taken into account explicitly and the absorption and emission rates, and satisfy the Kennard-Stepanov law McCumber (1964); Klaers et al. (2010b); Moroshkin et al. (2014) , where denotes the zero-phonon frequency of the dye.
In the following discussion we will use the general term “Bose selected” for modes acquiring macroscopic occupation, which subsumes both equilibrium Bose condensation as well as non-equilibrium processes leading to a macroscopic occupation of bosonic modes Vorberg et al. (2013); Leymann et al. (2017); Vorberg et al. (2015, 2018). The selection of mode is associated with (approaching) the divergence of the steady-state occupation in that mode, which happens when reaches the threshold value Hesten et al. (2018c)
| (3) |
Here we have isolated the dimensionless thermalization parameter Keeling and Kirton (2016); Hesten et al. (2018c), which quantifies the coupling between the photons and the dye relative to the loss. Once a mode is selected, the gain is clamped Siegman (1986) close to the threshold .
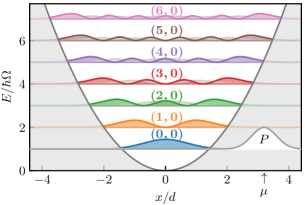
We compute the steady state of the system using parameter values corresponding to the experiments of Refs. Schmitt et al. (2015); Dung et al. (2017). We choose room temperature, , and a slightly anisotropic harmonic trap, with . The frequency spacing is , while is the harmonic oscillator length. The transverse photonic modes [Fig. 1] are labeled by non-negative integer harmonic oscillator quantum numbers in and direction, . The zero-phonon line is set to . The frequency of the ground mode, including the longitudinal contribution , reads and the corresponding absorption rate is . From the measured absorption and fluorescence spectra of the Rhodamine 6G dye Keeling and Kirton (2016), we obtain the corresponding rates as fitted functions of the frequency , which satisfy the Kennard-Stepanov law. The thermalization parameter lies between and , while the rate of spontaneous losses into non-cavity modes is set to . The Gaussian pump spot of width is shifted away from the trap center by , so that it has essentially no overlap with the ground mode [see Fig. 1]. In this way, the competition between driving and thermalization is enhanced. A similar off-centered pump has already been realized experimentally to study the transient relaxation dynamics following a short pump pulse Schmitt et al. (2015). In contrast, we are interested in the steady state of the continuously pumped system.
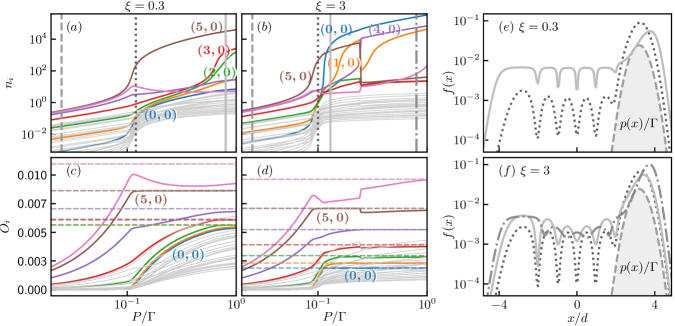
Numerically obtained mode populations for and are shown in Figs. 2(a) and (b), respectively. The colors correspond to the modes as shown in Fig. 1. In both cases mode (5,0) (brown) is selected first. Figs. 2(c) and (d) depict the corresponding gain of each mode (solid curves) as a function of the pump rate. The threshold values of the gain are shown as the dashed horizontal lines. One can see that each mode selection [Fig. 2(a, b)] is accompanied by gain clamping [Fig. 2(c,d)].
In order to understand, which mode becomes selected first, let us approximate the distribution of excited dye molecules in the steady state below the first threshold by . Here the first expression is obtained from Eq. (2) by neglecting the coupling to the still weakly occupied photonic modes. Inserting this expression into the threshold gain given by Eq. (3), we get the following condition for the threshold pump rate of mode
| (4) |
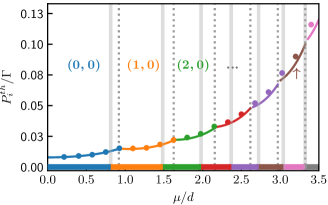
The selected mode is the one with the lowest value of . We see that there are two competing effects here. While the denominator favors modes having a large overlap with the pump spot (i.e. excited modes), the numerator favors modes with low energy. For a narrow pump spot with , as considered here, we expect the former effect to be the dominant one. Figure 3 shows the threshold pump rate of the first selection as a function of the pump spot position . Results from Eq. (4) (solid curve) match the exact values obtained numerically (dots) very well. The colors and the labels indicate which mode is selected first; it changes at the vertical dotted lines. The colored bars at the bottom, separated by solid vertical lines, in turn indicate the mode with the largest overlap with the pump spot. We can see that the impact of the nominator in Eq. (4) is to slightly shift the solid lines with respect to the dotted lines. However, as expected, energetics plays a minor role in the selection of the first mode compared to its overlap with the pump spot. For the value , which was used for the simulations shown in Figs. 1 and 2 (arrow in Fig. 3), the selected mode is , which has only slightly lower gain then the highest gain mode . Therefore, we refer to the first selection as lasing, since (for ) an excited mode is selected predominantly as a consequence of its large gain.
Once the system starts to lase in an excited mode, this mode will create excited dye molecules in an extended region in space, much larger than the narrow off-centered pump spot. This can be seen in Fig. 2(e, f) showing the spatial distribution of excited dye molecules along the axis of the pump spot displacement (-axis). The different linestyles correspond to the pump rates indicated by the vertical lines of the same style in Fig. 2(a, b). As mentioned previously, below the first threshold there are no selected modes and , as can be seen from the perfect match between the dashed line and the shaded area denoting . The dotted curve, which shows just above the lasing transition, has the additional structure corresponding to the first selected mode. This lasing assisted redistribution of pump-power can then trigger the selection of a second mode. For a sufficiently large thermalization parameter (which lowers the threshold gain [Eq. (3)]), this mode is always found to be the ground state, which is favored via thermalization with the dye due to its lowest energy. Thus, in this respect, the second transition is akin to equilibrium Bose condensation and we call this effect lasing assisted ground-state condensation. The two facts that (i) the mode which is selected first can be accurately controlled via the position of the pump spot [Fig. 3] and (ii) the second transition always corresponds to the selection of the ground mode, suggest to exploit this effect for controlling two-mode emission in a very robust way.
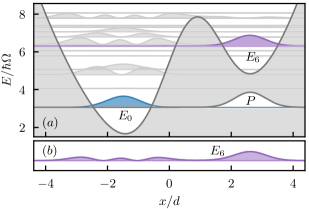
However, in Fig. 2 (b), we can observe that after the selection of the ground mode in a second transition, further transitions occur. In order to avoid that, and also to have a better control over both the selected modes and their threshold pump rates, let us now consider a structured cavity Dung et al. (2017) imposing a tilted double-well potential for the photons, . In the following we choose and , while is used as a tuning parameter. In Fig. 4(a) we depict the potential and the corresponding photon modes for together with the pump profile (white), projected onto the -axis. As in Fig. 1, the modes shown in color are those that get selected.
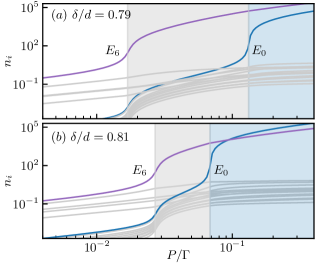
In Fig. 5(a) we present the mode populations versus pump power for the parameters of Fig. 4(a). The thermalization parameter is , while all the remaining parameters are the same as in the harmonic potential case. Since, essentially, we are only pumping the upper well, mode 6 (purple), having the lowest energy among those modes significantly overlapping with the pump spot, is selected first. The only other mode that gets selected at a higher is the ground mode (blue). Thus, by modifying the cavity structure, we have isolated the effect of lasing-assisted ground-state condensation from the selection of further modes.
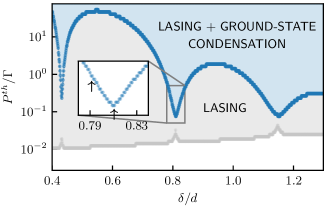
Figure. 5(b) shows the mode populations for the slightly larger parameter [for which the double well potential essentially looks the same as the one depicted in Fig. 4(a) for ]. Note that this small parameter change leads to a large change in the separation between the first and the second threshold value. This strong sensitivity is caused by the delocalization of the lasing mode (purple) over both wells [Fig. 4 (b)]. This is a result of the resonant coupling to a mode in the left well. As a result, the lasing-assisted creation of excited dye molecules in the left well is strongly enhanced and the second threshold to ground-state condensation happens at much lower pump rates. In Figure 6 we plot how the two threshold pump rates for lasing (gray curve) and ground-state condensation (blue curve) vary with . The two arrows indicate the cases shown in Fig. 5. One can clearly observe a sequence of resonances at which the second threshold is strongly reduced. Remarkably, these resonances can be used to control the second threshold value by almost four orders of magnitude. In contrast, the threshold for the first transition shows merely small peaks at the resonances, which are associated with a reduced overlap with the pump spot due to delocalization. Thus, by engineering the transverse potential for the photons in the cavity, one can widely tune the separation between the first and the second threshold.
We have shown that in a system of photons in a dye-filled cavity the interplay between driving (via gain and loss) and thermalization (via rovibrational relaxation of the dye molecules) can give rise to a robust mechanism for controlled two-mode emission. Namely, a transition to lasing in an excited cavity mode induced by an off-centered pump beam can trigger a second transition, where thermalization leads to the formation of a photon condensate in the ground mode. This mechanism can be made very robust and widely tuned by using a recently developed experimental technique for shaping the transverse potential for the photons in a trap.
Acknowledgements.
M.V. and A.E. acknowledge the support from the Deutsche Forschungsgemeinschaft (DFG) via the Research Unit FOR 2414 (under Project No. 277974659). H.A.M.L acknowledges financial support from the European Union FET-Open grant MIR-BOSE 737017 and from Provincia Autonoma di Trento.References
- Siegman (1986) A. E Siegman, Lasers (University Science Books, Mill Valley, Calif., 1986).
- Klaers et al. (2010a) Jan Klaers, Julian Schmitt, Frank Vewinger, and Martin Weitz, “Bose-Einstein condensation of photons in an optical microcavity,” Nature 468, 545–548 (2010a).
- Marelic and Nyman (2015) J. Marelic and R. A. Nyman, “Experimental evidence for inhomogeneous pumping and energy-dependent effects in photon Bose-Einstein condensation,” Phys. Rev. A 91, 033813 (2015).
- Weill et al. (2019) Rafi Weill, Alexander Bekker, Boris Levit, and Baruch Fischer, “Bose-Einstein condensation of photons in an erbium-ytterbium co-doped fiber cavity,” Nature Communications 10, 747 (2019).
- Rajan et al. (2016) Renju Rajan, P. Ramesh Babu, and K. Senthilnathan, “Photon condensation: A new paradigm for Bose-Einstein condensation,” Front. Phys. 11, 110502 (2016).
- Nyman and Walker (2018) Robert A. Nyman and Benjamin T. Walker, “Bose-Einstein condensation of photons from the thermodynamic limit to small photon numbers,” Journal of Modern Optics 65, 754–766 (2018).
- Walker et al. (2018) Benjamin T. Walker, Lucas C. Flatten, Henry J. Hesten, Florian Mintert, David Hunger, Aurélien A. P. Trichet, Jason M. Smith, and Robert A. Nyman, “Driven-dissipative non-equilibrium Bose-Einstein condensation of less than ten photons,” Nature Physics 14, 1173 (2018).
- Hesten et al. (2018a) Henry J. Hesten, Benjamin Walker, Robert A. Nyman, and Florian Mintert, “Collective excitation profiles and the dynamics of photonic condensates,” arXiv:1809.08774 [quant-ph] (2018a).
- Hesten et al. (2018b) Henry J. Hesten, Benjamin T. Walker, Robert A. Nyman, and Florian Mintert, “Non-critical slowing down of photonic condensation,” arXiv:1809.08772 [quant-ph] (2018b).
- Schmitt (2018) Julian Schmitt, “Dynamics and correlations of a Bose-Einstein condensate of photons,” J. Phys. B: At. Mol. Opt. Phys. 51, 173001 (2018).
- Keeling and Kirton (2016) Jonathan Keeling and Peter Kirton, “Spatial dynamics, thermalization, and gain clamping in a photon condensate,” Phys. Rev. A 93, 013829 (2016).
- Schmitt et al. (2015) Julian Schmitt, Tobias Damm, David Dung, Frank Vewinger, Jan Klaers, and Martin Weitz, “Thermalization kinetics of light: From laser dynamics to equilibrium condensation of photons,” Phys. Rev. A 92, 011602(R) (2015).
- Schmitt et al. (2016) Julian Schmitt, Tobias Damm, David Dung, Frank Vewinger, Jan Klaers, and Martin Weitz, “Bose-Einstein Condensation of Photons versus Lasing and Hanbury Brown-Twiss Measurements with a Condensate of Light,” Laser Spectroscopy , 85–96 (2016).
- Leymann et al. (2017) H. A. M. Leymann, D. Vorberg, T. Lettau, C. Hopfmann, C. Schneider, M. Kamp, S. Höfling, R. Ketzmerick, J. Wiersig, S. Reitzenstein, and A. Eckardt, “Pump-power-driven mode switching in a microcavity device and its relation to bose-einstein condensation,” Phys. Rev. X 7, 021045 (2017).
- Vorberg et al. (2018) Daniel Vorberg, Roland Ketzmerick, and André Eckardt, “Unified theory for excited-state, fragmented, and equilibriumlike bose condensation in pumped photonic many-body systems,” Physical Review A 97, 063621 (2018).
- Radonjić et al. (2018) Milan Radonjić, Wassilij Kopylov, Antun Balaž, and Axel Pelster, “Interplay of coherent and dissipative dynamics in condensates of light,” New J. Phys. 20, 055014 (2018).
- Schmitt et al. (2014) Julian Schmitt, Tobias Damm, David Dung, Frank Vewinger, Jan Klaers, and Martin Weitz, “Observation of Grand-Canonical Number Statistics in a Photon Bose-Einstein Condensate,” Phys. Rev. Lett. 112, 030401 (2014).
- Kirton and Keeling (2015) Peter Kirton and Jonathan Keeling, “Thermalization and breakdown of thermalization in photon condensates,” Phys. Rev. A 91, 033826 (2015).
- Stein et al. (2019) Enrico Stein, Frank Vewinger, and Axel Pelster, “Collective modes of a photon bose-einstein condensate with thermo-optic interaction,” arXiv:1906.06214 [cond-mat.quant-gas] (2019).
- Hesten et al. (2018c) Henry J. Hesten, Robert A. Nyman, and Florian Mintert, “Decondensation in Nonequilibrium Photonic Condensates: When Less Is More,” Phys. Rev. Lett. 120, 040601 (2018c).
- Dung et al. (2017) David Dung, Christian Kurtscheid, Tobias Damm, Julian Schmitt, Frank Vewinger, Martin Weitz, and Jan Klaers, “Variable potentials for thermalized light and coupled condensates,” Nature Photonics 11, 565–569 (2017).
- Kirton and Keeling (2013) Peter Kirton and Jonathan Keeling, “Nonequilibrium Model of Photon Condensation,” Phys. Rev. Lett. 111, 100404 (2013).
- McCumber (1964) D.E. McCumber, “Einstein relations connecting broadband emission and absorption spectra,” Physical Review 136, A954 (1964).
- Klaers et al. (2010b) Jan Klaers, Frank Vewinger, and Martin Weitz, “Thermalization of a two-dimensional photonic gas in a ‘white wall’ photon box,” Nature Physics 6, 512–515 (2010b).
- Moroshkin et al. (2014) Peter Moroshkin, Lars Weller, Anne Saß, Jan Klaers, and Martin Weitz, “Kennard-stepanov relation connecting absorption and emission spectra in an atomic gas,” Physical review letters 113, 063002 (2014).
- Vorberg et al. (2013) Daniel Vorberg, Waltraut Wustmann, Roland Ketzmerick, and André Eckardt, “Generalized Bose-Einstein Condensation into Multiple States in Driven-Dissipative Systems,” Phys. Rev. Lett. 111, 240405 (2013).
- Vorberg et al. (2015) Daniel Vorberg, Waltraut Wustmann, Henning Schomerus, Roland Ketzmerick, and André Eckardt, “Nonequilibrium steady states of ideal bosonic and fermionic quantum gases,” Physical Review E 92, 062119 (2015).