Evolution of Incommensurate Superstructure and Electronic Structure with Pb Substitution in (Bi2-xPbx)Sr2CaCu2O8+δ Superconductors
Abstract
High-quality Bi2-xPbxSr2CaCu2O8+δ (Bi2212) single crystals have been successfully grown by the traveling solvent floating zone technique with a wide range of Pb substitution (–0.8). The samples are characterized by transmission electron microscope (TEM) and measured by high resolution laser-based angle-resolved photoemission spectroscopy (ARPES) with different photon energies. A systematic evolution of the electronic structure and superstructure with Pb substitution has been revealed for the first time. The superstructure shows a significant change with Pb substitution and the incommensurate modulation vector (Q) decreases with increasing Pb substitution. In the meantime, the superstructure intensity from ARPES measurements also decreases dramatically with increasing Pb concentration. The superstructure in Bi2212 can be effectively suppressed by Pb substitution and it nearly disappears with a Pb substitution of . We also find that the superstructure bands in ARPES measurements depend sensitively on the photon energy of lasers used; they can become even stronger than the main band when using a laser photon energy of 10.897 eV. These results provide important information on the origin of the incommensurate superstructure and its control and suppression in bismuth-based high temperature superconductors.
I Introduction
High temperature cuprate superconductors have been extensively studied for more than thirty years due to its unusually high critical temperature (), unique normal state, and superconducting properties1 ; 2 ; 3 ; 4 ; 5 . The origin of the anomalous normal state and the high temperature superconductivity mechanism have not reached a consensus yet. Angle-resolved photoemission spectroscopy (ARPES)3 ; 6 ; 7 ; 8 has played a key role in studying the electronic structure of the cuprate superconductors, including revealing the distinct d-wave superconducting gap symmetry9 ; 10 ; 11 ; 12 , the existence of pseudogap11 ; 13 ; 14 ; 15 , and many-body effects16 ; 17 ; 18 ; 19 ; 20 ; 21 ; 22 ; 23 ; 24 ; 25 ; 26 . Bi2Sr2CaCu2O8+δ (Bi2212) system, owing to the availability of high quality single crystals and readiness in cleaving to get a clean and smooth surface, has long been the main workhorse to get these significant results by ARPES, as well as for scanning tunneling microscope/spectroscopy (STM/STS) measurements27 ; 28 ; 29 ; 30 ; 31 . However, it is well-known that bismuth-based cuprate superconductors have incommensurate modulations in their crystal structure along the direction32 ; 33 ; 34 ; 35 . This modulation gives rise to superstructure bands of various orders that significantly complicate the measured ARPES results, particularly near the important antinodal region36 ; 37 ; 38 ; 39 . A related issue under debate is about the origin of the superstructure bands: whether they are intrinsic that come from the CuO2 planes directly or extrinsic that are formed when the photoelectrons from CuO2 planes are diffracted by the BiO layers37 ; 38 . It has been found that Pb-substitution in Bi2212 can effectively suppress the incommensurate modulations40 ; 41 ; 42 and corresponding superstructure bands in ARPES43 ; 44 ; 45 ; 46 ; 47 . However, systematic study of the effect of Pb-substitution on the incommensurate modulation and electronic structure in Bi2212 is still lacking.
In this paper, we report the growth of a series of Pb-substituted Bi2-xPbxSr2CaCu2O8+δ (Pb-Bi2212) single crystals and investigations on the evolution of the superstructure and electronic structure with the Pb-substitution. High quality Bi2-xPbxSr2CaCu2O8+δ single crystals with various Pb contents (–0.8) are prepared by traveling solvent floating zone method. The crystal structure is characterized by transmission electron microscope (TEM) to directly determine the incommensurate modulation. The Pb-substitution effect on the electronic structure of Bi2212 is investigated by high resolution laser-based ARPES. We find that the superstructure bands in ARPES measurements exhibit strong photoemission matrix element effect; its intensity depends sensitively on the laser photon energy and can become even stronger than that of the main band. With increasing Pb-substitution in Bi2212, the incommensurate modulation vector (Q) of the superstructure decreases while the modulation strength also significantly weakens, giving rise to an overall suppression of the superstructure. Our results provide important information on the origin of the superstructure bands in ARPES measurements and on the tuning and control of the superstructure in Bi2212 superconductors.
II EXPERIMENT
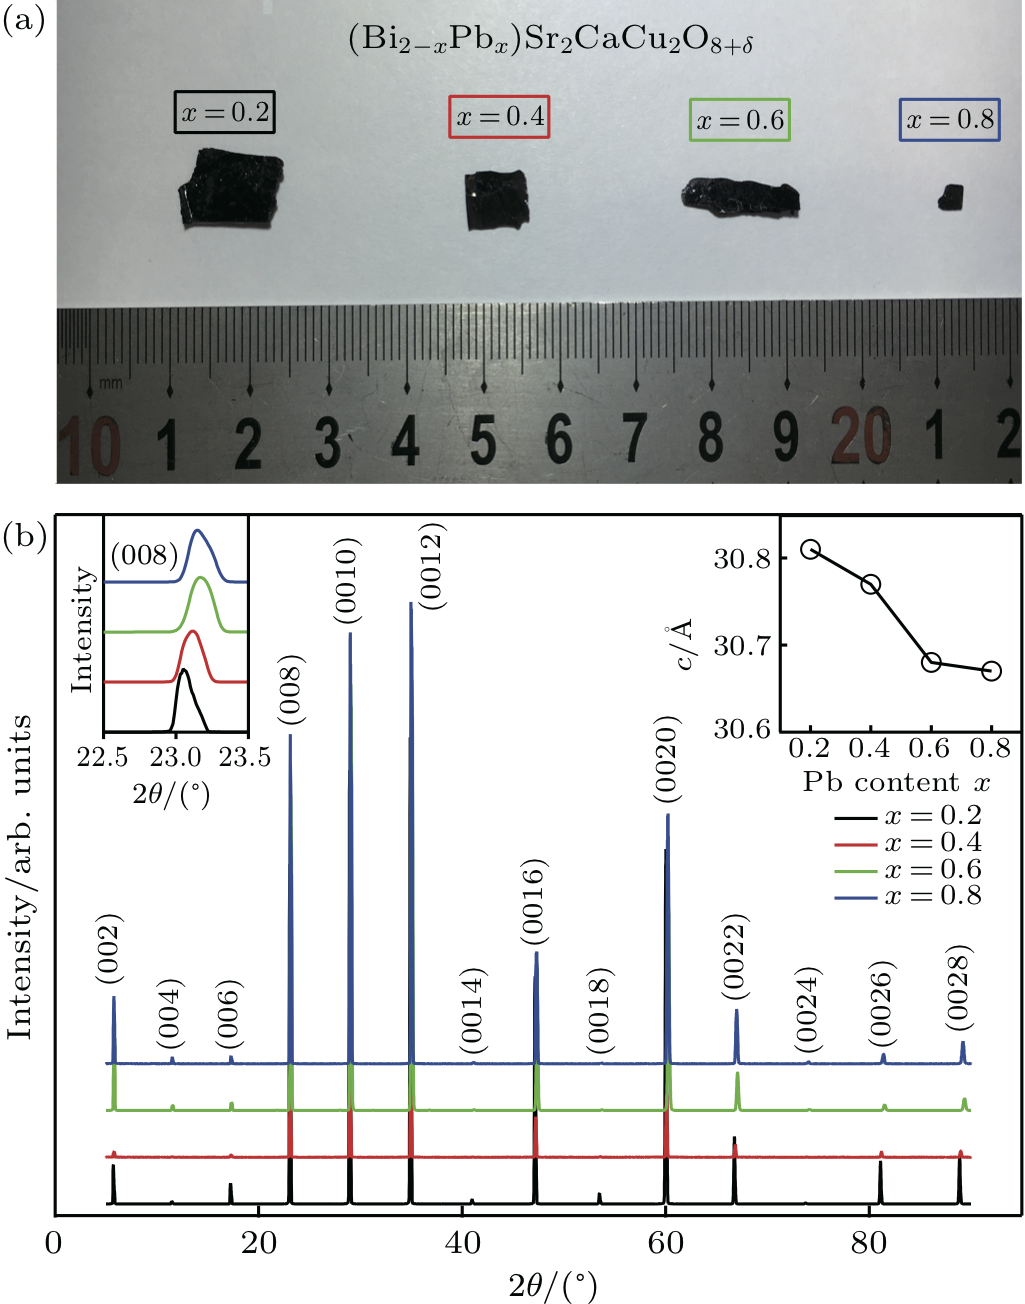
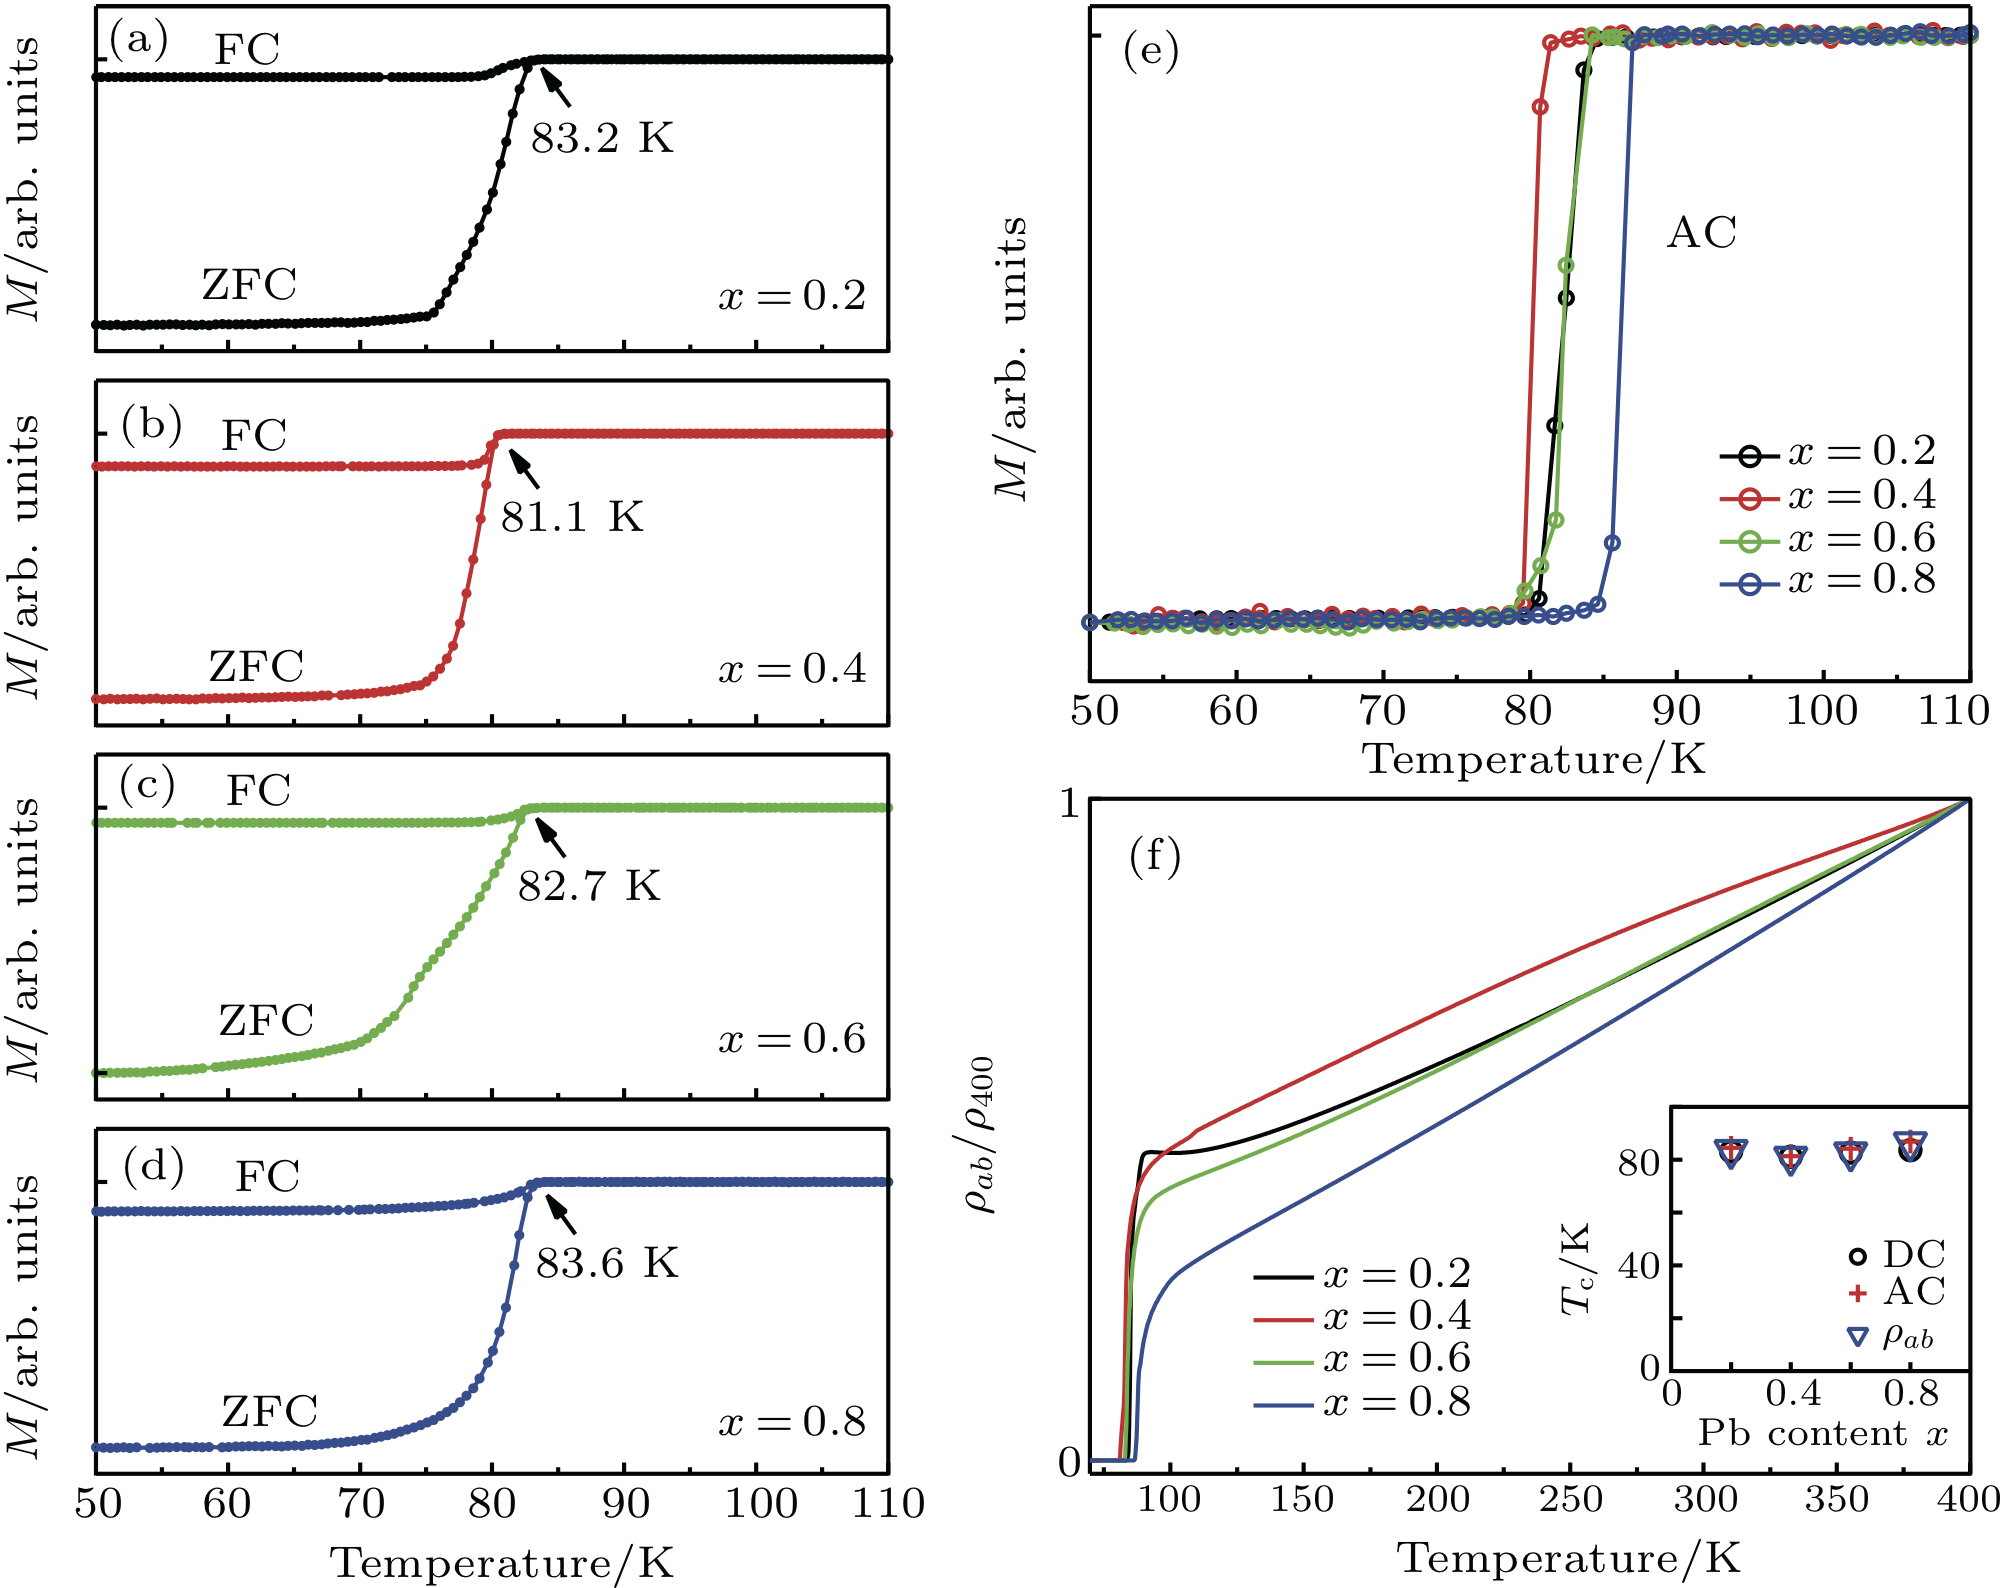
The Bi2.1(2.2)-xPbxSr2(1.8)CaCu2O8+δ single crystals were grown by the traveling solvent floating zone method using an infrared radiation furnace equipped with four 300 W halogen lamps48 . The nominal compositions and growth rate are summarized in Table 1. A fast growing rate (0.5 mm/h) was used in order to minimize the loss of Pb due to the high-volatility of PbO. The growth atmosphere was air. The typical size of the plate-like single crystals is about 5 mm6 mm except of the samples which is about 2 mm2 mm, as shown in Fig. 1(a). The real composition of the grown single crystals was determined by induction-coupled plasma atomic emission spectroscopy (ICP-AES) analysis and the results are listed in Table 1. The measured composition of the as-grown single crystals basically follows the nominal composition but the Pb content is slightly less due to the loss of Pb during the growth process. Compared with the stoichiometric formula of Bi2Sr2CaCu2O8+δ, for all the samples, Pb2+ not only substitutes at the Bi3+ site but also goes to the Sr2+ site that is consistent with previous Raman scattering studies42 . For convenience, we will denote our single crystal samples by using their nominal Pb concentrations. The crystal structure of the Pb-Bi2212 single crystals was characterized by x-ray diffraction (XRD) with Cu radiation ( Å). The results for four Pb-Bi2212 single crystals with different Pb contents are shown in Fig. 1(b). The temperature dependence of magnetization was measured using a Quantum Design MPMS XL-1 system with a low magnetic field of 1 Oe. Both field cooling (FC), zero field cooling (ZFC), and AC field were applied in order to get complementary information of their magnetization properties. The magnetic measurement results are shown in Figs. 2(a)–2(e). The temperature dependence of the in-plane resistivity was measured by using the standard four-probe method and the results are shown in Fig. 2(f). Electron diffraction and scanning transmission electron microscope (STEM) measurements were carried on by using JEM ARM200F TEM and the results are shown in Fig. 3.
High resolution angle-resolved photoemission measurements were performed by using a lab-based ARPES system equipped with 6.994 eV and 10.897 eV vacuum-ultra-violet (VUV) laser light sources and an angle-resolved time-of-flight electron energy analyzer (ARToF) with the capability of simultaneous two-dimensional momentum space detection8 ; 49 . One advantage of the ARToF analyzer is that it has much weaker non-linearity effect so that the measured signal is intrinsic to the sample. The energy resolution was set at 1 meV. The angular resolution was 0.1∘, corresponding to the momentum resolution of 0.002 Å-1 and 0.004 Å-1 at the photon energy of 6.994 eV and 10.897 eV, respectively. All the samples were cleaved in situ at low temperature of 25 K and measured in ultrahigh vacuum with a base pressure better than 310-11 mbar. The ARPES measurements were carried out with both 6.994 eV laser (Fig. 4) and 10.897 eV laser (Fig. 5). In both measurements (Figs. 4 and 5), the electric field vector of the incident laser was perpendicular to the nodal direction (–) of the measured Bi2212 sample. The Fermi level is referenced by measuring on clean polycrystalline gold that is electrically connected to the sample or reference to the nodal direction of Bi2212 superconductors where the superconducting gap is known to be zero.
III RESULTS and discussion
Figure 1(b) shows the XRD patterns for the four Pb-Bi2212 single crystals with different Pb contents. The measured surface is (001) – plane and all the observed peaks can be indexed to the (00) peaks of Bi2212, indicating a pure single-phase. The peaks are sharp, as exemplified by the (008) peaks in the top-left inset of Fig. 1(b) which have a width of 0.15∘ (full width at half maximum), indicating high crystallinity of the single crystals. The -axis lattice constant is calculated according to these XRD patterns. It exhibits a monotonic decrease with the increasing Pb content, as shown in the top-right inset of Fig. 1(b).
Figures 2(a)–2(d) show the temperature dependence of magnetization of Pb-Bi2212 single crystals with different Pb contents. All the Pb-Bi2212 samples show clear superconducting transition in both FC and ZFC measurement modes. The measured superconducting transition temperatures (onset) are marked for each of the samples in Figs. 2(a)–2(d) and plotted in the inset of Fig. 2(f). For the same four samples, we also measured their AC magnetic susceptibility, as shown in Fig. 2(e). The transition temperature measured by AC susceptibility (also plotted in the inset of Fig. 2(f)) is consistent with that measured by FC and ZFC methods but with much narrower transition width because the AC measurement is less sensitive to the residual magnetic field in the magnetic measurement system. The sharp superconducting transition (transition width of 1.5 K in Fig. 2(e)) indicates high quality of all the Pb-Bi2212 single crystals. The normalized in-plane resistivity of these as-grown Pb-Bi2212 single crystals with various Pb contents is shown in Fig. 2(f). They all exhibit metallic behaviors and the samples appear to get more metallic with increasing Pb content. The superconducting transition temperature obtained from the resistivity measurements (zero resistance temperature) is plotted in the inset of Fig. 2(f). It is clear that for all the four Pb-Bi2212 samples with different Pb contents, the measured s from DC magnetization (Figs. 2(a)–2(d)), AC magnetization (Fig. 2(e)), and resistivity measurements are in good agreement. It is also interesting to note that, although the actual Pb-substitution in these Pb-Bi2212 samples varies in a large range from 0.16 to 0.58 (Table 1), the superconducting transition temperature varies only in a very narrow range between 81 K and 84 K. Since the as-grown pristine Bi2Sr2CaCu2O8+δ is usually close to be optimally-doped48 , Pb2+ substitution into the Bi3+ site tends to introduce extra holes into the Bi2212 samples, these Pb-Bi2212 samples should be therefore in the overdoped region, which is also supported by our ARPES results (Fig. 5). In addition to the Pb-substitution effect, the doping level of the Bi2212 samples also depends on the oxygen content. Therefore, the nearly constant for the Pb-Bi2212 samples with different Pb contents may be attributed to similar hole doping level that results from the balance between Pb-substitution and oxygen content during the growth process.
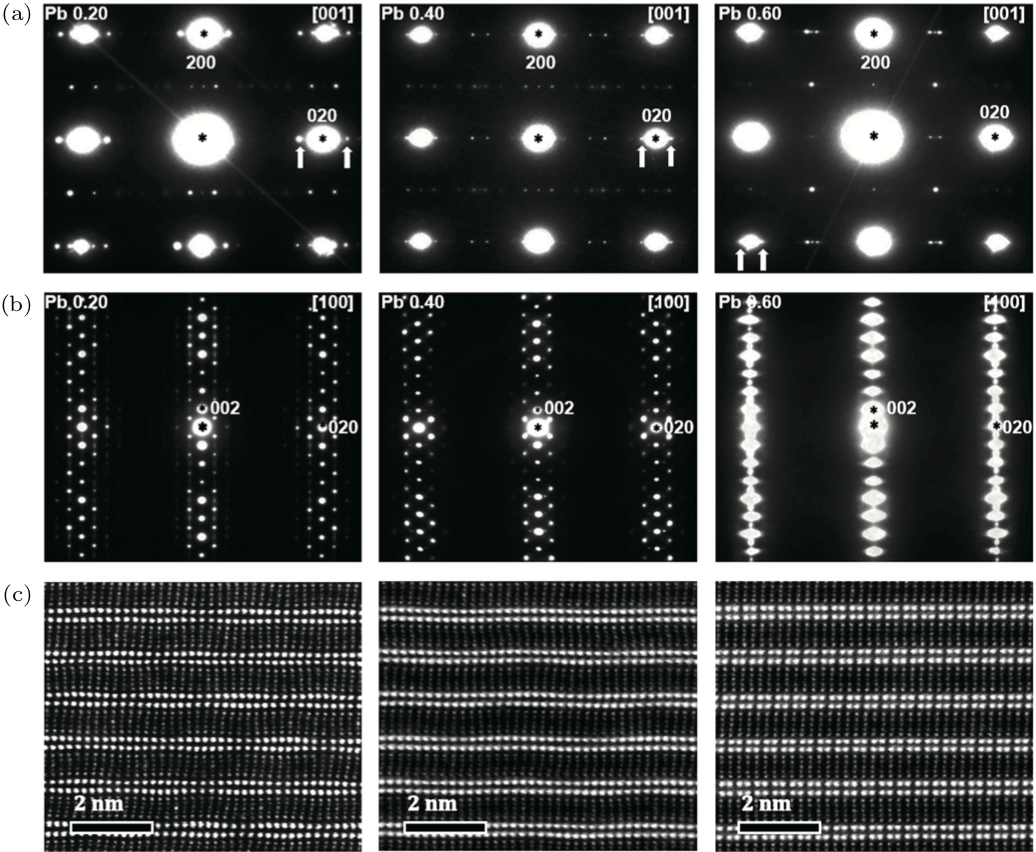
In order to investigate the crystal structure and the incommensurate modulations, systematic TEM studies were carried out on the series of Pb-Bi2212 samples. Figure 3(a) shows the electron diffraction results along the [001] zone-axis on Pb-Bi2212 samples with three typical Pb concentrations , 0.4, and 0.6. The diffraction patterns show clear satellite spots around the main diffraction spots, as marked by two arrows in and samples around the main (020) spot, which are formed due to the formation of superstructure along the direction. The satellite spot intensity relative to the main diffraction spots intensity and the distance of the two satellite spots along the direction are directly related to the modulation strength and the modulation period of the superstructure, respectively. With the Pb content increasing from to , the satellite spot intensity decreases and becomes nearly unresolvable in the sample. The distance between the two satellite spots decreases with the Pb content increasing from to . Similar results are observed in the diffraction patterns along the [100] zone-axis, as shown in Fig. 3(b). These results indicate that the superstructure in Bi2212 gets suppressed with Pb substitution by increasing the modulation period and decreasing the modulation strength. These can be more directly seen from the [100] zone axis STEM images in Fig. 3(c) where the BiO layers (bright horizontal double stripes), SrO layers, CuO2 layers, and Ca layers can all be clearly resolved. Clear modulation can be seen in the BiO layers along the horizontal direction in the sample (left panel of Fig. 3(c)). Such a modulation gets weaker in the sample (middle panel of Fig. 3(c)), and nearly invisible in the sample (right panel of Fig. 3(c)), consistent with the superstructure suppression with Pb substitution observed in electron diffractions (Figs. 3(a) and 3(b)). We also note by a close inspection of Fig. 3(c) that the incommensurate modulation exists not only in the BiO layers, but also in the SrO and CuO2 layers32 ; 50 .
The existence of the incommensurate modulations in Bi2212 gives rise to superstructure bands in the measured electronic structure, i.e., extra replica bands will be formed by shifting the original Fermi surface by , where Q is the vector of the incommensurate modulation and is the order of the superstructure bands36 ; 37 ; 38 ; 39 . Such an effect also renders ARPES as an alternative technique to detect the superstructure in Bi2212. To systematically investigate the evolution of superstructure with Pb substitution in Pb-Bi2212, we performed high-resolution ARPES measurements on a series of Pb-Bi2212 samples with different Pb contents.
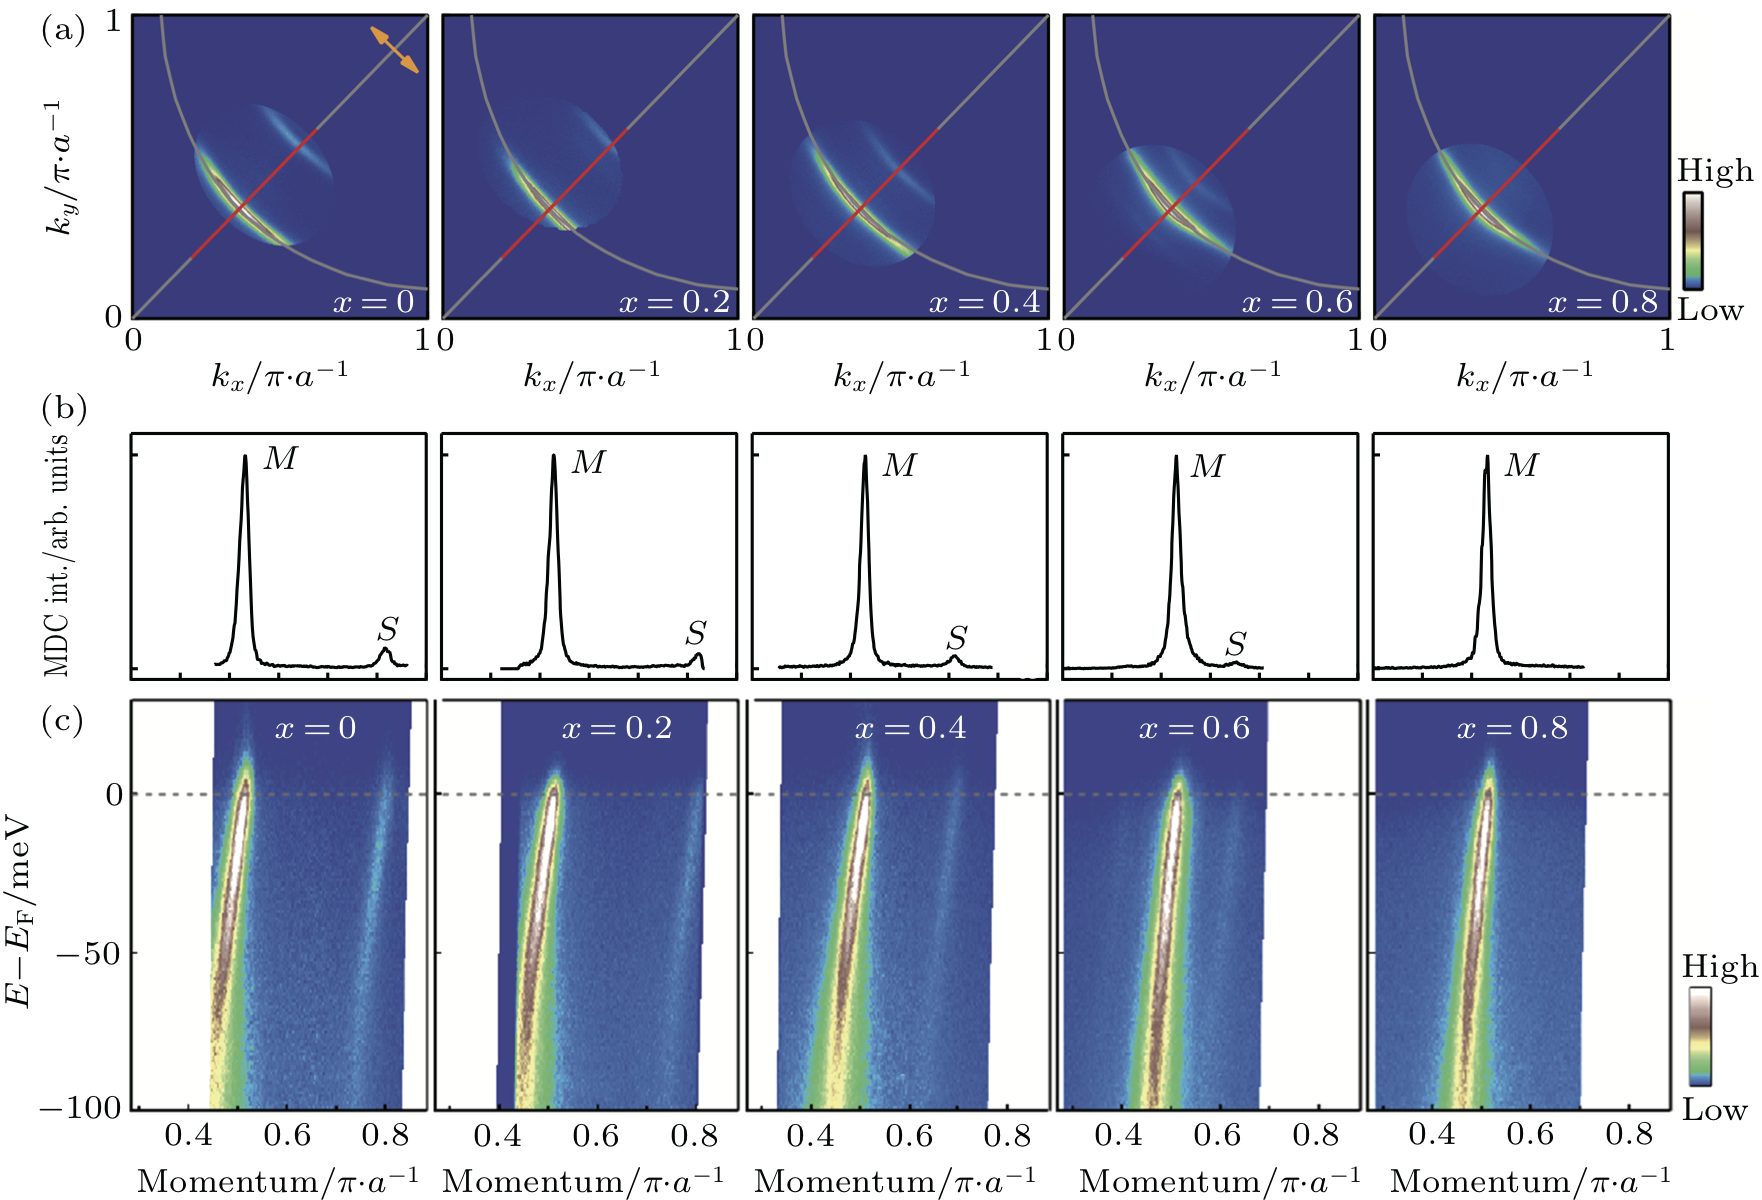
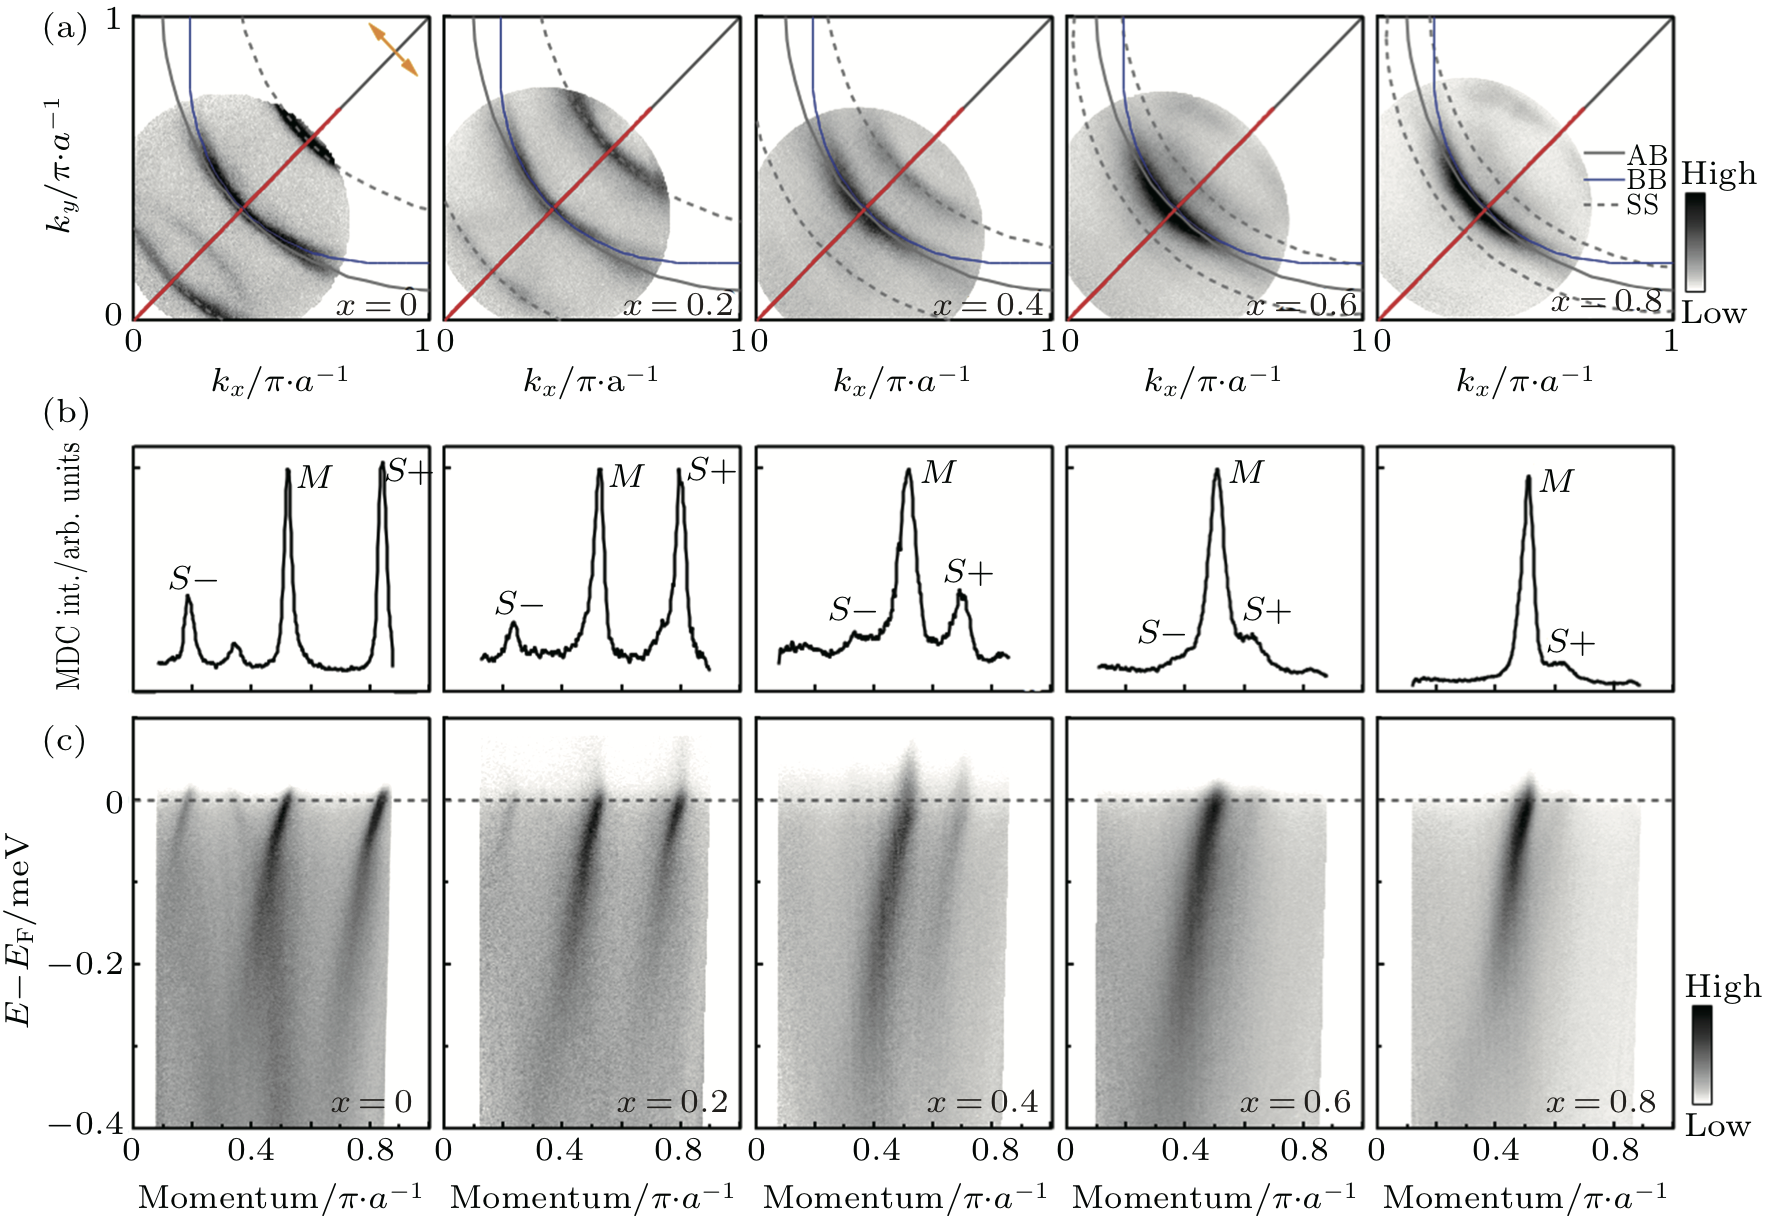
Figure 4 shows the Fermi surface and band structure of Pb-Bi2212 samples with five different Pb contents ranging from to measured at 25 K using 6.994 eV laser light source. With the capability to simultaneously cover the two-dimensional momentum space of our ARToF-based laser ARPES system, we can cover the main Fermi surface and the superstructure replica under the same experimental condition and obtain the measured data aligned precisely near the nodal region. This makes it possible to measure accurately the incommensurate modulation vector (Q) that is the momentum shift between the main Fermi surface and the first-order replica Fermi surface along the direction ((0,0)–(, ) diagonal direction in Fig. 4(a)). The strength of the structural modulation can also be measured by the intensity of the superstructure band relative to that of the main band. Clear superstructure Fermi surface is observed on the right side of the main Fermi surface in the sample, which represents the first-order () Fermi surface replica caused by the incommensurate modulation (left panel in Fig. 4(a)). With increasing Pb-substitution, the distance between the main Fermi surface and the superstructure Fermi surface gets smaller, accompanied by the intensity decrease of the superstructure Fermi surface. The superstructure Fermi surface becomes invisible in the sample (right panel in Fig. 4(a)). These results indicate the gradual suppression of the superstructure modulation with Pb-substitution which agrees well with the above TEM and STEM measurements (Fig. 3). In order to quantitatively determine the characteristics of the superstructure bands, we extracted the band structure along the nodal direction (locations of the momentum cuts are marked by red lines in Fig. 4(a)), as shown in Fig. 4(c) for these five Pb-Bi2212 samples. The corresponding momentum distribution curves (MDCs) at the Fermi level are shown in Fig. 4(b). The magnitude of the incommensurate modulation vector Q, determined from the distance between the M peak and S peak in each MDC, is plotted in Fig. 6(c). The intensity of the superstructure band, determined by the intensity of the peak area relative to the peak area, is plotted in Fig. 6(d).
Figure 5 shows Fermi surface mapping and band structure measurement on the Pb-Bi2212 samples with 10.897 eV laser photon energy. The larger photon energy makes it possible to simultaneously cover large momentum space, in this case, the superstructure Fermi surface sheets on both the left and right sides of the main Fermi surface are covered. Also both the antibonding band (grey solid line) and bonding band (blue solid line) are resolved due to the bilayer splitting in Bi221245 ; 51 . This observation further supports that all the Pb-Bi2212 samples are in the overdoped region because we did not observe bilayer splitting in optimally and underdoped Bi2212 under the same measurement condition. For comparison, we also measured pristine overdoped Bi2212 sample () with K that is obtained by annealing and has a similar as those of Pb-Bi2212 samples. Figure 5(c) shows the band structure along the nodal direction (the locations of the momentum cuts are shown in Fig. 5(a) by red lines) and the corresponding MDCs at the Fermi level are shown in Fig. 5(b). The superstructure band in the 10.897 eV laser ARPES measurement is significantly enhanced in intensity when compared with the 6.994 eV laser ARPES measurement (Fig. 4), which is due to the photoemission matrix element effect3 . The superstructure bands are comparable in intensity to the main band in the sample, and can become even stronger than the main band in the sample (Fig. 5(b)). This giant signal enhancement also makes it possible to detect the superstructure band even when it becomes rather weak. As seen in Fig. 5, the evolution of the superstructure band with the Pb substitution shows an overall agreement with that measured by 6.994 eV laser ARPES (Fig. 4), i.e., the modulation vector gets smaller and the intensity of the superstructure band gets weaker with increasing Pb substitution in Bi2212. However, in our present 10.897 eV ARPES measurement, the superstructure band is still visible in the sample, which is not resolvable in the 6.994 eV laser ARPES measurement. In the TEM measurements (Fig. 3), the superstructure becomes hard to resolve even in the sample. These results demonstrate that ARPES has provided an alternative, but more sensitive and quantitative measurement on the superstructure in Bi2212. Our 10.897 eV laser ARPES measurements indicate that the incommensurate modulation still survives in the sample although it has become significantly weakened and not resolvable in the TEM and 6.994 eV laser ARPES measurements.
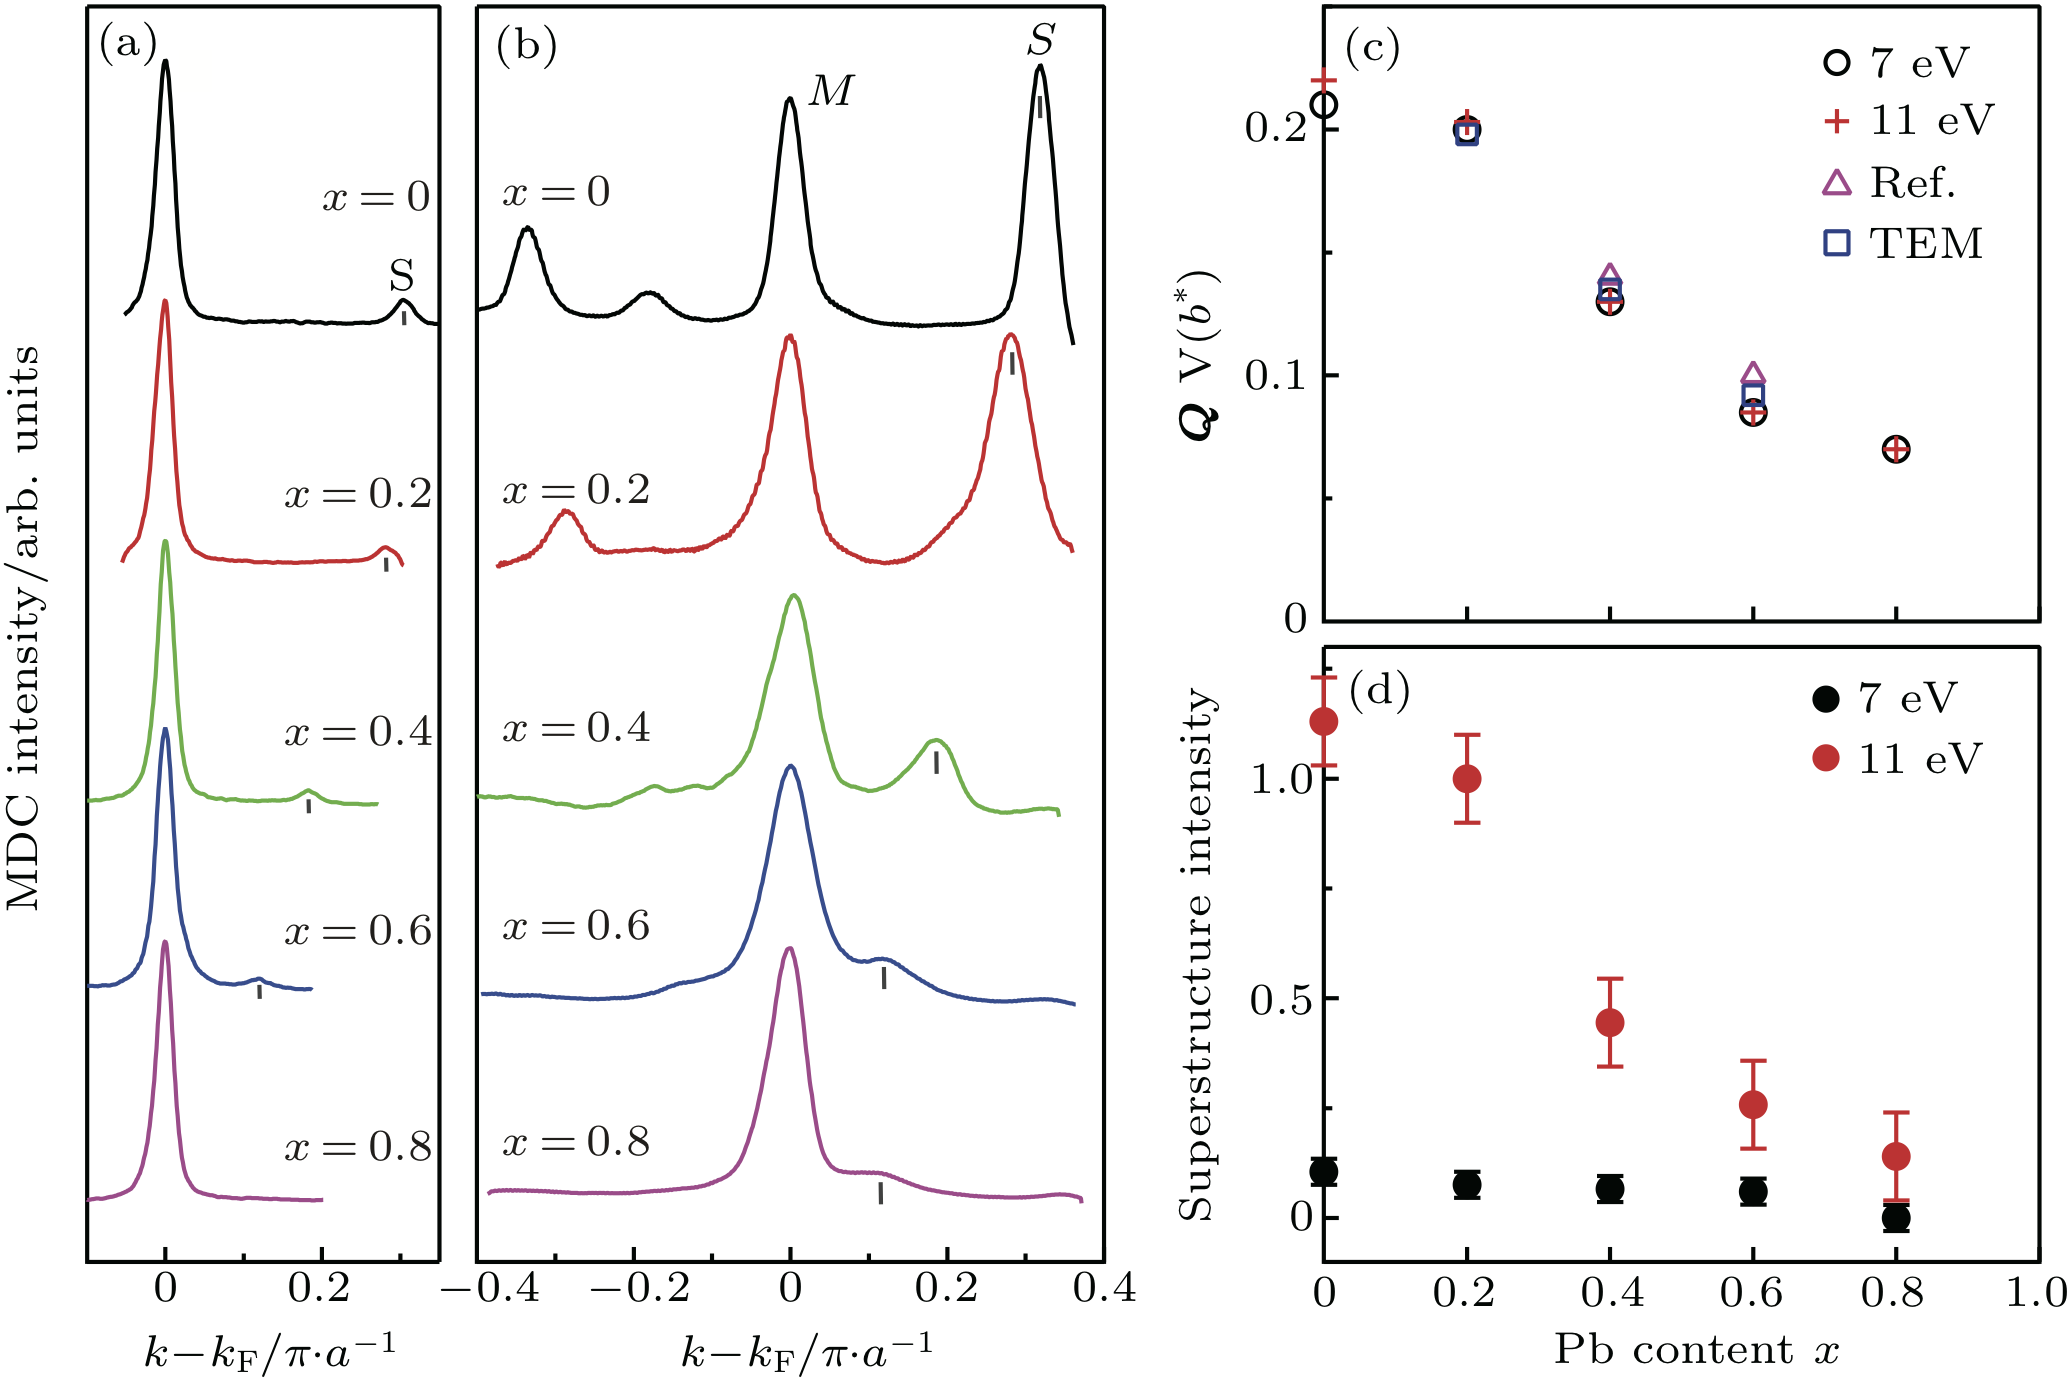
Figure 6 summarizes the main results on the superstructure evolution with Pb substitution in Pb-Bi2212 samples from the TEM and ARPES measurements. For a direct comparison, figures 6(a) and 6(b) show MDCs at the Fermi level along the nodal direction for the Pb-Bi2212 samples with different Pb contents measured using 6.994 eV and 10.897 eV laser photon energies, respectively. The position and intensity variation of the superstructure bands with the Pb substitution relative to the main band can be clearly seen. In particular, the intensity enhancement of the superstructure band in the 10.897 eV ARPES measurement becomes apparent compared to the 6.994 eV ARPES measurement. Figure 6(c) compiles the incommensurate modulation vector measured on Pb-Bi2212 samples by our TEM and ARPES measurements and previous TEM measurement40 which give consistent results. The modulation vector shows a monotonic decrease from (0.21, 0.21) for the pristine Bi2212 to (0.07, 0.07) for the sample. The superstructure band intensity, denoted by the area ratio between the superstructure peak and the main peak in MDCs (Figs. 6(a) and 6(b)), is shown in Fig. 6(d) for 6.994 eV and 10.897 eV ARPES measurements. It also falls monotonically with the increasing Pb substitution content although the intensity in the 10.897 eV measurement is significantly stronger than that in the 6.994 eV measurement.
It is under debate on the origin of the superstructure bands in Bi2212 in ARPES measurements, whether it is intrinsic that comes directly from the CuO2 planes or extrinsic that is formed when the photoelectrons from CuO2 planes get diffracted from the superstructure in the BiO layers37 ; 38 . Our present results provide more information on this issue and favors the former intrinsic scenario. If the superstructure band is produced by the diffraction of photoelectrons from CuO2 planes through the incommensurate modulation in BiO layers, the mechanism is similar to that of transmission electron microscope. In this case, as seen in the TEM diffraction patterns in Fig. 3, the diffracted signal is only a small fraction of the undiffracted transmitted signal. In terms of the diffraction model, one may think the photoelectrons from CuO2 planes as the TEM electron source, and the BiO layers as the TEM sample. It is difficult to understand how the superstructure band can become even stronger than the main band, as we observed in the 10.897 eV ARPES measurement on the Bi2212 sample (Fig. 5(a)). Furthermore, the relative intensity between the superstructure band and the main band should be insensitive to the photoelectron energy like the electron diffraction in TEM; this is obviously inconsistent with our results. We note that, since the photoelectrons from CuO2 planes must pass through other layers to get out of the sample, the superstructure modulation in BiO layers or other layers will play some role in diffracting the photoelectrons. But this diffraction effect cannot be dominant in producing the superstructure bands in Bi2212 superconductors.
The signal of the superstructure bands is more likely generated from the CuO2 planes themselves. From direct structural characterization (Fig. 3 and Ref. 50 ), there are modulations in the CuO2 planes with a periodicity that is similar to that in BiO layers. The modulation in this case has become an integral part of the CuO2 plane. First, the modulation will produce superstructure bands that are intrinsic to the CuO2 plane. Second, the intensity of the superstructure bands, as well as the main bands, can be affected by the photoemission matrix element effect3 . This can explain the photon energy dependence of the superstructure band intensity relative to the main band intensity, as we have observed. Since the photoemission matrix element is related to many factors like photon energy, photon polarization, and the energy and momentum of photoelectrons, this can also explain the intensity difference of the and superstructure bands (Fig. 5). This is consistent with the results that the relative intensity change of the main band and the shadow band in Bi2212 is strongly affected by the photoemission matrix element effects52 . Quantitative understanding of the results asks for further calculation of the photoemission matrix element effect by taking into account of the superstructure bands in Bi221253 .
Our systematic study of Pb substitution effect in Bi2212 can also shed some light on the formation mechanism of the superstructure in bismuth-based cuprate superconductors. Incommensurate modulation structure is common in bismuth-based cuprates due to lattice mismatch between different layers in the crystal structure. Several possible formation mechanisms have been proposed including doping effect, element substitution effect, and extra oxygen atoms in the BiO layers54 ; 55 . It has been found that, potassium deposition on the surface of Bi2212 can effectively vary the carrier doping level over a large range, but it has little effect on the superstructure band56 , thus ruling out the effect of doping effect on the superstructure formation in Bi2212. It is also found that, vacuum annealing of Bi2212 can vary its oxygen content as well as the doping level over a wide range, but the superstructure modulation does not show obvious change in the process57 . This can rule out the extra oxygens as the main factor in the formation of superstructure modulation in Bi2212. La can substitute Sr in the SrO layers in Bi2Sr2-xLaxCuO6+δ (La-Bi2201) over a wide range (–1.1), but it has little effect on the superstructure58 ; 59 . This indicates that the SrO layers do not play the dominant role in the superstructure formation in La-Bi2201. Pb substitution has been proven to be the most effective way so far in controlling the superstructure in Bi2212 and Bi220160 ; 61 ; 62 . Our present results have provided detailed information on the evolution of the superstructure with Pb substitution and proven the significant role in suppressing the superstructure by Pb substitution. According to the composition analysis in Table LABEL:table, Pb mainly substitutes into the Bi sites in the BiO layers although some of them can also goes into the Sr sites in the SrO layers. But the composition of Sr keeps nearly unchanged when the Pb content varies from 0.16 to 0.58. These results indicate that the Pb substitution in the BiO layers plays the dominant role in controlling the superstructure formation in the bismuth-based cuprate superconductors.
IV conclusion
In summary, by Pb substitution into the Bi2Sr2CaCu2O8+δ superconductors, we have prepared a series of Pb-Bi2212 single crystals with different Pb contents. The evolution of the superstructure in Pb-Bi2212 with Pb-substitution has been systematically studied by TEM and ARPES measurements. The superstructure gets suppressed with increasing Pb substitution, manifested by the decrease of the incommensurate modulation vector as well as the modulation strength. We also find that the superstructure band exhibits strong sensitivity to the laser photon energy used in the ARPES measurements. These results provide important information on the origin of the superstructure formation in ARPES measurements, and on the tuning and control of the superstructure in Bi2212 samples. These information will also facilitate future ARPES studies on bismuth-based superconductors by preparing ideal samples and selecting proper experimental conditions.
V Acknowledgments
This work is supported by the National Key Research and Development Program of China (Grant No. 2016YFA0300300 and 2017YFA0302900), the Strategic Priority Research Program (B) of the Chinese Academy of Sciences (Grant No. XDB07020300 and XDB25000000), the National Natural Science Foundation of China (Grant No. 11334010 and 11534007), and the Youth Innovation Promotion Association of CAS (Grant No. 2017013).
∗Corresponding author: LZhao@iphy.ac.cn, XJZhou@iphy.ac.cn.
References
- [1] Tsuei C C and Kirtley J R 2000 Rev. Mod. Phys. 72 969
- [2] Timusk T and Statt B 1999 Rep. Prog. Phys. 62 61
- [3] Damascelli A, Hussain Z and Shen Z X 2003 Rev. Mod. Phys. 75 473
- [4] Lee P A, Nagaosa N and Wen X G 2006 Rev. Mod. Phys. 78 17
- [5] Keimer B, Kivelson S A, Norman M R, Uchida S and Zaanen J 2015 Nature 518 179
- [6] Campuzano J C, Norman M R and Randeria M 2004 Physics of Superconductors (Berlin: Springer) Vol. 2 p. 167
- [7] Zhou X J, Cuk T, Devereaux T, Nagaosa N and Shen Z X 2007 Handbook of High Temperature Superconductivity: Theory and Experiment (Berlin: Springer) p. 87
- [8] Zhou X J, He S L, Liu G D, Zhao L, Yu L and Zhang W T 2018 Rep. Prog. Phys. 81 062101
- [9] Shen Z X, Dessau D S, Wells B O, King D M, Spicer W E, Arko A J, Marshall D, Lombardo L W, Kapitulnik A, Dickinson P, Doniach S, DiCarlo J, Loeser T and Park C H 1993 Phys. Rev. Lett. 70 1553
- [10] Ding H, Norman M R, Campuzano J C, Randeria M, Bellman A F, Yokoya T, Takahashi T, Mochiku T and Kadowaki K 1996 Phys. Rev. B 54 9678
- [11] Hashimoto M, Nowadnick E A, He R H, Vishik I M, Moritz B, He Y, Tanaka K, Moore R G, Lu D H, Yoshida Y, Ishikado M, Sasagawa T, Fujita K, Ishida S, Uchida S, Eisaki H, Hussain Z, Devereaux T P and Shen Z X 2015 Nat. Mater. 14 37
- [12] Sun X, Zhang W T, Zhao L, Liu G D, Gu G D, Peng Q J, Wang Z M, Zhang S J, Yang F, Chen C T, Xu Z Y and Zhou X J 2018 Chin. Phys. Lett. 35 017401
- [13] Marshall D S, Dessau D S, Loeser A G, Park C H, Matsuura A Y, Eckstein J N, Bozovic I, Fournier P, Kapitulnik A, Spicer W E and Shen Z X 1996 Phys. Rev. Lett. 76 4841
- [14] Loeser A G, Shen Z X, Dessau D S, Marshall D S, Park C H, Fournier P and Kapitulnik A 1996 Science 273 325
- [15] Ding H, Yokoya T, Campuzano J C, Takahashi T, Randeria M, Norman M R, Mochiku T, Kadowaki K and Giapintzakis J 1996 Nature 382 51
- [16] Bogdanov P V, Lanzara A, Kellar S A, Zhou X J, Lu E D, Zheng W J, Gu G, Shimoyama J I, Kishio K, Ikeda H, Yoshizaki R, Hussain Z and Shen Z X 2000 Phys. Rev. Lett. 85 2581
- [17] Johnson P D, Valla T, Fedorov A V, Yusof Z, Wells B O, Li Q, Moodenbaugh A R, Gu G D, Koshizuka N, Kendziora C, Jian S and Hinks D G 2001 Phys. Rev. Lett. 87 177007
- [18] Kaminski A, Randeria M, Campuzano J C, Norman M R, Fretwell H, Mesot J, Sato T, Takahashi T and Kadowaki K 2001 Phys. Rev. Lett. 86 1070
- [19] Lanzara A, Bogdanov P V, Zhou X J, Kellar S A, Feng D L, Lu E D, Yoshida T, Eisaki H, Fujimori A, Kishio K, Shimoyama J I, Noda T, Uchida S, Hussain Z and Shen Z X 2001 Nature 412 510
- [20] Zhou X J, Yoshida T, Lanzara A, Bogdanov P V, Kellar S A, Shen K M, Yang W L, Ronning F, Sasagawa T, Kakeshita T, Noda T, Eisaki H, Uchida S, Lin C T, Zhou F, Xiong J W, Ti W X, Zhao Z X, Fujimori A, Hussain Z and Shen Z X 2003 Nature 423 398
- [21] Gromko A D, Fedorov A V, Chuang Y D, Koralek J D, Aiura Y, Yamaguchi Y, Oka K, Ando Y and Dessau D S 2003 Phys. Rev. B 68 174520
- [22] Kim T K, Kordyuk A A, Borisenko S V, Koitzsch A, Knupfer M, Berger H and Fink J 2003 Phys. Rev. Lett. 91 167002
- [23] Cuk T, Baumberger F, Lu D H, Ingle N, Zhou X J, Eisaki H, Kaneko N, Hussain Z, Devereaux T P, Nagaosa N and Shen Z X 2004 Phys. Rev. Lett. 93 117003
- [24] Zhang W T, Liu G D, Zhao L, Liu H Y, Meng J Q, Dong X L, Lu W, Wen J S, Xu Z J, Gu G D, Sasagawa T, Wang G L, Zhu Y, Zhang H B, Zhou Y, Wang X Y, Zhao Z X, Chen C T, Xu Z Y and Zhou X J 2008 Phys. Rev. Lett. 100 107002
- [25] He J F, Zhang W T, Bok J M, Mou D X, Zhao L, Peng Y Y, He S L, Liu G D, Dong X L, Zhang J, Wen J S, Xu Z J, Gu G D, Wang X Y, Peng Q J, Wang Z M, Zhang S J, Yang F, Chen C T, Xu Z Y, Choi H Y, Varma C M and Zhou X J 2013 Phys. Rev. Lett. 111 107005
- [26] Bok J M, Bae J J, Choi H Y, Varma C M, Zhang W T, He J F, Zhang Y X, Yu L and Zhou X J 2016 Sci. Adv. 2 e1501329
- [27] Pan S H, O’Neal J P, Badzey R L, Chamon C, Ding H, Engelbrecht J R, Wang Z, Eisaki H, Uchida S, Guptak A K, Ng K W, Hudson E W, Lang K M and Davis J C 2001 Nature 413 282
- [28] Hoffman J E, Hudson E W, Lang K M, Madhavan V, Eisaki H, Uchida S and Davis J C 2002 Science 295 466
- [29] Kohsaka Y, Taylor C, Fujita K, Schmidt A, Lupien C, Hanaguri T, Azuma M, Takano M, Eisaki H, Takagi H, Uchida S and Davis J C 2007 Science 315 1380
- [30] Hamidian M H, Edkins S D, Joo S H, Kostin A, Eisaki H, Uchida S, Lawler M J, Kim E A, Mackenzie A P, Fujita K, Lee J and Davis J C S 2016 Nature 532 343
- [31] Fischer O, Kugler M, Maggio-Aprile I, Berthod C and Renner C 2007 Rev. Mod. Phys. 79 353
- [32] Gao Y A N, Lee P, Coppens P, Subramania M A and Sleight A W 1988 Science 241 954
- [33] Eibl O 1991 Physica C 175 419
- [34] Heinrich H, Kostorz G, Heeb B and Gauckler L J 1994 Physica C 224 133
- [35] Withers R L, Thompson J G, Wallenberg L R, Fitz Gerald J D, Anderson J S and Hyde B G 1988 J. Phys. C 21 6067
- [36] Aebi P, Osterwalder J, Schwaller P, Schlapbach L, Shimoda M, Mochiku T and Kadowaki K1994 Phys. Rev. Lett. 72 2757
- [37] Osterwalder J, Aebi P, Schwaller P, Schlapbach L, Shimoda M, Mochiku T and Kadowaki K 1995 Appl. Phys. A 60 247
- [38] Ding H, Bellman A F, Campuzano J C, Randeria M, Norman M R, Yokoya T, Takahashi T, KatayamaYoshida H, Mochiku T, Kadowaki K, Jennings G and Brivio G P 1996 Phys. Rev. Lett. 76 1533
- [39] Fretwell H M, Kaminski A, Mesot J, Campuzano J C, Norman M R, Randeria M, Sato T, Gatt R, Takahashi T and Kadowaki K 2000 Phys. Rev. Lett. 84 4449
- [40] Chong I, Hiroi Z, Izumi M, Shimoyama J, Nakayama Y, Kishio K, Terashima T, Bando Y and Takano M 1997 Science 276 770
- [41] Fournier P, Kapitulnik A and Marshall A F 1996 Physica C 257 291
- [42] Kendziora C, Qadri S B and Skelton E 1997 Phys. Rev. B 56 14717
- [43] Schwaller P, Aebi P, Berger H, Beeli C, Osterwalder J and Schlapbach L 1995 J. Electron. Spectrosc. Relat. Phenom. 76 127
- [44] Legner S, Borisenko S V, Durr C, Pichler T, Knupfer M, Golden M S, Fink J, Yang G, Abell S, Berger H, Muller R, Janowitz C and Reichardt G 2000 Phys. Rev. B 62 154
- [45] Bogdanov P V, Lanzara A, Zhou X J, Kellar S A, Feng D L, Lu E D, Eisaki H, Shimoyama J I, Kishio K, Hussain Z and Shen Z X 2001 Phys. Rev. B 64 180505
- [46] Takeuchi T, Kaga H, Okada Y, Ikuta H, Baba T, Tsuda S and Shin S 2007 J. Electron. Spectrosc. Relat. Phenom. 156 452
- [47] Ziegler B, Muller B, Krapf A, Dwelk H, Janowitz C and Manzke R 2008 Phys. Rev. B 77 054520
- [48] Liu S Y, Zhang W T, Zhao L, Liu H Y, Wu Y, Liu G D, Dong X L and Zhou X J 2012 Chin. Phys. Lett. 29 087401
- [49] Zhang Y, Wang C L, Yu L, Liu G D, Liang A J, Huang J W, Nie S M, Sun X, Zhang Y X, Shen B, Liu J, Weng H M, Zhao L X, Chen G F, Jia X W, Hu C, Ding Y, Zhao W J, Gao Q, Li C, He S L, Zhao L, Zhang F F, Zhang S J, Yang F, Wang Z M, Peng Q J, Dai X, Fang Z, Xu Z Y, Chen C T and Zhou X J 2017 Nat. Commun. 8 15512
- [50] Guo C, Tian H F, Yang H X, Zhang B, Sun K, Sun X, Peng Y Y, Zhou X J and Li J Q 2017 Phys. Rev. Mater. 1 064802
- [51] Feng D L, Armitage N P, Lu D H, Damascelli A, Hu J P, Bogdanov P, Lanzara A, Ronning F, Shen K M, Eisaki H, Kim C, Shen Z X, Shimoyama J and Kishio K 2001 Phys. Rev. Lett. 86 5550
- [52] Mans A, Santoso I, Huang Y, Siu W K, Tavaddod S, Arpiainen V, Lindroos M, Berger H, Strocov V N, Shi M, Patthey L and Golden M S 2006 Phys. Rev. Lett. 96 107007
- [53] Bansil A and Lindroos M 1999 Phys. Rev. Lett. 83 5154
- [54] Zandbergen H W, Groen W A, Mijlhoff F C, Tendeloo G V and Amelinckx S 1988 Physica C 156 325
- [55] Gai P L and Day P 1988 Physica C 152 335
- [56] Zhang Y X, Hu C, Hu Y, Zhao L, Ding Y, Sun X, Liang A J, Zhang Y, He S L, Liu D F, Yu L, Liu G D, Dong X L, Gu G D, Chen C C, Xu Z Y and Zhou X J 2016 Sci. Bull. 61 1037
- [57] Zhong Y G, Chen Y M, Guan J Y, Zhao J, Rao Z C, Tang C Y, Liu H J, Sun Y J and Ding H 2018 Sci. China-Phys. Mech. Astron. 61 127403
- [58] Meng J Q, Liu G D, Zhang W T, Zhao L, Liu H Y, Lu W, Dong X L and Zhou X J 2009 Supercond. Sci. Technol. 22 045010
- [59] Chen Z, Peng Y Y, Wang Z, Song Y J, Meng J Q, Zhou X J and Li J Q 2013 Supercond. Sci. Technol. 26 055010
- [60] Chong I, Terashima T, Bando Y, Takano M, Matsuda Y, Nagaoka T and Kumagai K 1997 Physica C 290 57
- [61] Mao Z Q, Fan C G, Shi L, Yao Z, Yang L, Wang Y and Zhang Y H 1993 Phys. Rev. B 47 14467
- [62] Torardi C C, McCarron E M, Gai P L, Parise J B, Ghoroghchian J, Kang D B, Whangbo M H and Barry J C 1991 Physica C 176 347
Table 1. Nominal and measured compositions, growth condition, c-axis lattice constant and Tc(onset) of Pb-Bi2212 single crystals.
Nominal composition
Measured composition
Growth rate (mm/hour)
c (Å)
Tc(onset) (K)
0.5
30.81
83
0.5
30.78
81
0.5
30.68
83
0.5
30.67
84