All-optical quantum sensing of rotational Brownian motion of magnetic molecules
Abstract
Sensing local environment through the motional response of small molecules lays the foundation of many fundamental technologies. The information of local viscosity, for example, is contained in the random rotational Brownian motions of molecules. However, detection of the motions is challenging for molecules with sub-nanometer scale or high motional rates. Here we propose and experimentally demonstrate a novel method of detecting fast rotational Brownian motions of small magnetic molecules. With electronic spins as sensors, we are able to detect changes in motional rates, which yield different noise spectra and therefore different relaxation signals of the sensors. As a proof-of-principle demonstration, we experimentally implemented this method to detect the motions of gadolinium (Gd) complex molecules with nitrogen-vacancy (NV) centers in nanodiamonds. With all-optical measurements of the NV centers’ longitudinal relaxation, we distinguished binary solutions with varying viscosities. Our method paves a new way for detecting fast motions of sub-nanometer sized magnetic molecules with better spatial resolution than conventional optical methods. It also provides a new tool in designing better contrast agents in magnetic resonance imaging.
1 Introduction.
Characterizing local environments and capturing dynamical variations of local quantities can provide important information about physical and biological processes. In particular, detecting variations in molecules’ Brownian motions would yield information about particle size and local viscosity in biological sensing [1]. For example, the random rotations of small molecules can respond to environmental changes and reveal local dynamics and biological functions. Conventional optical microscopy methods are capable of measuring the rotational Brownian motions (RBM) of particles in the sub-micron scale or larger, using dark-field microscopy [2, 3], microrheological techniques based on particle’s anisotropy [4, 5] or fluorescence polarization spectroscopy [6]. However, it is very difficult to extend these techniques to the nanometer regime: the rotational motion of nanometer-size molecules is typically much smaller than the optical diffraction limit, therefore it cannot be directly captured; in addition, their motional rates are typically in the GHz range, which are beyond the detection rates of most optical techniques. To this end, an all-optical method capable of capturing the fast rotations is still lacking.
Quantum sensors [7] have recently emerged as a powerful tool to explore properties at the nanoscale. For example, nitrogen-vacancy (NV) color centers in diamond have shown the potential to study magnetic [8, 9, 10, 11] and electric [12] fields, temperature [13, 14, 15, 16], strain [17, 18, 19] and other quantities, displaying an exceptional sensitivity and spatial resolution even at room temperature, thanks to the control on their spin states. In particular, NV centers in nanodiamonds (NDs) have been employed to sense various properties [20, 21, 22, 23] that affect, and reveal, chemical and biological processes. NV centers in NDs have many favorable properties, ranging from very high photo- and thermal-stability, to bio-compatibility. All these desirable properties make NDs preferable over organic dyes in biosensing applications [24]. Furthermore, the size of NDs containing stable NV centers can reach down to just several nanometers [25], promising nanometer spatial resolution.
Here we propose a novel method that exploits the electronic spins of NV centers in NDs to detect the fast RBMs of sub-nanometer sized magnetic molecules, overcoming the limitations of conventional optical approaches. The key idea is that fast RBM rates modify the spectrum of the magnetic noise generated by the magnetic molecules, slowing down the relaxation of our spin sensors in a way analogous to motional narrowing in NMR [26]. The all-optical measurement of the relaxation rates of our spin sensors captures the RBMs of the target magnetic molecules, while providing a simple and accessible experimental technique. We point out that while we consider RBM of magnetic molecules here, this method can be extended to detect other molecules’ RBM by attaching magnetic labels to them.
We demonstrate this novel method in a proof-of-principle experiment. The longitudinal relaxation of NV centers in NDs is monitored in the presence of gadolinium (Gd) complex molecules, which are among the most commonly used contrast agents in magnetic resonance imaging (MRI). We observed a difference in the relaxation rate corresponding to changes in the RBM rate when varying the local viscosity, thus demonstrating the feasibility of the proposed method.
Conventionally, the rotational motion of Gd(III) complex molecules can be indirectly extracted from EPR spectra with nuclear magnetic relaxation dispersion (NMRD) analysis [27, 28, 29]. However, this technique not only entails demanding experimental conditions, but also it does not provide the complete picture of Gd molecules RBM. For example, the rotational correlation time obtained from proton’s or 17O’s relaxation measurements represents, instead of the rotation information for the whole molecule, the local rotational correlation time of specific bond vectors. Compared with the NMRD technique, our method is more robust as it measures the effective rotational motion rates of the whole molecule. Moreover, in principle, the spatial resolution is only limited by ND size, which is in the nanometer regime. The experimental apparatus is simpler, as NV centers allow all-optical initialization and readout, without the need for a strong external magnetic field. Finally, our method is fully compatible with microfluidic techniques, supporting study of RBM in living cells where sample volume is constrained. Our technique would then provide a versatile tool to understand the dynamics of magnetic molecules and design better contrast agents in (functional) MRI [29, 30, 31]. For instance, magnetic molecules with long rotational correlation times are usually preferred for higher relaxivity. Biologically relevant ligand coatings or bindings in synthesized magnetic nanoparticles could increase the particles’ size and therefore increase their relaxivity. The method we propose here provides an independent study of rotational correlation time and would be helpful in quantifying the performance of contrast agents.
2 Theoretical principle
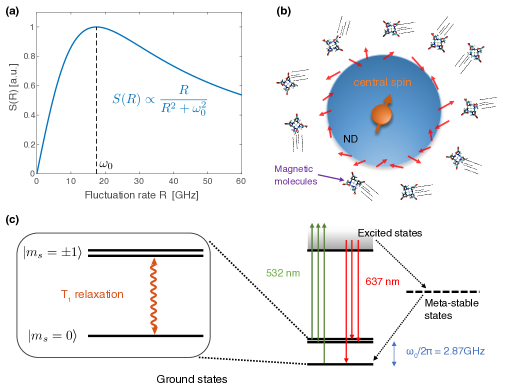
The fast RBMs of small magnetic particles contribute to high frequency fluctuations in the magnetic noise spectrum. This effect can be detected by nearby spins, whose relaxation times are sensitive to external magnetic noise. Counterintuitively, the added motion actually often lengthens the spin relaxation time. To understand how, consider a Lorentzian spectrum as a function of the noise fluctuation rate (Fig. 1.(a)). When the fluctuation rate is larger than the resonant frequency of the spin sensors , a further increase in fluctuation rate results in a smaller noise spectrum intensity at the spin resonance frequency. This effect is similar to motional narrowing in NMR [26], and leads to a longer relaxation time of the spin sensors.
To provide a more quantitative description, we analyze all the effects contributing to the longitudinal relaxation time T1. In the presence of magnetic particles, including paramagnetic impurities on the surface and in the surrounding solution, the T1 time of a single NV electronic spin is given by [21]:
| (1) |
where is the relaxation time of NV in bulk diamond and GHz the NV energy level splitting between the and states at zero external magnetic field. For each magnetic particle , is the gyromagnetic ratio; is the rms transverse magnetic noise strength (see the supplementary material [32]); and is the noise correlation time, the inverse of the noise fluctuation rate. As already mentioned, when , any further increase in results in longer T1.
As an example, we consider using T1 relaxation to detect the RBM of Gd(III) chelators. The total noise fluctuation rate from Gd(III) molecules is given by [8]:
| (2) |
where represents the dipolar interaction rates between Gd molecules, the intrinsic vibrational rate between the Gd ion’s vibrational energy levels, and the translational (rotational) Brownian motion rates. Variations in the fluctuation rate induce changes in the T1 signal decay time of NV electronic spins via Eq. (1). It is then possible to detect RBM and sense the local environment through T1 relaxometry of NV sensors in an all-optical fashion.
3 Experimental demonstration
Next, we demonstrate our proposed method in a proof-of-principle experiment. We use NDs hosting NV centers as sensors to detect the RBM rates of one type of Gd(III) complex, gadolinium 1,4,7,10-tetraazacyclododecane-N,N’,N”,N”’-tetraacetate (Gd-DOTA). At zero magnetic field, the NV center has an electronic spin-1 ground state with resonance frequency GHz (Fig. 1(c)). The spin can be optically polarized and read out with nm laser excitation. In the absence of laser illumination, the spin state population will reach its thermal equilibrium with a time scale T1.
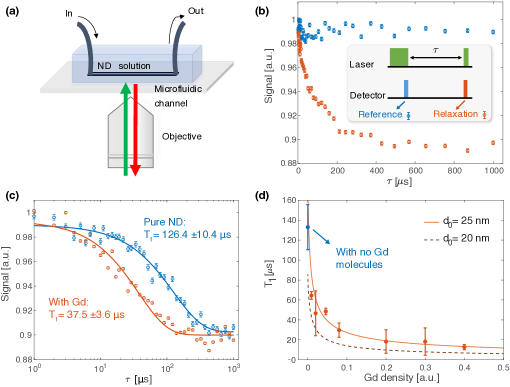
We measured this longitudinal relaxation time T1 of an ensemble of NV centers with a home-built confocal microscope at room temperature, without any applied external magnetic field. The NDs we used have an average size of around nm and are terminated with carboxyl groups. In the absence of Gd-DOTA, we measured a relaxation time of about s, which is significantly shorter than T1,bulk (typically a few ms, even in the presence of other bulk paramagnetic impurities). We attribute this difference to unpaired paramagnetic spins on the ND surface [33, 34, 35, 36]. The magnetic noise induced by these surface spins adds a new depolarization channel and yields a decrease in T1 according to Eq. (1). Based on this model, we can further deduce the surface spin density to be about 1 nm-2 [32]. The T1 relaxometry can then provide information in estimating surface spin densities of ND samples.
We first show the strong T1 quenching effect induced by Gd molecules in the solution. According to Eq. (1), the presence of Gd molecules will induce a strong magnetic noise in addition to that arising from the surface spins, and significantly increase the sensor’s spin relaxation rate . We prepared solutions of NDs and varying densities of Gd-DOTAs, and measured the corresponding T1 of the NV centers. Higher densities of Gd-DOTA molecules lead to stronger magnetic noise thus larger T1 quenching ratio. The experimental results quantitatively match our theoretical predictions if we assume a higher Gd density than the average density in solution (Fig. 2). This is likely due the tendency of Gd molecules to accumulate close to the bottom of the microfluidic channel. Since we measured NV spins at this location, this accumulation yields higher Gd density close to detection spots than the average concentration in the solution. Then, as the sensors only detect the local rather than global averaged environment, they see an effective higher Gd molecule density.
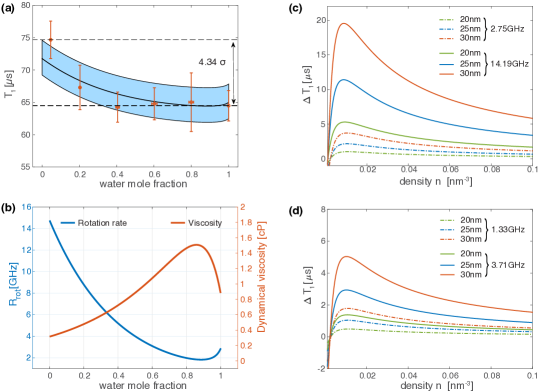
We next show the capability of detecting the RBMs of Gd-DOTA molecules with our sensors. In particular, we are interested in demonstrating the ability to distinguish variations in the magnetic particle fluctuation rates due to changes in the solution viscosity. We dissolved a fixed density of Gd-DOTA molecules in solutions with varying concentrations of water and acetone. Varying the ratio between water and acetone in the binary solution changes the local viscosity felt by Gd-DOTA molecules. We perform T1 relaxation measurements by loading the sample in a microfluidic channel to mimic biological environment, while preventing the binary solution from quickly evaporating. We observed a clear difference (4.34 ) in the measured T1 times for pure water with respect to (nearly) pure acetone (Fig. 3 (a)). To understand more quantitatively these results, we develop an analytical model of the RBM rate in our experiments.
The RBM of a molecule is influenced by its local viscosity. For a molecule with hydrodynamic radius in a solvent of viscosity and molecular radius , the RBM rate is expressed by the Stokes-Einstein equation [27, 29]:
| (3) |
Here is the microviscosity factor that takes into account the discrete nature of solvent molecules [27, 37]. As we can see, a lower viscosity corresponds to faster motions, with a RBM rate as large as GHz in our experiment. We plot in in Fig. 3 (b) the dynamical viscosity and the expected RBM rate of Gd-DOTA. The RBM rate of Gd-DOTA molecules varies between around to GHz in our water-acetone binary solution: This large range is attributed to the contrast in viscosities as well as different molecule sizes of water and acetone. Since due to the large contribution, we expect longer relaxation time of the NV sensors for higher RBM rates, as seen in Fig. 3 (a).
We further verified that our assumption that the microviscosity factor is essential to describe the RBM of the (nanoscale) Gd-DOTA molecules is correct. We compared the estimated RBM rate using Eq. (3), either with and without the microviscosity factor (Fig. 3 (c,d)), and found the predicted RBM rate with the microviscosity factor agrees better with experimental results (Fig. 3 (a)). This matches our expectation, since the discrete nature of solvent molecules should come into play when sub-nanometer sized Gd-DOTA molecules are concerned. Finally, from the experimental data and considering a variation in Gd molecule density, we estimate that the RBM rate of Gd molecules in nearly pure acetone is GHz, consistent with the GHz calculated from Eq. 3 at room temperature.
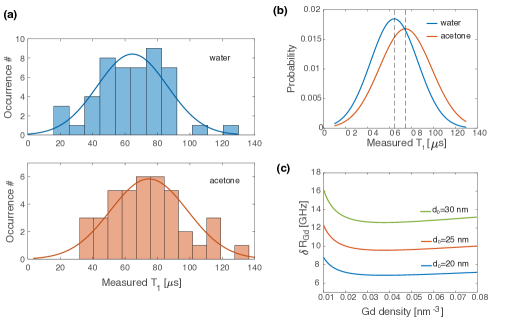
Since our measurements were performed with an ensemble of NDs, one concern was the inhomogeneous density distribution of Gd molecules when one changes solutions. To investigate this issue, we compared the distribution of relaxation times of spatially separated sensing spots for the water and nearly pure acetone cases. As one can see in Fig. 4 (a), the two distributions spread broadly, which might be a result of the spatial inhomogeneity of Gd molecule density or spatially varying local charge environments (see next section). Nevertheless, the two distributions are clearly distinct form each other, as shown in Fig. 4 (b), with Gaussian fittings. This further demonstrates that our relaxation measurements can distinguish different RBM rates influenced by local viscosities.
4 Discussions
To quantify the performance of our proposed method, we can estimate the minimal detectable value of the total magnetic noise fluctuation rate per unit time, for a single NV center located at the center of a single ND. We find
| (4) |
where is the detection window, the photon counting rate, and the contrast. In our experiments we have a detection window ns. We assume a signal contrast and a photon counting rate counts/s for a single NV. At optimized Gd density (corresponding to total Gd fluctuation rate GHz), we get a sensitivity of =6.9 (9.6) GHz for a single ND with diameter =20 (25) nm in a s data acquisition time, as presented in Fig. 4 (c). Note that here the calculation only takes the photon shot-noise into consideration, as it is the main source of detection noise.
To extend our method to single NV measurements, which can yield superior spatial resolutions, we need to have well-characterized NV centers with spatially homogeneous distributed magnetic molecules around them. In addition, the charge state conversion between NV- and undesired NV0 states should be well characterized. Indeed, the charge conversion rate might vary both due to different chemical solutions and across NV centers, thus masking the real relaxation differences. As we averaged over many NDs, this was not a main concern here. We point out that this issue can be addressed by characterizing or mitigating the charge instabilities beforehand with the use, for example, of additional lasers to control the photoionization process, or microwave control to better select the NV- dynamics [38, 39, 40].
We note that the presence of carboxyl termination group on the surface of NDs might naturally compete and interact with the DOTA chelators. Careful surface treatment should be performed to reduce this effect and increase the colloidal stability of NDs to make the technique more suitable for practical applications. For example, fluorination of NDs can suppress detrimental hydrophobic interactions and make NDs’ aqueous solution colloidally stable [41, 42]. The method we proposed here is capable of determining the RBM rate (thus viscosity and particle hydrodynamic size) and, subject to careful evaluations of all assumptions in our model [32], we can turn our qualitatively measurements into quantitative ones, while improving the sensitivity. Future studies that independently determine particle accumulation in the microfluidic channel could also help improve the performance of our sensor.
We have shown that, in the context of quantum sensing, the T1 relaxometry provides a versatile tool to detect the RBM rate changes in response to variations of local environments. At the same time, we point out that the relation between sensor relaxation and rate variation can be employed in MRI techniques, where the fluctuation rates of contrast agents (usually magnetic molecules such as Gd(III) chelators) are modulated to increase their relaxivity and improve their performance [29].
5 Conclusions
In conclusion, we proposed a novel method to detect the rotational Brownian motion of nanometer-sized magnetic particles, and experimentally demonstrated the protocol using NV centers in nanodiamonds. The technique is capable of detecting fast rotation (GHz-rate) of magnetic molecules with size down to sub-nanometer scale. The experiment is fully optical, requiring no microwave control or any external magnetic field. Our quantum sensing technique provides a new way of extracting local viscous information with high spatial resolution, and could also contribute to the design of contrast agents for MRI.
Acknowledgements
We thank Tingtao Zhou and Yixiang Liu for fruitful discussions, Liyuan Zhang and Yinan Shen for help with DLS measurement and Kurt Broderick for assistance with the fabrication of microfluidic channels. This work was supported in part by the U.S. Army Research Office through Grants No. W911NF-11-1-0400 and No. W911NF-15-1-0548. DL acknowledges financial support from the German Research Foundation (DFG) with a postdoctoral fellowship.
References
- [1] Diandra L. Leslie‐Pelecky Vinod Labhasetwar. Biomedical Applications of Nanotechnology. John Wiley & Sons, 2007.
- [2] Hiroshi Ueno, So Nishikawa, Ryota Iino, Kazuhito V. Tabata, Shouichi Sakakihara, Toshio Yanagida, and Hiroyuki Noji. Simple dark-field microscopy with nanometer spatial precision and microsecond temporal resolution. Biophysical Journal, 98(9):2014 – 2023, 2010.
- [3] Hiroshi Isojima, Ryota Iino, Yamato Niitani, Hiroyuki Noji, and Michio Tomishige. Direct observation of intermediate states during the stepping motion of kinesin-1. Nature Chemical Biology, 12:290 EP –, 02 2016.
- [4] Z. Cheng and T. G. Mason. Rotational diffusion microrheology. Phys. Rev. Lett., 90:018304, Jan 2003.
- [5] Y. Han, A. M. Alsayed, M. Nobili, J. Zhang, T. C. Lubensky, and A. G. Yodh. Brownian motion of an ellipsoid. Science, 314(5799):626–630, 2006.
- [6] Tina L. Mann and Ulrich J. Krull. Fluorescence polarization spectroscopy in protein analysis. Analyst, 128:313–317, 2003.
- [7] C. L. Degen, F. Reinhard, and P. Cappellaro. Quantum sensing. Rev. Mod. Phys., 89:035002, July 2017.
- [8] S. Steinert, F. Ziem, L. T. Hall, A. Zappe, M. Schweikert, N. Götz, A. Aird, G. Balasubramanian, L. Hollenberg, and J. Wrachtrup. Magnetic spin imaging under ambient conditions with sub-cellular resolution. Nature Communications, 4:1607 EP –, 03 2013.
- [9] M. Pelliccione, B. A. Myers, L. M. A. Pascal, A. Das, and A. C. Bleszynski Jayich. Two-dimensional nanoscale imaging of gadolinium spins via scanning probe relaxometry with a single spin in diamond. Phys. Rev. Applied, 2:054014, Nov 2014.
- [10] A. Ajoy, U. Bissbort, M. D. Lukin, R. L. Walsworth, and P. Cappellaro. Atomic-scale nuclear spin imaging using quantum-assisted sensors in diamond. Phys. Rev. X, 5:011001, Jan 2015.
- [11] Amila Ariyaratne, Dolev Bluvstein, Bryan A. Myers, and Ania C. Bleszynski Jayich. Nanoscale electrical conductivity imaging using a nitrogen-vacancy center in diamond. Nature Communications, 9(1):2406, 2018.
- [12] F. Dolde, H. Fedder, M. W. Doherty, T. Nobauer, F. Rempp, G. Balasubramanian, T. Wolf, F. Reinhard, L. C. L. Hollenberg, F. Jelezko, and J. Wrachtrup. Electric-field sensing using single diamond spins. Nat. Phys., 7(6):459–463, June 2011.
- [13] G. Kucsko, P. C. Maurer, N. Y. Yao, M. Kubo, H. J. Noh, P. K. Lo, H. Park, and M. D. Lukin. Nanometre-scale thermometry in a living cell. Nature, 500(7460):54–58, August 2013.
- [14] David M. Toyli, Charles F. de las Casas, David J. Christle, Viatcheslav V. Dobrovitski, and David D. Awschalom. Fluorescence thermometry enhanced by the quantum coherence of single spins in diamond. Proc. Nat. Acad. Sc., 110(21):8417–8421, 2013.
- [15] P. Neumann, I. Jakobi, F. Dolde, C. Burk, R. Reuter, G. Waldherr, J. Honert, T. Wolf, A. Brunner, J. H. Shim, D. Suter, H. Sumiya, J. Isoya, and J. Wrachtrup. High-precision nanoscale temperature sensing using single defects in diamond. Nano Letters, 13(6):2738–2742, 06 2013.
- [16] Ning Wang, Gang-Qin Liu, Weng-Hang Leong, Hualing Zeng, Xi Feng, Si-Hong Li, Florian Dolde, Helmut Fedder, Jörg Wrachtrup, Xiao-Dong Cui, Sen Yang, Quan Li, and Ren-Bao Liu. Magnetic criticality enhanced hybrid nanodiamond thermometer under ambient conditions. Phys. Rev. X, 8:011042, Mar 2018.
- [17] E. R. MacQuarrie, T. A. Gosavi, N. R. Jungwirth, S. A. Bhave, and G. D. Fuchs. Mechanical spin control of nitrogen-vacancy centers in diamond. Phys. Rev. Lett., 111:227602, Nov 2013.
- [18] J. Teissier, A. Barfuss, P. Appel, E. Neu, and P. Maletinsky. Strain coupling of a nitrogen-vacancy center spin to a diamond mechanical oscillator. Phys. Rev. Lett., 113(2), Jul 2014.
- [19] Péter Udvarhelyi, V. O. Shkolnikov, Adam Gali, Guido Burkard, and András Pályi. Spin-strain interaction in nitrogen-vacancy centers in diamond. Phys. Rev. B, 98:075201, Aug 2018.
- [20] Stefan Kaufmann, David A. Simpson, Liam T. Hall, Viktor Perunicic, Philipp Senn, Steffen Steinert, Liam P. McGuinness, Brett C. Johnson, Takeshi Ohshima, Frank Caruso, Jörg Wrachtrup, Robert E. Scholten, Paul Mulvaney, and Lloyd Hollenberg. Detection of atomic spin labels in a lipid bilayer using a single-spin nanodiamond probe. Proceedings of the National Academy of Sciences, 110(27):10894, 07 2013.
- [21] J. P. Tetienne, T. Hingant, L. Rondin, A. Cavaillès, L. Mayer, G. Dantelle, T. Gacoin, J. Wrachtrup, J. F. Roch, and V. Jacques. Spin relaxometry of single nitrogen-vacancy defects in diamond nanocrystals for magnetic noise sensing. Physical Review B, 87(23):235436–, 06 2013.
- [22] Torsten Rendler, Jitka Neburkova, Ondrej Zemek, Jan Kotek, Andrea Zappe, Zhiqin Chu, Petr Cigler, and Jörg Wrachtrup. Optical imaging of localized chemical events using programmable diamond quantum nanosensors. Nature Communications, 8:14701 EP –, 03 2017.
- [23] Ting Zhang, Gang-Qin Liu, Weng-Hang Leong, Chu-Feng Liu, Man-Hin Kwok, To Ngai, Ren-Bao Liu, and Quan Li. Hybrid nanodiamond quantum sensors enabled by volume phase transitions of hydrogels. Nature Communications, 9(1):3188, 2018.
- [24] Yi-Ren Chang, Hsu-Yang Lee, Kowa Chen, Chun-Chieh Chang, Dung-Sheng Tsai, Chi-Cheng Fu, Tsong-Shin Lim, Yan-Kai Tzeng, Chia-Yi Fang, Chau-Chung Han, Huan-Cheng Chang, and Wunshain Fann. Mass production and dynamic imaging of fluorescent nanodiamonds. Nat. Nanotech., 3(5):284–8, May 2008.
- [25] Julia Tisler, Gopalakrishnan Balasubramanian, Boris Naydenov, Roman Kolesov, Bernhard Grotz, Rolf Reuter, Jean-Paul Boudou, Patrick A. Curmi, Mohamed Sennour, Alain Thorel, Michael Borsch, Kurt Aulenbacher, Rainer Erdmann, Philip R. Hemmer, Fedor Jelezko, and Jorg Wrachtrup. Fluorescence and spin properties of defects in single digit nanodiamonds. ACS Nano, 3(7):1959–1965, 2009.
- [26] J.Mundy, S.Rothman, M.Fluss, and L.Smedskjaer. Solid State: Nuclear Methods. Academic Press, INC., 1983.
- [27] S. Rast, P. H. Fries, and E. Belorizky. Static zero field splitting effects on the electronic relaxation of paramagnetic metal ion complexes in solution. The Journal of Chemical Physics, 113(19):8724–8735, 2000.
- [28] Sebastian Rast, Alain Borel, Lothar Helm, Elie Belorizky, Pascal H. Fries, and AndréE. Merbach. Epr spectroscopy of mri-related gd(iii) complexes: Simultaneous analysis of multiple frequency and temperature spectra, including static and transient crystal field effects. Journal of the American Chemical Society, 123(11):2637–2644, 03 2001.
- [29] Andre S Merbach. The chemistry of contrast agents in medical magnetic resonance imaging. John Wiley & Sons, 2013.
- [30] Benjamin B. Bartelle, Ali Barandov, and Alan Jasanoff. Molecular fmri. Journal of Neuroscience, 36(15):4139–4148, 2016.
- [31] Satoshi Okada, Benjamin B. Bartelle, Nan Li, Vincent Breton-Provencher, Jiyoung J. Lee, Elisenda Rodriguez, James Melican, Mriganka Sur, and Alan Jasanoff. Calcium-dependent molecular fmri using a magnetic nanosensor. Nature Nanotechnology, 13(6):473–477, 2018.
- [32] See supplemental material for details.
- [33] Julia Tisler, Gopalakrishnan Balasubramanian, Boris Naydenov, Roman Kolesov, Bernhard Grotz, Rolf Reuter, Jean-Paul Boudou, Patrick A. Curmi, Mohamed Sennour, Alain Thorel, Michael Börsch, Kurt Aulenbacher, Rainer Erdmann, Philip R. Hemmer, Fedor Jelezko, and Jörg Wrachtrup. Fluorescence and spin properties of defects in single digit nanodiamonds. ACS Nano, 3(7):1959–1965, 07 2009.
- [34] Abdelghani Laraoui, Jonathan S. Hodges, and Carlos A. Meriles. Nitrogen-vacancy-assisted magnetometry of paramagnetic centers in an individual diamond nanocrystal. Nano Letters, 12(7):3477–3482, 07 2012.
- [35] S. B. Orlinskii, R. S. Bogomolov, A. M. Kiyamova, B. V. Yavkin, G. M. Mamin, S. Turner, G. Van Tendeloo, A. A. Shiryaev, I. I. Vlasov, and O. Shenderova. Identification of substitutional nitrogen and surface paramagnetic centers in nanodiamond of dynamic synthesis by electron paramagnetic resonance. Nanoscience and Nanotechnology Letters, 3(1):63–67, 2011.
- [36] Marc Dubois, Katia Guérin, Elodie Petit, Nicolas Batisse, André Hamwi, Naoki Komatsu, Jérôme Giraudet, Pascal Pirotte, and Francis Masin. Solid-state nmr study of nanodiamonds produced by the detonation technique. The Journal of Physical Chemistry C, 113(24):10371–10378, 2009.
- [37] P.H. Fries, E. Belorizky, N. Bourdin, F. Cinget, D. Gagnaire, W. Goreckic, M. Jeannin, and Ph. Vottero. The influence of molecular shape and charge distribution on the molecular approach in solution. nmr dipolar relaxation studies of the many-body effects. Journal of Molecular Structure: THEOCHEM, 330(1):335 – 345, 1995.
- [38] Dolev Bluvstein, Zhiran Zhang, and Ania C. Bleszynski Jayich. Identifying and mitigating charge instabilities in shallow diamond nitrogen-vacancy centers. Phys. Rev. Lett., 122:076101, Feb 2019.
- [39] N Aslam, G Waldherr, P Neumann, F Jelezko, and J Wrachtrup. Photo-induced ionization dynamics of the nitrogen vacancy defect in diamond investigated by single-shot charge state detection. New Journal of Physics, 15(1):013064, jan 2013.
- [40] Sinan Karaveli, Ophir Gaathon, Abraham Wolcott, Reyu Sakakibara, Or A. Shemesh, Darcy S. Peterka, Edward S. Boyden, Jonathan S. Owen, Rafael Yuste, and Dirk Englund. Modulation of nitrogen vacancy charge state and fluorescence in nanodiamonds using electrochemical potential. Proceedings of the National Academy of Sciences, 113(15):3938–3943, 2016.
- [41] Jan Havlik, Helena Raabova, Michal Gulka, Vladimira Petrakova, Marie Krecmarova, Vlastimil Masek, Petr Lousa, Jan Stursa, Hans-Gerd Boyen, Milos Nesladek, and Petr Cigler. Benchtop fluorination of fluorescent nanodiamonds on a preparative scale: Toward unusually hydrophilic bright particles. Advanced Functional Materials, 26(23):4134–4142, 2016.
- [42] Masfer H. Alkahtani, Fahad Alghannam, Linkun Jiang, Abdulrahman Almethen, Arfaan A. Rampersaud, Robert Brick, Carmen L. Gomes, Marlan O. Scully, and Philip R. Hemmer. Fluorescent nanodiamonds: past, present, and future. Nanophotonics, 7:1423–1453, 2018.
See pages 1- of GdRBM_support_arXiv.pdf