∎
School of Science
Low Temperature Laboratory
P.O. BOX 15100 FI-00076 Aalto, Finland
33email: tapio.riekki@aalto.fi
A. P. Sebedash 44institutetext: P. L. Kapitza Institute for Physical Problems RAS
Kosygina 2, 119334 Moscow, Russia
Thermal conductivity of superfluid 3He-B in a tubular channel down to 0.1Tc at the 4He crystallization pressure††thanks:
Abstract
We studied the thermal conductivity of superfluid 3He in a 2.5 mm effective diameter and 0.15 m long channel connecting the two volumes of our experimental assembly. The main volume contained pure solid 4He, pure liquid 3He and saturated liquid 3He–4He mixture at varying proportions, while the separate heat-exchanger volume housed sinter and was filled by liquid 3He. The system was cooled externally by a copper nuclear demagnetization stage, and, as an option, internally by the adiabatic melting of solid 4He in the main volume. The counterflow effect of superfluid just below the transition temperature resulted in the highest observed conductivity about five times larger than that of the normal fluid at the . Once the hydrodynamic contribution had practically vanished below , we first observed almost constant conductivity nearly equal to the normal fluid value at the . Finally, below about , the conductivity rapidly falls off towards lower temperatures.
Keywords:
Helium-3Helium-4Helium-3–Helium-4 mixture superfluid thermal conductivity1 Introduction
Thermal conductivity of superfluid 3He consists of two components: diffusive conductivity due to the quasiparticle motion, and hydrodynamic conductivity caused by the superfluid-normal fluid counterflow effect London1948 . The hydrodynamic conductivity is most important just below the superfluid transition temperature , as it requires the presence of the normal component, whose amount decreases exponentially with temperature. Diffusive conductivity has been discussed in a few theoretical publications Pethick1975 ; Pethick1977 ; Dorfle1980 ; Hara1981 , and has been measured using a heat-pulse method Wellard1982 ; Einzel1984 . Measurements of the total thermal conductivity have been made only on a narrow temperature span near the Greytak1973 ; Johnson1975 at a selection of pressures, and at a single point at the 3He crystallization pressure in the ballistic quasiparticle regime Feng1993 .
Our interest in the matter is related to our adiabatic melting experiment that aims to cool 3He and saturated 3He–4He mixture to ultra-low temperatures at the 4He crystallization pressure 2.564 MPa Adiabatic_Melting ; Sebedash_QFS . The method is capable of reaching temperatures below by melting solid 4He and mixing it with liquid 3He. At the lowest achievable temperatures, our quartz tuning fork thermometers become insensitive Riekki2019a , and a computational modeling of the system is required to evaluate the temperature. To carry out the simulation, we need good understanding of the thermal couplings within the system, of which one of the key components is the thermal conductivity of superfluid 3He. Also, the thermal boundary resistance between liquid helium and the cell wall, and between liquid and the sintered heat-exchanger are needed.
Our experimental setup provides a unique opportunity to map such intricate thermal parameters across a wide temperature range at various thermal loads, as the total heat capacity of the system can be varied by altering the amount of mixture in the system by changing the size of the 4He crystal. Temperatures from down to were reached by cooling the system by a nuclear demagnetization refrigerator, while temperatures below that were accessible by the adiabatic melting method. We were thus able to study the thermal conductivity of 3He down to the low temperature limit of our thermometry.
2 Thermal model
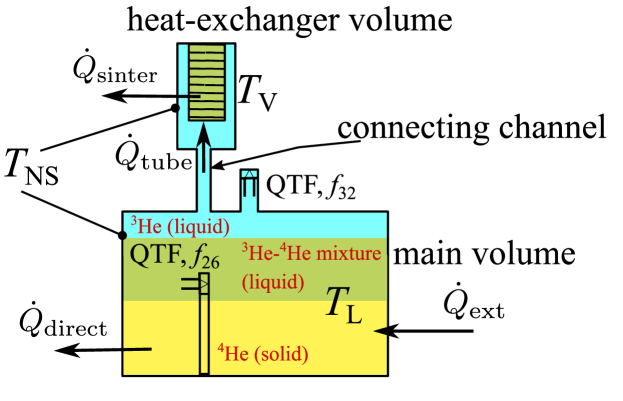
The experimental cell, shown schematically in Fig. 1, consisted of a main volume (), and a sinter-filled heat-exchanger volume (), connected together by a tubular channel Sebedash_QFS . The main volume was filled with pure solid 4He, saturated liquid 3He–4He mixture and pure liquid 3He at varying proportions, whereas the heat-exchanger volume and the connecting channel were always filled by pure 3He. There may have also been small amount of mixture trapped in the porous sinter. The main volume was monitored by two quartz tuning fork oscillators (QTFs): one situated in an extension at the top of the main volume to always keep it in the pure 3He phase, while the other was in the middle of the main volume, and thus in the mixture phase, or frozen in solid 4He, depending on the size of the 4He crystal. Additionally, our setup had a cold valve (not shown in Fig. 1) that could be used to restrict the channel, but it was kept open during the measurements described here. The cell was precooled by copper nuclear adiabatic demagnetization cooler, whose temperature was measured by a pulsed 195Pt NMR thermometer.
There were two filling lines to the cell: a normal capillary attached to the heat-exchanger volume, and a superleak line to the main volume. The normal capillary was used to introduce 3He to the system, but after that it was blocked by solid helium, while the superleak line was usually open to a reservoir at about temperature, and to Kelvin-range environment from there on. The superleak line was a capillary filled with tightly packed metal-oxide powder, whose large impedance allows only superfluid flow. The crystallization pressure in porous materials is larger than in bulk, which is why the superleak can be used to transfer 4He to (or from) the cell at the bulk crystallization pressure to grow (or melt) the solid phase.
We have a univariant three-phase system, as solid 4He fixes the pressure to its crystallization pressure Pentti_Thermometry , while the presence of the pure 3He phase ensures that the mixture is at its saturation concentration Pentti_etal_solubility , leaving only temperature as a free variable. When the cell is cooled down, 3He becomes A-phase superfluid at Pentti_Thermometry , while the transition to the B-phase occurs at Greywall1986 .
During external cooling, heat flows from the main volume of the experimental cell () to the precooler () via two paths: directly through the plain cell wall, which becomes rather unimportant below the , and through the sinter of the heat-exchanger volume via the connecting channel. Due to better thermal connection to the precooler, the liquid in the heat-exchanger volume () follows temperature changes faster, while the main volume lags behind. This gives us an opportunity to evaluate the thermal conductivity of superfluid 3He in the connecting channel.
The Kapitza resistance from liquid helium to the cell wall and to the sinter are assumed to obey a power law
| (1) |
where is the surface area, while and are constants that depend on the temperature range and materials in question, as discussed in Refs. Voncken_sinter ; Busch1984 ; Oh1994 ; Castelijns1985 ; Riekki_long . We measured the sinter to have approximately surface area, while the cell wall area was estimated to be . In the following treatment we combine and into one parameter . Thus, the heat flow across the Kapitza resistance becomes
| (2) |
where and have different values for the sinter and the plain cell wall.
Pure 3He phase and the mixture phase in the main volume (L) are assumed to have uniform temperature, and thus the heat balance there reads
| (3) |
A dot above a symbol indicates derivative with respect to time . Here is the heat capacity of the liquid in the main volume, with and the amounts of 3He in the pure 3He phase and in the saturated 3He–4He mixture phase, respectively, while and are their heat capacities per mole of 3He, respectively. The first term on the right side is the heat absorbed (or released) when solid 4He is melted (or grown), Riekki2019 , where is the rate at which 3He is transferred between the liquid phases, and and are the entropies of pure 3He and saturated 3He–4He mixture per mole of 3He, respectively. Each , , and is a function of temperature, and they are as given by Ref. Riekki2019 (we assume that the heat capacity of pure solid 4He is negligibly small). Next, is the background heat leak to the main volume, while represents losses occurring when there is flow through the superleak line. Lastly, is the heat flowing to the precooler through the plain wall Kapitza bottleneck, given by Eq. (2), and is the heat leaving the main volume through the connecting channel for the heat-exchanger volume. During the precooling period, both and can be omitted, as solid 4He is neither grown nor melted. This applies to all cases considered in this paper.
Next, for the heat balance of the heat-exchanger volume (V), we get
| (4) |
where , is similar to the first term of Eq. (3), is the heat flowing to the precooler through the sinter Kapitza resistance, again given by Eq. (2), and is the heat coming from the main volume through the channel. Here includes liquid 3He in the connecting channel as well, but assumes, for simplicity, that the entire channel is at the same temperature as the heat-exchanger volume. Having the channel to be at would not modify the simulations notably, since the heat capacity of the small 3He amount in the channel is insignificant next to the heat capacity of the heat-exchanger volume. Note that can be non-zero due to the mixture trapped into the sinter. We estimated that the sinter can hold maximum of 7 mmol of 3He.
All the heat that is not transmitted through the cell wall must flow through the connecting channel to the heat-exchanger volume and then through the sinter to the precooler. The thermal resistance of the cylindrical channel is
| (5) |
where is the thermal conductivity of pure 3He, , and are the length and the effective diameter of the channel. In reality, the channel is not equally wide along its complete length, and thus 5–10% uncertainty in results. The heat flow through such channel is given by the integral
| (6) |
In the normal state of pure 3He, from Pentti_Thermometry , up to our range of interest (), its thermal conductivity follows dependence, with the coefficient interpolated from the data of Ref. Greywall1984 . But below the , the situation becomes more complicated, as the behavior of is not well established. We can proceed by first dividing the heat flow integral of Eq. (6) into above and below the parts, and then linearizing it below the . This is a valid course of action as long as the temperature of the heat-exchanger volume does not drop far below the until the main volume temperature is there as well. The integral of Eq. (6) may thus be written as
| (7) | ||||
where is the superfluid 3He thermal conductivity at the average channel temperature .
3 Results
The results presented here were obtained by analyzing 8 precools from about () to (), 9 low temperature precools between () and , as well as 5 warm-up periods after melting of solid 4He at temperatures below . The thermal transport parameters presented here were determined so that all those precools and warm-ups could be computationally reproduced within reasonable accuracy.
The challenge is that the three heat conduction paths, direct conduction through the plain cell wall, conduction through the connecting channel, and conduction through the sinter are intertwined, hence none of them can be determined truly independently. Fortunately, certain stages of the precool are more sensitive to one than the others. At the beginning of the precool, the temperature is so high that heat conduction through the surface of the main cell volume brings along a significant contribution to the total heat transfer, even if the surface of the cell is hundred times less than the surface area of the sinter. On the other hand, thermal conductivity of 3He in the connecting channel plays important role near the of the main cell volume, as its conductivity increases significantly due to the superfluid-normal fluid counterflow effect. The Kapitza resistance of the sinter is somewhat difficult to discern, since it contributes to the heat flow over the entire temperature range. However, it is effectively decoupled from the main volume due to the relatively poor thermal conductivity along the connecting channel at temperatures well above the . The path through the channel and the sinter is overwhelmingly dominant anywhere below the , which was obviously intended, as the sole purpose of the sinter was to enable precooling the experimental cell to as far below as possible.

Further challenge is provided by the varying background heat leak to the main cell volume. This is mostly consequential at temperatures below 1 mK. We observed that it depended on whether the cold valve was filled with liquid helium or not, and if there had been flow through the superleak recently. In our analysis we have let it vary from to to make computations match with the experimental observations. The highest heat leak occurred when the magnetic field of the nuclear demagnetization stage was changing, while the maximum idle state heat leak was about . For each precool and post-melting warm-up period, we used a constant heat leak value.
The procedure used to resolve the thermal conductivity of 3He below the is illustrated in Fig. 2. First, we solve differential Eqs. (3) and (4) for , as the main volume temperature is known based on the QTF measurements, and the nuclear stage temperature from the PLM measurement. Throughout the measurement we kept a log of the amount of helium in the different phases to calculate the heat capacities at each stage. For the plain cell wall Kapitza resistance, we used the values and , determined by analyzing the precooling data near . The heat-exchanger volume Kapitza parameters on the other hand were and , which were determined at temperatures below by repeatedly growing or melting small amount of solid 4He to alter the heat capacity of the system, and studying how that changed the relaxation time of the system toward the precooler temperature. The detailed account of that analysis can be found in Ref. Riekki_long .
Heat transmitted through the channel, as evaluated from Eq. (3), depends on the derivative of the liquid helium temperature in the main volume. To reduce noise in , we averaged the QTF data over 7 to 20 min intervals, depending on the scatter of the data. Having , we can then solve from Eq. (7) as a function of the channel temperature . We have taken it to be the mean value between and , when both are below the , and the mean value between and when only the heat-exchanger volume is below the superfluid transition temperature.
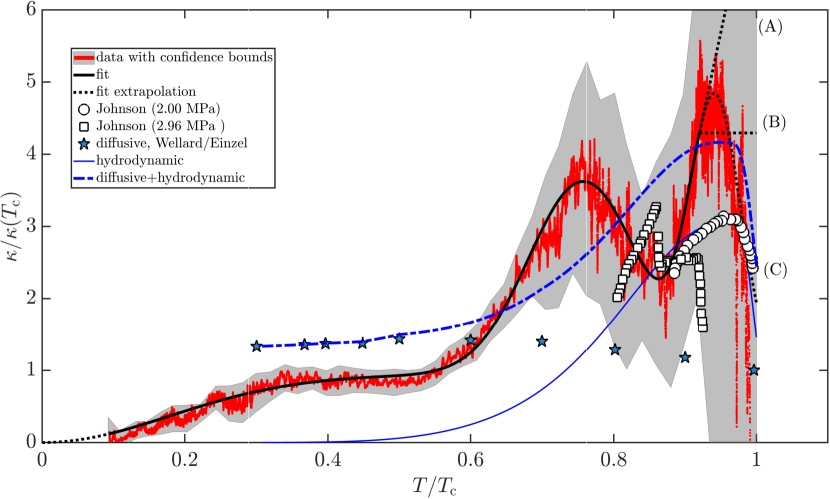
Figure 3 shows the resulting thermal conductivity, averaged across all analyzed precools and warm-ups. The confidence bounds include the measurement spread, as well as 10% uncertainty in the channel dimension parameter , and in the Kapitza constants and , and 5% uncertainty in the Kapitza exponents and . The solid black line indicates a fit to the experimental data of form , where is a Gaussian function, with , and listed in Table 1. Such an analytic form is handy for the model simulations.
The distinct features of our data are a plateau between and , and a local maximum at . As we approach the from below, the conductivity first decreases from the local maximum value until about after which it starts to increase again until about . Data-analysis near the was challenging due to two things. First, 3He usually undercooled slightly as we crossed the from above, i.e., temperature of the liquid was already below the but it was not yet in the superfluid state, and second, our QTF calibration formula changed at the from normal fluid viscosity dependent calibration Pentti_Rysti_Salmela to a phenomenological one. The combined effect of the changing calibration and undercooling of the liquid causes a small artificial jump in the temperature determined from the QTF frequency and width, which results in a large apparent derivative rendering our analysis inaccurate near the . As a further complication, at a certain range, we may have a situation, where the main volume is in A-phase of the superfluid while the heat-exchanger volume is already in the B-phase, and the A-B phase boundary can be somewhere in the channel causing unpredictable behavior in the determined thermal conductivity. With these issues acknowledged, we conclude that our analysis gives reasonable thermal conductivity data in the B-phase of 3He superfluid ().
| 1 | 2.68 | 0.76 | 0.11 |
|---|---|---|---|
| 2 | 0.94 | 0 | 0.25 |
| 3 | 3.76 | 0.94 | 0.05 |
Johnson et al. Johnson1975 reported anomalous thermal resistance behavior in the A-phase near the melting pressure of 3He. Their thermal resistance data, converted to thermal conductivity is included in Fig. 3 for comparison, showing roughly the same magnitude with our measurement. Their data is scaled by the normal fluid conductivity at the for each pressure ( at 2.00 MPa, at 2.96 MPa Greywall1984 ). Wellard et al. Wellard1982 studied the conductivity of superfluid 3He at 2.1 MPa down to by observing a time delay of a heat pulse between two vibrating wires, that was converted to diffusive conductivity by Einzel Einzel1984 as normalized to the normal fluid conductivity. Feng et al. Feng1993 determined area-scaled 3He thermal resistance 6.8 K m2/W in 3.6 mm long channel at 0.4 mK, at the 3He crystallization pressure. That corresponds to thermal conductivity of about , which is 5–16 times less than the conductivity determined from our measurement. Full correspondence between all the described data sets is not to be expected due to the different conditions in these experiments.
Near the we need to take into account the hydrodynamic thermal conductivity, which is given by London1948 ; Johnson1975
| (8) |
where is the diameter of the liquid column, and its viscosity, while cm3/mol Kollar200a is the molar volume of 3He at 2.564 MPa. We used the normalized viscosity data given by Einzel Einzel1984 with the normal fluid viscosity given by Ref. Pentti_Thermometry . It is evident that such a mechanism is needed to explain the efficient heat transfer close to the , but the hydrodynamic contribution alone falls off too quickly as the temperature decreases. The sum of diffusive and hydrodynamic conductivities shows fair resemblance to our data, while it still does not reproduce the local maximum at .
Figure 4 demonstrates how the main volume temperature is computationally reproduced using various 3He thermal conductivities of Fig. 3. It also shows another crucial element of our analysis, the heat-exchanger volume temperature calculated from the measured main volume temperature and the precooler temperature . Scatter in the data is due to the analysis procedure. We immediately note from the main panel that neither diffusive nor hydrodynamic conductivity alone can reproduce our observed data. The computed , with either, starts to severely lag behind as the heat-exchanger volume goes below the .
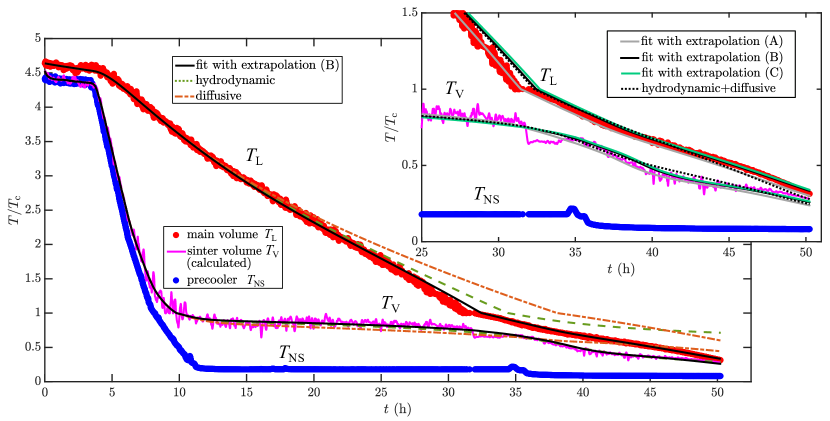
The analysis is problematic in the 3He-A region (from to ), as our treatment is not accurate there. Figure 3 shows three possible extrapolations of the measured data, and the inset of Fig. 4 illustrates the resulting difference. The option (A) with linearly increasing conductivity follows the measured data accurately above the main volume , but, from there downwards, it gives slightly too low temperatures. The opposite is true for the options (B) with constant conductivity, and (C) with the multi-Gaussian fit , as both lag slightly behind the measured temperature above the , but give better correspondence below it. The combined diffusive and hydrodynamic conductivities, based on data from the earlier publications, also reproduce the data with decent accuracy, except at the lowest temperatures. This makes sense as the combined conductivity is within the confidence bounds of our measurements until , below which it stays too high and thereby the computed main volume temperature would continue to decrease more rapidly than the measured temperature.
4 Conclusions
We have determined the thermal conductivity of superfluid 3He-B at the 4He crystallization pressure in a tubular channel connecting two volumes, larger of which contained solid pure 4He, liquid saturated 3He–4He mixture, and liquid pure 3He, while the smaller, sinter-filled heat-exchanger volume, had solely pure 3He (with possible traces of mixture within the sinter). The temperatures down to were covered during precooling the experimental cell externally by a copper nuclear demagnetization cooler, while the temperatures down to were reached by utilizing the internal adiabatic melting method and then observing the following warm-up. was also the low temperature limit of our quartz oscillator thermometry. A handicap in our setup was that we could not directly measure the temperature of the heat-exchanger volume, but instead we had to resolve it from our computational model. To improve the setup an additional quartz tuning fork should be installed there.
At the onset of the B-phase , we observed thermal conductivity 4.3 times larger than that of normal fluid 3He at the . Then, as the temperature was lowered, the conductivity showed a local minimum at (2.5 relative units) followed by a local maximum at (3.5). Between and we observed a plateau at about 1 relative units, below which a monotonically decreasing behavior was observed. At the plateau, our data indicated lower overall conductivity than the value obtained from earlier studies Wellard1982 ; Einzel1984 . We also showed that our measured temperature data was computationally reproducible using the determined thermal conductivity, meaning that the computational model can be used to estimate the lowest temperatures reached by the adiabatic melting method, when the quartz oscillator thermometer had become insensitive to temperature.
Acknowledgements.
This work was supported by the Jenny and Antti Wihuri Foundation Grant No. 00180313, and it utilized the facilities provided by Aalto University at OtaNano - Low Temperature Laboratory.———————
References
- (1) F. London, P.R. Zilsel, Phys. Rev. 74(9), 1148 (1948). DOI 10.1103/physrev.74.1148
- (2) C.J. Pethick, H. Smith, P. Bhattacharyya, Phys. Rev. Lett. 34(11), 643 (1975). DOI 10.1103/physrevlett.34.643
- (3) C.J. Pethick, H. Smith, P. Bhattacharyya, Phys. Rev. B 15(7), 3384 (1977). DOI 10.1103/physrevb.15.3384
- (4) M. Dorfle, H. Brand, R. Graham, J. Phys. C 13(18), 3337 (1980). DOI 10.1088/0022-3719/13/18/004
- (5) J. Hara, J. Low Temp. Phys. 43(5-6), 533 (1981). DOI 10.1007/bf00115614
- (6) N. Wellard, P. Alexander, H. Hall, J. Hook, Physica B+C 109-110, 2096 (1982). DOI 10.1016/0378-4363(82)90248-0
- (7) D. Einzel, J. Low Temp. Phys. 54(5-6), 427 (1984). DOI 10.1007/bf00683612
- (8) T.J. Greytak, R.T. Johnson, D.N. Paulson, J.C. Wheatley, Phys. Rev. Lett. 31(7), 452 (1973). DOI 10.1103/physrevlett.31.452
- (9) R.T. Johnson, R.L. Kleinberg, R.A. Webb, J.C. Wheatley, J. Low Temp. Phys. 18(5-6), 501 (1975). DOI 10.1007/bf00116140
- (10) Y.P. Feng, P. Schiffer, D.D. Osheroff, J. Low Temp. Phys. 90(5-6), 475 (1993). DOI 10.1007/bf00683612
- (11) A.P. Sebedash, J.T. Tuoriniemi, S.T. Boldarev, E.M.M. Pentti, A.J. Salmela, J. Low Temp. Phys. 148, 725 (2007). DOI 10.1007/s10909-007-9443-5
- (12) A. Sebedash, S. Boldarev, T. Riekki, J. Tuoriniemi, J. Low Temp. Phys 187, 588 (2017). DOI 10.1007/s10909-017-1755-5
- (13) T.S. Riekki, J. Rysti, J.T. Makinen, A.P. Sebedash, V.B. Eltsov, J.T. Tuoriniemi, J. Low Temp. Phys. 196(1–2), 73 (2019). DOI 10.1007/s10909-018-02141-y
- (14) E. Pentti, J. Tuoriniemi, A. Salmela, A. Sebedash, J. Low Temp. Phys. 146(1/2), 71 (2007). DOI 10.1007/s10909-006-9267-8
- (15) E.M. Pentti, J.T. Tuoriniemi, A.J. Salmela, A.P. Sebedash, Phys. Rev. B 78, 064509 (2008). DOI 10.1103/PhysRevB.78.064509
- (16) D.S. Greywall, Phys. Rev. B 33(11), 7520 (1986). DOI 10.1103/physrevb.33.7520
- (17) A.P.J. Voncken, D. Riese, L.P. Roobol, R. Konig, F. Pobell, J. Low Temp. Phys. 105(1/2), 93 (1996). DOI 10.1007/BF00754629
- (18) P. Busch, S. Cheston, D. Greywall, Cryogenics 24(8), 445 (1984). DOI 10.1016/0011-2275(84)90021-3
- (19) G.H. Oh, Y. Ishimoto, T. Kawae, M. Nakagawa, O. Ishikawa, T. Hata, T. Kodama, S. Ikehata, J. Low Temp. Phys. 95(3-4), 525 (1994). DOI 10.1007/bf00751787
- (20) C.A.M. Castelijns, K.F. Coates, A.M. Guénault, S.G. Mussett, G.R. Pickett, Phys. Rev. Lett. 55(19), 2021 (1985). DOI 10.1103/physrevlett.55.2021
- (21) T.S.Riekki, A.P. Sebedash, J.T. Tuoriniemi, arXiv:1911.06083 (2019)
- (22) T.S. Riekki, A.P. Sebedash, J.T. Tuoriniemi, Phys. Rev. B 99(5) (2019). DOI 10.1103/physrevb.99.054502
- (23) D.S. Greywall, Phys. Rev. B 29(9), 4933 (1984). DOI 10.1103/physrevb.29.4933
- (24) E. Pentti, J. Rysti, A. Salmela, A. Sebedash, J. Tuoriniemi, J. Low Temp. Phys. 165(3-4), 132 (2011). DOI 10.1007/s10909-011-0394-5
- (25) M. Kollar, D. Vollhardt, Phys. Rev. B 61(22), 15347 (2000) DOI 10.1103/physrevb.61.15347