Structural and magnetic properties of co-sputtered Fe0.8C0.2 thin films
Abstract
We studied the structural and magnetic properties of thin films deposited by co-sputtering of Fe and C targets in a direct current magnetron sputtering (dcMS) process at a substrate temperature () of 300, 523 and 773 K. The structure and morphology was measured using x-ray diffraction (XRD), x-ray absorption near edge spectroscopy (XANES) at Fe and C -edges and atomic/magnetic force microscopy (AFM, MFM), respectively. An ultrathin (3 nm) 57 layer, placed between relatively thick layers was used to estimate Fe self-diffusion taking place during growth at different using depth profiling measurements. Such 57 layer was also used for 57Fe conversion electron Mössbauer spectroscopy (CEMS) and nuclear resonance scattering (NRS) measurements, yielding the magnetic structure of this ultrathin layer. We found from XRD measurements that the structure formed at low (300 K) is analogous to Fe-based amorphous alloy and at high (773 K), pre-dominantly a phase has been formed. Interestingly, at an intermediate (523 K), a clear presence of (along with and Fe) can be seen from the NRS spectra. The microstructure obtained from AFM images was found to be in agreement with XRD results. MFM images also agrees well with NRS results as the presence of multi-magnetic components can be clearly seen in the sample grown at = 523 K. The information about the hybridization between Fe and C, obtained from Fe and C -edges XANES also supports the results obtained from other measurements. In essence, from this work, experimental realization of has been demonstrated. It can be anticipated that by further fine-tuning the deposition conditions, even single phase phase can be realized which hitherto remains an experimental challenge.
I Introduction
Tetra iron compounds (Fe4X) are an interesting class of compounds known to exhibit higher (than Fe) magnetic moment (M), Matar et al. (1988); Blancá et al. ; Takahashi et al. (2011); Fang et al. (2014) and spin-polarization ratio (SPR) Kokado et al. (2006); Lv et al. (2013). In addition, metallic resistivity and corrosion resistance of Fe4X make them attractive for applications. The structure of Fe4X compounds have been classified as anti-perovskite [P4̄3m (215)] and metalloid element such as X = B, C, N occupy the body center position within the face center cubic (fcc) lattice of host Fe. Theoretically predicted values of M for Fe4B, Fe4C and Fe4N are 2.57, 2.42 and 2.62 B Matar et al. (1988); Blancá et al. ; Takahashi et al. (2011); Lv et al. (2013); Fang et al. (2014), respectively. Such an enhancement in M occurs due to volume expansion of Fe lattice. An expansion in volume produces higher density of states near the fermi level due to contraction of d-band (relative to Fe) and therefore results in higher M. The increase in M due to volume expansion is known as magneto-volume effect Houari et al. (2010). Experimentally, M of Fe4N has been achieved close to its theoretical values (2.4 B) in several works Pandey et al. (2019); Ito et al. (2011); Takahashi et al. (2001); Costa-Krämer et al. (2004). Such enhancement in M with respect to pure Fe (M of Fe = 2.2 ) make them very useful in various applications e.g. spintronics, magnetic data storage devices Kohmoto (1991), permanent magnets, spin-injection electrodes Kokado et al. (2006), etc. In addition, recent density functional theory calculation suggests that the SPR for Fe4X (X = B, C, N) comes out to be 84, 88 and 61, respectively Lv et al. (2013).
Furthermore, is thermally more stable than others (e.g. Fe4N or Fe4B) due to smaller Fe–C bond distance Fang et al. (2011, 2012); Zhang et al. (2012); Lv et al. (2013); Fang et al. (2014). Theoretical calculation suggests that Fe–C bond length at 1.8739 Å is smaller as compared to Fe–B (1.9027 Å) or Fe–N (1.8899 Å) Lv et al. (2013). Likewise, other transition metal carbides also show higher thermal stability than nitrides of similar composition. Their thermal stability can also be expressed in terms of Debye-temperature (), which is a classical limit of quantum model of Einstein-Debye specific heat for solids. Guillermit et al. Guillermet and Grimvall (1989); Fernández Guillermet et al. (1992) calculated for some transition metal carbides and nitrides and found that in general, of carbides are higher than that of nitrides.
In spite of very interesting magnetic properties, higher SPR and thermal stability, experimental reports on are almost non-existent and single phase has not yet been synthesized. Recently, interatomic potential for Fe-C systems were calculated using modified embedded atom method (MEAM) and it was predicted that the presence of C lowers the body center cubic (bcc) to face center cubic (fcc) transformation barrier Nguyen et al. (2018a, b). Also the activation energy for C diffusion in Fe was calculated and found to be very small at about 0.8 eV Lu et al. (2018). Both, the reduction in barrier for bcc to fcc and low activation energy point towards favorable conditions for phase formation. However, the enthalpy of formation energy (H) for is positive (about 0.1 eV Lv et al. (2013); Liu et al. (2016)). It may be noted that H for early transition metal nitrides and carbides is quite less e.g. H = -1.9 eV for TiC and -3.5 eV for TiN Guillermet and Grimvall (1989). Therefore, synthesis of these compounds take place straight away using standard methods. Even with a slight negative H = -0.15 eV Lv et al. (2013); Fang et al. (2014), single phase Fe4N has been reported in several works Blancá et al. . But for , a positive value of H leads to a thermodynamically unfavorable condition that can not be achieved utilizing equilibrium processes e.g. Fischer-Tropsch synthesis (FTS). Recently, FTS was used to synthesize iron carbide (Fe-C) compounds and resulting phases were identified as -Fe3C and -Fe5C2 from x-ray diffraction and Mössbauer spectroscopy measurements Liu et al. (2016).
However, using non-equilibrium processes that are typically found in physical vapor depositions (PVD) methods, formation of may be feasible. It may be noted that H of Fe16N2 is also positive at about 0.88 eV/atom) Tessier et al. (2000). Using various thin film deposition techniques like e-beam evaporation, molecular beam epitaxy and sputtering, (partial) formation of Fe16N2 has been reported Sugita et al. (1996); Takahashi et al. (1994). Therefore, formation of may also take place using such non-equilibrium processes. Among PVD methods, co-sputtering is most convenient and effective to synthesize Fe-C compounds as: (i) the control of composition can be made precisely by varying the power of each sputter source (ii) in a confocal geometry, sputtered species from each source mix before depositing on to a substrate (iii) ad-atom energies in sputtering are much higher (typically 10 eV) than that of thermal evaporation (0.1-0.2 eV) Ohring (2002). Thus, non-equilibrium nature and higher energetics of the depositing species in sputtering have risen a possibility to prepare .
Some attempts have been made to synthesize Fe-C thin films by sputtering of a compound [Fe+C] target Tajima and Hirano (1993); Babonneau et al. (1999, 2000); Mi et al. (2004); Weck et al. (2012); Mi et al. (2005), or sputtering of Fe using a mixture of Ar+CH4 Jouanny et al. (2010) or Ar+C2H2 Kirilyuk et al. (1996). Utilization of compound target may not be useful to control the composition of Fe-C films and using gases like CH4 and C2H2 may also result in formation of undesired C-H bonds. On the other hand, co-sputtering of Fe and C from two different sources is a clean method providing a wide range of option to control the composition by changing the flux of each sources as demonstrated recently by Furlan et al. Furlan et al. (2015). A survey of available literature suggests that most of the Fe-C thin films reported hitherto are either amorphous or nanocrystalline. For example, Jouanny et al. Jouanny et al. (2010) prepared Fe-C thin films by sputtering of Fe target in Ar/CH4 gas environment at = 373 K and identified phases were - at lower CH4 gas flow and amorphous at higher CH4 gas flow. Tajima et al. deposited Fe-C thin films at 623 K by rf magnetron sputtering of a compound target Tajima and Hirano (1993) and phases identified were -Fe, Fe5C2. Weck et al. Weck et al. (2012) deposited Fe-C thin films by ac magnetron sputtering and reactive cathodic arc evaporation of a compound target (12 and 16 at. C). Resulting films were found to be nano-crystalline bcc-Fe. Subsequently, Babonneau et al. Babonneau et al. (2000) deposited Fe1-xCx (0.26 x 0.74) thin films at various substrate temperatures but resulting films were found to be amorphous. Similarly, Mi et al. Mi et al. (2004) deposited Fe-C thin films by sputtering of a compound target (at room temperature) and also found amorphous Fe-C phases. More recently, Furlan et al. Furlan et al. (2015) deposited Fe-C thin films by co-sputtering of Fe and C from two separate targets (at 300 K) and varied C concentration from 20.8 to 71.8%. It was observed that resulting Fe-C films were amorphous, irrespective of the amount of C in Fe.
In this work, we synthesized Fe-C thin films by co-sputtering of Fe and C at different substrate temperature () with a nominal composition of so as to attempt the first ever experimental realization of . Samples were characterized using x-ray diffraction (XRD) for their structure and the surface and magnetic morphology has been obtained from atomic and magnetic force microscopy (AFM, MFM) measurements, respectively. The information about the nature of bonding has been obtained from XANES measurements at C and Fe -edges. The magnetization of samples were studied using conversion electron Mössbauer spectroscopy (CEMS) and synchrotron based nuclear resonant scattering (NRS). In addition, from secondary ion mass spectroscopy (SIMS) depth-profiles measurements, Fe self-diffusion was estimated and compared with a pure Fe sample prepared under similar conditions. We found that at low the addition of C suppresses Fe diffusion but at high it augments. From above mentioned measurements, we found that the room temperature grown film was amorphous but at high , phases formed are crystalline. At the highest (773 K), pre-dominantly a phase has been formed but at an intermediate of 523 K, a clear presence of (along with and Fe) can be seen. Observed results demonstrate the possibilities for formation of crystalline Fe-C phases by co-sputtering. The structural and magnetic properties of thus formed Fe-C phases are presented and discussed in this work.
II Experimental Details
Fe and C targets were co-sputtered to prepare iron-carbon (Fe-C) thin films. They were deposited at substrate temperature () = 300, 523 and 773 K with nominal stoichiometric composition for or . Their layer structure was: C(5 nm)naturalFe-C(70 nm)57Fe-C(3 nm)naturalFe-C(100 nm)C(10 nm)sub.(Si/Quartz). The C concentration was evaluated using: (i) number of monolayer (n) per unit area per unit mole: n = mass-number/mass-density (ii) thicknesses of Fe and C equivalent to stoichiometric is nFe0.8 and nC0.2 (iii) deposition rates for Fe and C has been optimized to achieve thicknesses obtained for composition.
The chamber was evacuated down to a base pressure of 210-7 hPa. Sputtering was carried out using pure Ar (purity 99.9995) gas at a working pressure of 310-3 hPa due to gas flow of 20 sccm. In this layer structure, the naturalFe-C (hereafter Fe-C) was prepared by co-sputtering of a 3 inch Fe (purity 99.95%) and 3 inch C (purity 99.999%) target at the sputtering power of 100 and 156 W, respectively. On the other hand, for the 57Fe-C, the same C target and a 1 inch 57Fe (enrichment 95.0%, purity 99.95%) target was used and their sputtering powers were kept at 70 and 11 W, respectively. To prevent Si diffusion from the substrate and surface contamination of samples, a buffer and capping layer of C was always deposited at room temperature prior to or after the deposition of film. For better uniformity of the films, substrate holder was rotated at 60 rpm at a distance of about 12 cm from the target. The structural growth of samples was characterized by XRD measurements using Bruker D8 Advance diffractometer equipped with Cu K x-ray source. The surface morphology and magnetic domain growth of samples was obtained from AFM and MFM measurements (in tapping mode), respectively. During MFM measurements, the cantilever has been lifted up at a height of 50 nm from the surface, to minimize the effect of topography. The electronic structure of the deposited samples have been investigated using Fe -edges and C -edge XANES measurements at BL-01 beamline Phase et al. (2014), Indus-2 synchrotron radiation source, RRCAT, Indore, India in total electron yield (TEY) mode under UHV conditions. The local structural and magnetic properties have been determined using CEMS and grazing incidence NRS measurements. The angle of incidence during NRS measurements was kept fixed at the critical angle () 0.21∘ and they were performed at P01 beamline Wille et al. (2010) of DESY, Petra III synchrotron radiation source at Hamburg, Germany.
In addition, we also deposited reference samples: (i) pure C thin films at = 300, 523 and 773 K and, (ii) pure Fe thin film with a 57Fe marker layer. The process parameters during growth of these samples were kept similar to those described for samples. The structure of pure Fe samples was kept as: naturalFe(70 nm)57Fe(3 nm)naturalFe(100 nm) sub.(Si/Quartz). They were grown at = 300, 523, 648 and 773 K. In this case, Fe and 57Fe were sputtered alternatively from two different sources (at 100 W) and the 57Fe target was prepared by adding 57Fe foils within the race track area of naturalFe target. SIMS depth profiles from and Fe samples have been compared to deduce the effect of C addition on Fe self-diffusion at various .
III Results and Discussion
III.1 Structure and microstructure
Figure 1 shows XRD pattern of a pure Fe film (reference sample) and thin films deposited at = 300, 523 and 773 K. The XRD pattern (fig. 1a) of Fe thin film deposited at = 300 K shows growth of the film oriented along (200) plane and when the exceeds 523 K, the (110) plane becomes prominent. Generally, such variations in preferred orientations are not unexpected and have been observed in several cases like TiN Sundgren (1985); Oh and Je (1993); Patsalas et al. (2000), AlN Medjani et al. (2006) etc. and have been explained considering alterations in the adatom mobility, stress/strain, and surface energy due to enhanced Patsalas et al. (2000); Medjani et al. (2006). As shown later in this work (section III.4), the Fe self-diffusion does not increase appreciably on increasing the (in fact it decreases slightly at 523 K), therefore arguments related to adatom mobility may not be valid for the change observed in the preferred orientation of Fe films. In a recent work, Schönecker et al. calculated the thermal surface free energy and stress of iron at different temperatures and found that surface stress for the (001) surface was much smaller than that of (110) surface at low temperature but at high temperatures they become similar Schönecker et al. (2015). The changes observed in the preferred orientation in our Fe films can be understood from this argument. On the other hand, the width of XRD peaks become narrow as increases. The crystallite size (t) has been calculated using Debye Scherrer formula, t = 0.96/cos , where is wavelength of the x-rays, is angular full width half maxima of the Bragg reflection centered at 2. By increasing the from 300 to 523 and 773 K, t increases from 180.5 to 280.5 and 462.0 nm, respectively.
The XRD pattern (fig. 1b) of the thin film deposited at = 300 K shows a broad reflection centered around 2 = (44.580.1)∘ signifying that it has attained an amorphous structure. In an amorphous system, the average nearest neighbor distance (d) can be calculated using : d = 1.23/2 sin , where is center of the broad reflection and 1.23 is a geometric factor which rationalizes the nearest neighbor distance with the spacing between, “pseudo-close packed planes” Katz (1964). From here, we get d = 2.5 Å, a value typically found in iron-based amorphous alloys. McHenry et al. (1999). On the other hand, samples deposited at higher show a number of peaks. Observed peak positions for the sample deposited at = 523 and 773 K are similar and their intensity is increasing with . These peak positions match-well with that of -Fe3C (PDF#89-2867) and -Fe (PDF#870721) phases. A general observation shows that by increasing , peak broadening decreases indicating increase in crystallite size. The crystallite size of the evolved phases in the sample deposited at = 523 K comes out to be 171 nm of -Fe3C phase corresponding to (210) reflection centered at (43.740.01) ∘ and 261 nm for -Fe phase corresponding to (110) reflection centered at (44.750.01) ∘. Similarly, crystallite size is 422 and 282 nm for -Fe3C and -Fe phases, respectively for the sample deposited at = 773 K.
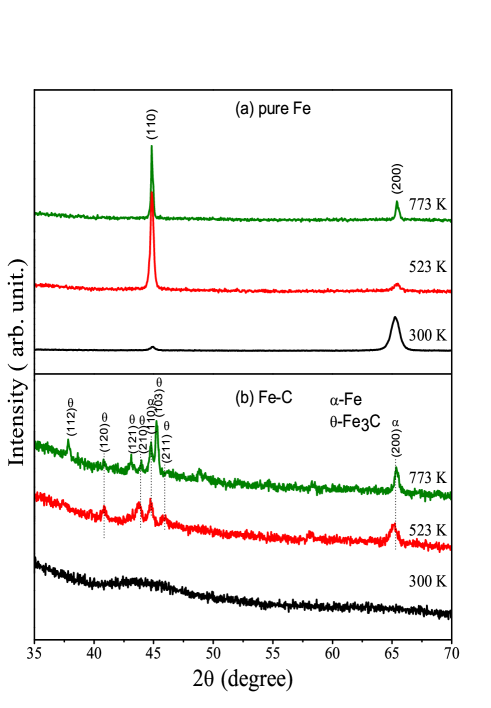
The solubility of C in bcc Fe under ambient condition is very small (0.2 at%) Callister (2006). Beyond this limit, the presence of C produces a disordered crystal structure due to immiscibility of C with Fe. This results in formation of an amorphous phase in our sample and show agreement with previous reports Furlan et al. (2015). Increasing substrate temperature pushes C at interstitial position of the orthorhombic crystal lattice of Fe, this results in growth of -Fe3C phase. However, peaks corresponding to un-reacted -Fe are also visible.
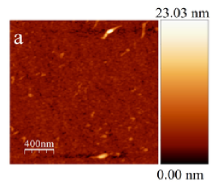
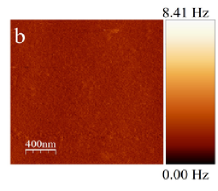
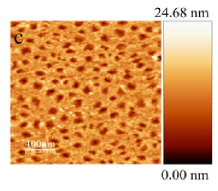
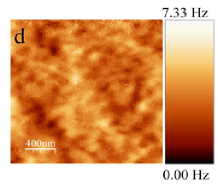
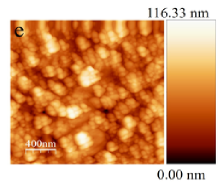
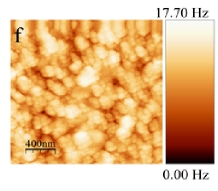
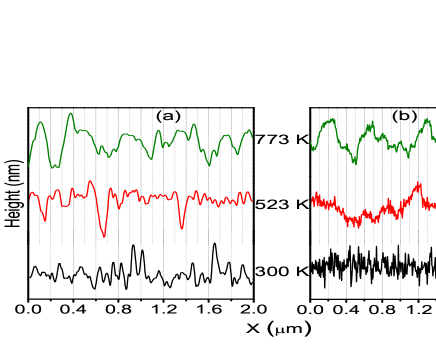
Figure 2 shows surface and magnetic morphology of the thin films deposited at various . Images were processed using WSxM software package Horcas et al. (2007). For better understanding of grain and domain growth, we have plotted height and frequency distribution profile of the AFM (fig. 3(a)) and MFM (fig. 3(b)) images, respectively. In the AFM image of the sample deposited at = 300 K (fig. 2(a)), the grains are very small. It is also clear from the height distribution (Hd) profile (fig. 3(a)). On the other hand, the AFM image of the sample deposited at = 523 K shows enhancement in the grains (fig. 2(b)) and their Hd profile shows that they are nearly equal in size. The sample deposited at = 773 K have much larger grains compared to other two samples (fig. 2(c)). The Hd profile of the AFM image shows uniform growth of larger grain along with smaller grains. This shows that increase in results in formation of larger grains. This is in agreement with the XRD results as the grains of -Fe3C become larger with increase in .
The MFM images and their frequency distribution profile (Fd) show that the sample deposited at = 300 K may have very small magnetic domains (fig. 2(b) and 3(b)) and they are not clearly visible. The sample deposited at = 523 K have large magnetic domains (fig. 2(d)) with a systematic change in the cantilever frequency (fig. 3(b)). On the other hand, even larger magnetic domains can be seen in the MFM image (fig. 2(e)) of the sample deposited at = 773 K. However, the magnetic domains in MFM image is following the pattern similar to topographic changes observed in the AFM (fig. 2(e)). In addition, the frequency distribution profile (fig. 3(b)) shows a change in the frequency similar to change in Hd profile (fig. 3(a)). This is an indication of presence of two kinds of magnetic domain, one with larger and another with smaller size. The MFM image of the sample deposited at Ts = 523 K shows that the structural and magnetic morphologies are different. The Fd profile shows various frequency maxima with different magnitude (fig. 3(b)). This change in the magnetic field of the sample deposited at = 523 K may arise if several magnetic phases are present together. The presence of such magnetic phases can be investigated using a local magnetic probe e.g. Mössbauer spectroscopy based techniques like CEMS and NFS. Results of CEMS and NFS are presented in section III.3.
III.2 Electronic structure
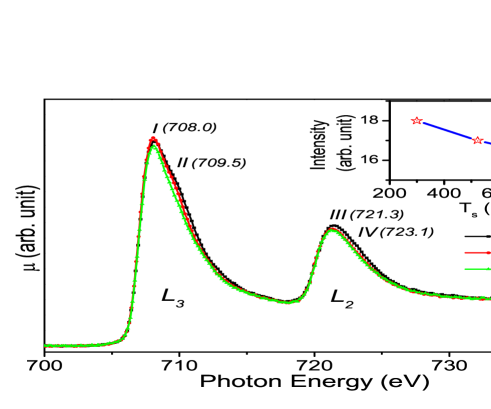
Local electronic structure was probed using synchrotron based XANES measurements at Fe and C absorption edges. Fig. 4 shows Fe -edge XANES spectra of the thin film deposited at various , following dipole transition. As indicated, the spectra consist of two prominent transitions occurring due to spin-orbit splitting of orbital in (I) and (III) core-shell separated in energy by about 13 eV, which is a typical value for Fe. Each sub-spectrum further split in double sub-peak due to ligand field splitting marked as II and IV in fig. 4. Such splitting has been observed in several transition metal-carbides Magnuson et al. (2006, 2009, 2012); Furlan et al. (2015). The spectra show two characteristic change with (i) peak become narrow, and (ii) total integrated intensity of the feature is decreasing as shown in the inset of the fig.4.
Generally, a narrow Fe absorption lines for pure Fe are observed Furlan et al. (2015). But, addition of smaller atom e.g. C, N, O produces splitting due to crystal field and results in broadening of the resonance lines Furlan et al. (2015). Their intensity is proportional to the unoccupied Fe 3d states. Decreasing intensity indicates decrease in charge transfer with increasing , this results in reduced unoccupied Fe 3d state at higher . Earlier reports on Fe and Cr XANES spectra of amorphous system have shown that, the peak intensity increases with increase in C concentration Magnuson et al. (2012); Furlan et al. (2015). Decrease in the unoccupied state show reduced carbide contribution at higher . These variation of the spectra show, there can be possibility of presence of C in un-hybridized states at higher . Further insight about the hybridization have been obtained from C -edge XANES measurements.
Figure 5 shows C K-edge XANES spectra of the Fe-C thin film deposited at various . The prominent features are marked as a, b, c and d, and shoulders of a and c as and c′, respectively. The feature a is related with empty states, it is a combination of (i) and hybridized C states, and (ii) Fe 3-C 2 hybridized states. In addition, the feature c is also a combination of (i) Fe 3d-C 2 hybridized states, and (ii) C-O bonding states. These two features show opposite trend with , with increase in the intensity of the feature increases while the intensity of the feature decreases. A comparison of the C K-edge spectra of the thin film with -C thin film deposited at = 300, 523 and 773 K shows that, the feature is shifted by 0.4 eV at lower energy side for a-C thin films. This shows in case of , the feature is strongly related with Fe 3d-C 2 hybridized states. But decrease in the intensity of this feature shows reduction in carbide contribution as observed in the Fe -edge spectra. Consequently, increase in the intensity of the feature signifies presence of higher fraction of hybridized C states at higher . A shift in the feature can be observed at higher energy side by 0.3 eV for the sample deposited at = 523 K. This shows that, in addition with reduced carbide contribution at higher , the sample deposited at = 523 K have different local structure compared to samples deposited at = 300 and 773 K. In addition, a faint feature b is observed at 286.4 eV, although origin of this feature is yet not clear Kumar et al. (2018).
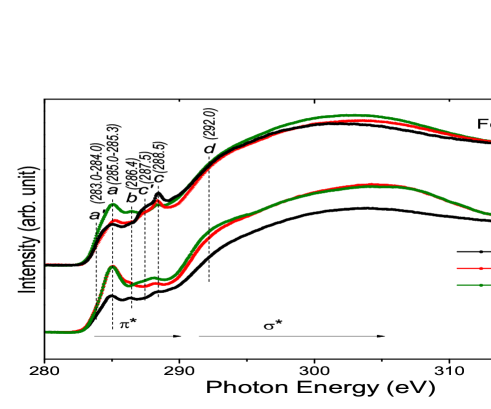
In addition, the shoulder can be solely due to formation of metal carbide Furlan et al. (2015); Magnuson et al. (2009, 2006, 2012). The intensity of this shoulder is faint and does not show any significant change. On the other hand, the intensity of the shoulder is decreasing with increase in . Another report on nano-crystalline TiC/-C, shows that the intensity of these features increases with increasing grain sizes as the carbide contribution increases. Unlike TiC/-C, decrease in the intensity shows decrease in carbide contribution with increasing . This shows presence of -C in un-hybridized state at higher .
III.3 Magnetic structure
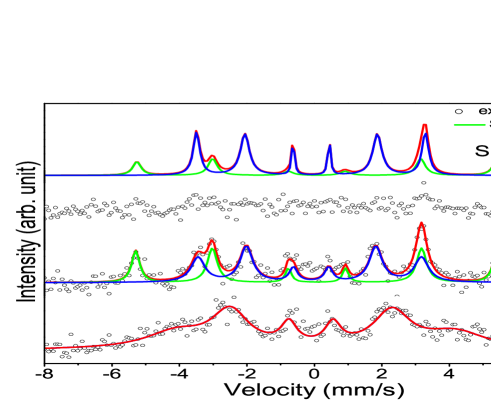
Magnetic structure of sandwiched 3 nm 57Fe-C layer was probed using CEMS and NRS measurements. Fig. 6 shows experimental CEMS spectra of samples deposited at various along with fitted data. The CEMS spectrum of the sample deposited at 300 K shows broad resonance lines. The broadening of the resonance lines can be related to lack of long-range ordering arisen due to immiscibility of C Miglierini and Greneche (1997); Glaser ; Miglierini and Mat (2017). This spectrum was fitted using one sextet with hyperfine field () of 25.650.34 T. A = 26-30 T depending on C content can be observed in amorphous Fe-C alloys Miani et al. (1994); Amagasa et al. (2016). This also in a way confirms the amorphous nature of the sample deposited at = 300 K. In comparison to this, the spectrum of the sample deposited at = 523 K shows narrow resonance lines. It was fitted assuming two sextets S1 and S2 with their = 33.200.08 and 20.510.13 T, respectively. Where, S1 and S2 can be assigned to -Fe (57) and -Fe3C (43) phases, respectively Liu et al. (2016).
On the other hand, the CEMS spectrum of the sample deposited at = 773 K does not show any prominent resonance even after long counting time (one week). The active % of Mössbauer signal was already low at about 0.5 due to ultrathin 57Fe-C layer (3 nm) but at higher (773 K) the 57Fe-C layer gets diffused across the entire depth of sample (shown later from SIMS depth profiles), active % of Mössbauer signal will reduce further. It may be noted that the escape depth of electrons in CEMS is (80 nm) Moutinho et al. (2009) which is shorter than the total thickness of sample. The large spread of 57Fe with reduces the effective number of resonating nuclei leading to poor statistics. Therefore, ensuing magnetic phases that can be observed in MFM measurements, could not be resolved from CEMS measurement. Such experimental limitation can be overcome by doing synchrotron radiation based NRS measurements.
NRS is a fourier transform of Mössbauer spectroscopy. This technique is very sensitive to spatial phase factors due to coherent scattering of radiation with matter. It gives a possibility to correlate internal fields with the spatial arrangement of the atoms Röhlsberger (2005). Now a days, the availability of enormous brilliance of the synchrotron radiation sources have made it possible to perform such kind of measurements. This technique is frequently used to investigate magnetic properties and phase transitions under high pressure/temperature of nano-structure, ultrathin films, clusters Wille et al. (2010) and diffusion in the layered systems Gupta et al. (2005).
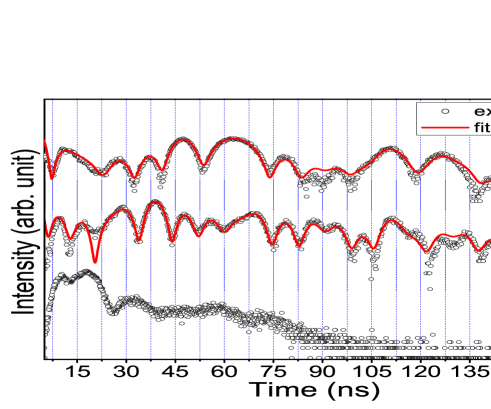
NRS spectra of of the samples deposited at various are shown in the fig.7. The spectrum of the sample deposited at = 300 K shows few quantum beats (QBs) with a period of about 15 ns confirming the magnetic nature of this sample in accordance with CEMS results Miglierini and Mat (2017). But the NRS signal decays soon after 40 ns which can be understood due to disordered local structure present in the amorphous phase Miglierini and Mat (2017). The NRS signal lasts much longer times ( 165 ns) in samples deposited at higher . The QB period of 523 K sample varies from 5 to 15 ns. On the other hand, it varies from 10 to 15 ns for the sample deposited at 773 K. The smaller QB period reveals presence of a high magnetic moment phase at 523 K. To get more detail information, we fitted NRS spectra of samples deposited at high using REFTIM software package Andreeva (2008). The spectrum of the sample deposited at = 523 K can be best fitted using combination of three hyperfine fields, = 21, 33, 34.3 T. As already discussed, = 21 and 33 T are respectively related to -Fe3C and -Fe, the additional component with larger = 34.3 T can be assigned to Fe4C Liu et al. (2016) phase only. Their relative volume fractions comes out to be 45 for -Fe3C, 35 for -Fe and 20 for Fe4C. On the other hand, the spectrum of the sample deposited at = 773 K can be best fitted assuming two components with = 21 and 33 T and their relative volume fractions are 70 and 30, respectively. The absence of = 34.5 T shows that higher (773 K) is not favorable for the growth of Fe4C phase.
III.4 Depth profiling and Fe self-diffusion measurements
Fig. 8(a) and (b) shows SIMS depth-profiles of and pure Fe samples deposited at different . The sandwiched 57Fe layer in both sets of sample results in a peak and it becomes broadened with increase increase in . In samples 57Fe peak width () is about 4 and 8 nm at = 300 and 523 K, respectively and at = 773 K it has completely diffused throughout the film. On the other hand, 57Fe profile in pure Fe is significantly broader already at 300 K but the broadening does not increase as much as in Fe-C at higher . In addition, C concentration has also been estimated from SIMS depth profiles (not shown) and it comes out to be 20, 17 and 13% in samples deposited at = 300, 523 and 773 K, respectively. This shows, C content decreases significantly for the sample deposited at = 773 K. In accordance with XANES spectra, decrease in C content with shows that C is moving out from the bulk of the sample.
As can be seen in Fig. 8(a), the trailing side of SIMS profiles are broader than the rising side. Such broadening is observed due to involvement of sputtering and small intermixing produced by 3 keV O+ ions. Such profiles can be corrected using following equation Brebec et al. (1980); Loirat et al. (2000); Gupta et al. (2002):
| (1) |
where, cc is corrected and ce is experimentally measured concentration profiles and is a parameter representing the strength of intermixing. The value of was kept constant for a series of samples.
To determine diffusion that is taking place during the growth of our samples, the shape of the tracer profile can be represented as a function of depth (x) as:
| (2) |
where, is a constant, t is annealing time and D is diffusion coefficient. Therefore, profiles can be fitted using a Gaussian function and diffusion coefficient can be calculated using the following equation Loirat et al. (2000):
| (3) |
where, D(t) is time average diffusion coefficient and is standard deviation of the Gaussian depth profile over an annealing time of t or when t = 0.
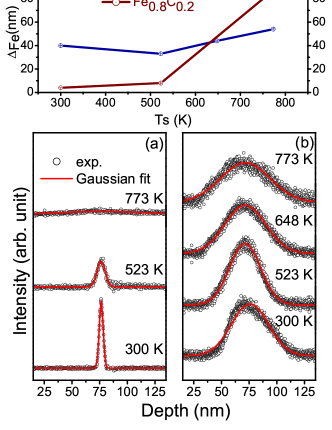
Obtained in and Fe samples are compared in fig. 8 (c). As can be seen that is about 10 times smaller in as compared to Fe sample deposited at = 300 K. Such a large variation in is somewhat puzzling and unexpected. It is known that fast grain boundary (gb) diffusion takes place in Fe due to defects or voids that are incorporated during the growth. Addition of C seems to suppress them significantly. Generally, it is anticipated that gb diffusion would take place at moderate temperatures. In our case, the information about Fe self-diffusion during growth is obtained, it is new and unique information and can be suitably used to understand the growth of Fe based thin films and also C can be used as a effective dopant to suppress Fe diffusion.
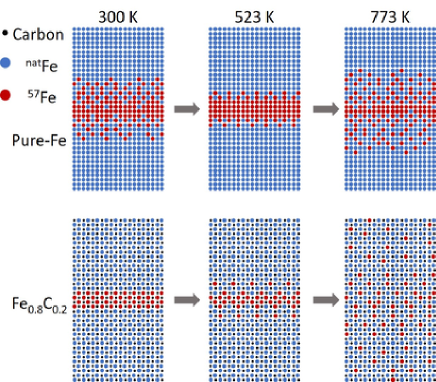
As we increase the , increases albeit a small drop in pure Fe deposited at = 523 K. Such a drop in can be due to an interface sharpening effect which happens due to release of defects and voids. Such interface sharpening was also evidenced recently in Fe thin films grown at 573 K Tiwari et al. (2019) and also observed in earlier works Bai et al. (1996); Kortright et al. (1991); Ishino et al. (2007); Amir et al. (2012). At = 523 K, in sample is still significantly smaller as compared to Fe but when samples were grown at = 773 K, a sudden rise in can be seen in sample. It appears that at low the presence of C suppress Fe self-diffusion but when the increases beyond a particular value, Fe diffusion gets augmented. Such kinetics of Fe self-diffusion affects formation of Fe-C phases and will be discussed later. The schematic of diffusion process is shown schematically in fig. 9.
Using the values of in Fe-C and Fe samples grown at = 773 K, we estimated Fe self-diffusion and it comes out to be about an order of magnitude faster in as compared to Fe (6110-19m2/s in Fe-C and 7310-20 m2/s in Fe). Fe self-diffusion coefficient obtained in our sample is close to the value found in earlier works Lübbehusen and Mehrer (1990); Iijima (2005); Chakravarty et al. (2016).
III.5 Phase transformation mechanism
From the results obtained in this work, a phase transformation mechanism can be drawn to understand the formation of Fe-C phases during the co-sputtering process. In co-sputtering process two or more targets are sputtered simultaneously (here -Fe (bcc) and graphite C targets). The mixing of sputtered Fe and C adatoms takes place when they are still in the vapor phase. In the sputtering process typically the adatom energy is about 10 eV and as adatom condense on a substrate they lose this energy in picosecond time yielding quenching rates of the order of 1016 K/s Wasa (2012). These rates are about 10 orders of magnitude higher as compared to melt roller quenching Wasa (2012). Generally, with such a high quenching rates, the resulting phase should become amorphous but this is certainly not the case as metallic samples produced by sputtering do possess a long range ordering. This can be amply seen from the XRD patterns of pure Fe films shown in fig. 1. Films grown at 300 K are poly crystalline with an average grain size of 180.5 nm and with an increase in , the grain size increases to 280.5 nm at 523 K, 451.5 nm at 648 K and 462 nm at 773 K. This clearly indicates that after condensation on a substrate, the adatom mobility driven diffusion process results in formation of long range ordering and with an increase in , it increases. As such this is trivial information which is well-known for growth of thin films with sputtering Bhavanasi et al. (2013); Li et al. (2009). However, this will be useful to understand the role of C in affecting phase formation in Fe-C thin films.
Aforementioned, we placed a 3 nm marker layer between natural Fe layers, and through this we could measure Fe self-diffusion that is taking place during the growth of film. We found that already at 300 K, the broadening in profile, is quite large at about 40 nm which is more than ten times of the thickness of marker layer. However, with an increase in , does not increase as much. Therefore, it appears that Fe self-diffusion takes place rapidly during the initial stages of growth and thereafter it reduces significantly. Fu et al. Fu et al. (2005) did multi-scale modelling of defect kinetics in iron and found that the activation energy (E) for interstitial migration can be as low as 0.3 eV in -Fe. In an experimental study on Fe self-diffusion in Fe/ multilayers, it was also found E was small (E1 eV) and has been explained in terms of structural defects in Fe that lead to fast Fe diffusion during initial stages which subsequently becomes smaller when defects relaxation process gets completed Chakravarty et al. (2009). In a recent study also, fast Fe diffusion has been observed and explains in terms of triple junctions leading to short-circuit diffusion Tiwari et al. (2019). In a way, the fast Fe diffusion during initial stages can be understood as grain boundary () diffusion. When the gb diffusion gets over, annihilation of defect causes Fe atoms to diffuse through a classical volume type diffusion via thermal vacancies with very high E 3 eV.
The addition of C in Fe affects the gb diffusion process, so much that 0. Instead of 40 nm for Fe, the in Fe-C was about 4 nm, close to its nominal thickness of 3 nm. And within experimental accuracy it can be inferred that 0 in Fe-C as compared to pure Fe. In this scenario, C atoms restrict the path of Fe atoms thereby leading to formation of an amorphous structure as observed in our Fe-C samples and also in previous studies Babonneau et al. (2000); Mi et al. (2004); Furlan et al. (2015). However, when increases to 773 K even more rapid Fe diffusion takes place, compared to the case when C was not added as shown in fig. 8 (c). Such an enhancement clearly indicates that in presence of C, the concentration of defects may become even higher leading to faster Fe diffusion through . But at an intermediate temperature of 523 K, we found that Fe diffusion was still low and crystalline Fe-C phases like and start to nucleate. And at this temperature regime, it seems that kinetics of Fe-C phase formation is driven by C diffusion. Recently, it has been revealed in a computational ReaxFF study (based on bond order concept van Duin et al. (2001)) that C diffuses through gb Lu et al. (2018) and E for C diffusion is typically about 0.8 eV. Also, as suggested by theoretical calculations, the energy barrier for (bcc) (fcc) phase transformation of Fe is about 0.137 eV/atom but it gets reduced to 0.127 eV/atom in presence of C Nguyen et al. (2018a, b). On the other hand, for the reverse case i.e. phase it is much smaller at about 0.025 eV/atom for Fe but it increases marginally to 0.047 eV/atom for Fe-C. The presence of C in Fe lattice produces local stress field, resulting enhancement in the energy barrier for Nguyen et al. (2018a, b). Therefore, the presence of C prevents and favors the phase transformation. These conditions are suitably met at the intermediate temperature of 523 K and by further fine tuning the amount of C and around 523 K, it may be possible increase the fraction of phase or even a single phase phase can be obtained.
IV Conclusion
In conclusion, in the present work we systematically studied the role of substrate temperature and phase formation in Fe-C thin films around composition. A comparison of films together with pure Fe films grown under similar conditions exhibited the effect of C inclusion of on the long range crystalline ordering. In addition, the comparison of films with C thin films yielded vital information about the hybridization between Fe and C. By inserting a thin 57Fe or 57 marker layer in between thick Fe or layers, Fe self-diffusion that is taking place during the growth itself was measured. We found the Fe self-diffusion was appreciably large even at 300 K, but the addition of C in Fe inhibits Fe self-diffusion remarkably. At the high of 773 K, C addition leads to very rapid Fe self-diffusion. However, at an intermediate temperature of of 523 K, Fe self-diffusion is still low and controllable so that formation of phase could be realized. It can be anticipated that by further fine tuning of and C composition, the fraction of can be further enhanced. The information about such Fe diffusion process in Fe-C system is new and can be suitably used to synthesize challenging Fe-C phases.
Acknowledgments
Authors would like to acknowledge Layanta Behera for technical help, Anil Gome for CEMS, Mohan Gangrade for AFM and MFM, Rakesh Sah for XANES and Nidhi Pandey for NRS measurements. We are thankful to A. K. Sinha for support and encouragements and Seema for fruitful discussions. Portions of this research were carried out at the light source PETRA III of DESY, a member of the Helmholtz Association (HGF). Financial support by the Department of Science Technology (Government of India) provided with in the framework of the IndiaDESY collaboration is gratefully acknowledge.
References
References
- Matar et al. (1988) S. Matar, P. Mohn, G. Demazeau, and B. Siberchicot, Journal de Physique 49, 1761 (1988).
- (2) E. L. P. y. Blancá, J. Desimoni, N. E. Christensen, H. Emmerich, and S. Cottenier, physica status solidi (b) 246, 909, https://onlinelibrary.wiley.com/doi/pdf/10.1002/pssb.200844401 .
- Takahashi et al. (2011) Y. Takahashi, Y. Imai, and T. Kumagai, Journal of Magnetism and Magnetic Materials 323, 2941 (2011).
- Fang et al. (2014) C.-M. Fang, R. S. Koster, W.-F. Li, and M. A. van Huis, RSC Adv. 4, 7885 (2014).
- Kokado et al. (2006) S. Kokado, N. Fujima, K. Harigaya, H. Shimizu, and A. Sakuma, Phys. Rev. B 73, 172410 (2006).
- Lv et al. (2013) Z. Lv, Y. Gao, S. Sun, M. Qv, Z. Wang, Z. Shi, and W. Fu, Journal of Magnetism and Magnetic Materials 333, 39 (2013).
- Houari et al. (2010) A. Houari, S. F. Matar, and M. A. Belkhir, Journal of Magnetism and Magnetic Materials 322, 658 (2010).
- Pandey et al. (2019) N. Pandey, S. Pütter, S. M. Amir, V. R. Reddy, D. M. Phase, J. Stahn, A. Gupta, and M. Gupta, arXiv:1906.01238 (2019).
- Ito et al. (2011) K. Ito, G. H. Lee, K. Harada, M. Suzuno, T. Suemasu, Y. Takeda, Y. Saitoh, M. Ye, A. Kimura, and H. Akinaga, Applied Physics Letters 98, 102507 (2011).
- Takahashi et al. (2001) T. Takahashi, N. Takahashi, N. Tamura, T. Nakamura, M. Yoshioka, W. Inami, and Y. Kawata, J. Mater. Chem. 11, 3154 (2001).
- Costa-Krämer et al. (2004) J. L. Costa-Krämer, D. M. Borsa, J. M. García-Martín, M. S. Martín-González, D. O. Boerma, and F. Briones, Phys. Rev. B 69, 144402 (2004).
- Kohmoto (1991) O. Kohmoto, IEEE Transactions on Magnetics 27, 3640 (1991).
- Fang et al. (2011) C. M. Fang, M. A. van Huis, J. Jansen, and H. W. Zandbergen, Phys. Rev. B 84, 094102 (2011).
- Fang et al. (2012) C. M. Fang, M. A. van Huis, B. J. Thijsse, and H. W. Zandbergen, Phys. Rev. B 85, 054116 (2012).
- Zhang et al. (2012) W. Zhang, Z. Lv, Z. Shi, S. Sun, Z. Wang, and W. Fu, Journal of Magnetism and Magnetic Materials 324, 2271 (2012).
- Guillermet and Grimvall (1989) A. F. Guillermet and G. Grimvall, Phys. Rev. B 40, 10582 (1989).
- Fernández Guillermet et al. (1992) A. Fernández Guillermet, J. Häglund, and G. Grimvall, Phys. Rev. B 45, 11557 (1992).
- Nguyen et al. (2018a) T. Q. Nguyen, K. Sato, and Y. Shibutani, MATERIALS TRANSACTIONS 59, 870 (2018a).
- Nguyen et al. (2018b) T. Q. Nguyen, K. Sato, and Y. Shibutani, Computational Materials Science 150, 510 (2018b).
- Lu et al. (2018) K. Lu, C.-F. Huo, Y. He, J. Yin, J. Liu, Q. Peng, W.-P. Guo, Y. Yang, Y.-W. Li, and X.-D. Wen, The Journal of Physical Chemistry C 122, 23191 (2018), https://doi.org/10.1021/acs.jpcc.8b07650 .
- Liu et al. (2016) X.-W. Liu, S. Zhao, Y. Meng, Q. Peng, A. K. Dearden, C.-F. Huo, Y. Yang, Y.-W. Li, and X.-D. Wen, Scientific Reports 6, 26184 EP (2016), article.
- Tessier et al. (2000) F. Tessier, A. Navrotsky, R. Niewa, A. Leineweber, H. Jacobs, S. Kikkawa, M. Takahashi, F. Kanamaru, and F. DiSalvo, Solid State Sciences 2, 457 (2000).
- Sugita et al. (1996) Y. Sugita, H. Takahashi, M. Komuro, M. Igarashi, R. Imura, and T. Kambe, Journal of Applied Physics 79, 5576 (1996), https://aip.scitation.org/doi/pdf/10.1063/1.362246 .
- Takahashi et al. (1994) M. Takahashi, H. Shoji, H. Takahashi, H. Nashi, T. Wakiyama, M. Doi, and M. Matsui, Journal of Applied Physics 76, 6642 (1994), https://doi.org/10.1063/1.358431 .
- Ohring (2002) M. Ohring, in Materials Science of Thin Films (Second Edition), edited by M. Ohring (Academic Press, San Diego, 2002) second edition ed., pp. 145 – 202.
- Tajima and Hirano (1993) S. Tajima and S. Hirano, Journal of Materials Science 28, 2715 (1993).
- Babonneau et al. (1999) D. Babonneau, T. Cabioc’h, M.-F. Denanot, and A. Naudon, Applied Physics Letters 74, 800 (1999), https://doi.org/10.1063/1.123372 .
- Babonneau et al. (2000) D. Babonneau, J. Briatico, F. Petroff, T. Cabioc’h, and A. Naudon, Journal of Applied Physics 87 (2000).
- Mi et al. (2004) W. B. Mi, Z. Q. Li, P. Wu, E. Y. Jiang, and H. L. Bai, Journal of Physics: Condensed Matter 16, 5569 (2004).
- Weck et al. (2012) A. Weck, C. W. Sinclair, C. P. Scott, and C. Maunder, Journal of Materials Science 47, 6939 (2012).
- Mi et al. (2005) W. B. Mi, Z. Q. Li, P. Wu, E. Y. Jiang, H. L. Bai, D. L. Hou, and X. L. Li, Journal of Applied Physics 97, 043903 (2005), https://doi.org/10.1063/1.1850607 .
- Jouanny et al. (2010) I. Jouanny, V. Demange, J. Ghanbaja, and E. Bauer-Grosse, Journal of Materials Research 25, 1859 (2010).
- Kirilyuk et al. (1996) A. Kirilyuk, J. Giergiel, J. Shen, M. Straub, and J. Kirschner, Phys. Rev. B 54, 1050 (1996).
- Furlan et al. (2015) A. Furlan, U. Jansson, J. Lu, L. Hultman, and M. Magnuson, Journal of Physics: Condensed Matter 27, 045002 (2015).
- Phase et al. (2014) D. M. Phase, M. Gupta, S. Potdar, L. Behera, R. Sah, and A. Gupta, AIP Conference Proceedings 1591, 685 (2014), https://aip.scitation.org/doi/pdf/10.1063/1.4872719 .
- Wille et al. (2010) H.-C. Wille, H. Franz, R. Röhlsberger, W. A. Caliebe, and F.-U. Dill, Journal of Physics: Conference Series 217, 012008 (2010).
- Sundgren (1985) J.-E. Sundgren, Thin Solid Films 128, 21 (1985).
- Oh and Je (1993) U. C. Oh and J. H. Je, Journal of Applied Physics 74, 1692 (1993), https://doi.org/10.1063/1.355297 .
- Patsalas et al. (2000) P. Patsalas, C. Charitidis, and S. Logothetidis, Surface and Coatings Technology 125, 335 (2000).
- Medjani et al. (2006) F. Medjani, R. Sanjinés, G. Allidi, and A. Karimi, Thin Solid Films 515, 260 (2006), iNTERNATIONAL CONFERENCE ON SURFACES, COATINGS AND NANOSTRUCTURED MATERIALS.
- Schönecker et al. (2015) S. Schönecker, X. Li, B. Johansson, S. K. Kwon, and L. Vitos, Scientific Reports 5, 14860 EP (2015), article.
- Katz (1964) L. Katz, Journal of Chemical Education 41, 292 (1964), https://doi.org/10.1021/ed041p292.2 .
- McHenry et al. (1999) M. E. McHenry, M. A. Willard, and D. E. Laughlin, Progress in Materials Science 44, 291 (1999).
- Callister (2006) J. Callister, William D., ISBN 0-471-73696-1. Wiley-VCH (2006).
- Horcas et al. (2007) I. Horcas, R. Fernández, J. M. Gómez-Rodríguez, J. Colchero, J. Gómez-Herrero, and A. M. Baro, Review of Scientific Instruments 78, 013705 (2007), http://dx.doi.org/10.1063/1.2432410 .
- Magnuson et al. (2006) M. Magnuson, O. Wilhelmsson, J.-P. Palmquist, U. Jansson, M. Mattesini, S. Li, R. Ahuja, and O. Eriksson, Phys. Rev. B 74, 195108 (2006).
- Magnuson et al. (2009) M. Magnuson, E. Lewin, L. Hultman, and U. Jansson, Phys. Rev. B 80, 235108 (2009).
- Magnuson et al. (2012) M. Magnuson, M. Andersson, J. Lu, L. Hultman, and U. Jansson, Journal of Physics: Condensed Matter 24, 225004 (2012).
- Kumar et al. (2018) P. Kumar, M. Gupta, U. Deshpande, D. Phase, V. Ganesan, and J. Stahn, Diamond and Related Materials 84, 71 (2018).
- Miglierini and Greneche (1997) M. Miglierini and J.-M. Greneche, Journal of Physics: Condensed Matter 9, 2303 (1997).
- (51) T. Glaser, Angewandte Chemie International Edition 50, 10019, https://onlinelibrary.wiley.com/doi/pdf/10.1002/anie.201104962 .
- Miglierini and Mat (2017) M. Miglierini and P. Mat , Pure and Applied Chemistry 89, 405 (2017).
- Miani et al. (1994) F. Miani, P. Matteazzi, and D. Basset, Journal of Alloys and Compounds 204, 151 (1994).
- Amagasa et al. (2016) S. Amagasa, N. Nishida, Y. Kobayashi, and Y. Yamada, Hyperfine Interactions 237, 110 (2016).
- Moutinho et al. (2009) F. Moutinho, C. Rojas, and L. D’Onofrio, in LACAME 2008, edited by J. Desimoni, C. Ramos, B. Arcondo, F. D. Saccone, and R. Mercader (Springer Berlin Heidelberg, Berlin, Heidelberg, 2009) pp. 141–147.
- Röhlsberger (2005) R. Röhlsberger, Nuclear Condensed Matter Physics with Synchrotron Radiation (Springer Berlin Heidelberg, 2005).
- Gupta et al. (2005) A. Gupta, M. Gupta, S. Chakravarty, R. Rüffer, H.-C. Wille, and O. Leupold, Phys. Rev. B 72, 014207 (2005).
- Andreeva (2008) M. A. Andreeva, Hyperfine Interactions 185, 17 (2008).
- Brebec et al. (1980) G. Brebec, R. Seguin, C. Sella, J. Bevenot, and J. Martin, Acta Metallurgica 28, 327 (1980).
- Loirat et al. (2000) Y. Loirat, J. Bocquet, and Y. Limoge, Journal of Non-Crystalline Solids 265, 252 (2000).
- Gupta et al. (2002) M. Gupta, A. Gupta, S. Rajagopalan, and A. K. Tyagi, Phys. Rev. B 65, 214204 (2002).
- Tiwari et al. (2019) A. Tiwari, M. K. Tiwari, M. Gupta, H.-C. Wille, and A. Gupta, Phys. Rev. B 99, 205413 (2019).
- Bai et al. (1996) H. L. Bai, E. Y. Jiang, C. D. Wang, and R. Y. Tian, Journal of Physics: Condensed Matter 8, 8763 (1996).
- Kortright et al. (1991) J. B. Kortright, S. Joksch, and E. Ziegler, Journal of Applied Physics 69, 168 (1991).
- Ishino et al. (2007) M. Ishino, M. Koike, M. Kanehira, F. Satou, M. Terauchi, and K. Sano, Journal of Applied Physics 102, 023513 (2007), https://doi.org/10.1063/1.2756741 .
- Amir et al. (2012) S. Amir, M. Gupta, and A. Gupta, Journal of Alloys and Compounds 522, 9 (2012).
- Lübbehusen and Mehrer (1990) M. Lübbehusen and H. Mehrer, Acta Metallurgica et Materialia 38, 283 (1990).
- Iijima (2005) Y. Iijima, Journal of Phase Equilibria and Diffusion 26, 466 (2005).
- Chakravarty et al. (2016) S. Chakravarty, N. Shukla, A. Devishvili, A. Vorobiev, and G. Amarendra, Materials Research Express 3, 085001 (2016).
- Wasa (2012) K. Wasa, in Handbook of Sputtering Technology (Second Edition), edited by K. Wasa, I. Kanno, and H. Kotera (William Andrew Publishing, Oxford, 2012) second edition ed., pp. xi – xii.
- Bhavanasi et al. (2013) V. Bhavanasi, C. B. Singh, D. Datta, V. Singh, K. Shahi, and S. Kumar, Optical Materials 35, 1352 (2013).
- Li et al. (2009) X.-Y. Li, H.-J. Li, Z.-J. Wang, H. Xia, Z.-Y. Xiong, J.-X. Wang, and B.-C. Yang, Optics Communications 282, 247 (2009).
- Fu et al. (2005) C.-C. Fu, J. D. Torre, F. Willaime, J.-L. Bocquet, and A. Barbu, Nature Materials 4, 68 (2005).
- Chakravarty et al. (2009) S. Chakravarty, H. Schmidt, U. Tietze, D. Lott, N. P. Lalla, and A. Gupta, Phys. Rev. B 80, 014111 (2009).
- van Duin et al. (2001) A. C. T. van Duin, S. Dasgupta, F. Lorant, and W. A. Goddard, The Journal of Physical Chemistry A 105, 9396 (2001), https://doi.org/10.1021/jp004368u .