Magnetization-density distribution in the metallic ferromagnet SrRuO3 determined by polarized neutron diffraction
Abstract
The magnetization-density distribution in the metallic ferromagnet SrRuO3 was studied by means of polarized neutron diffraction. The analyzes by multipole refinements and by the maximum entropy method consistently reveal a strong polarization of all oxygen sites carrying 30% of the total magnetization. The spin-density distribution on the Ru site exhibits a nearly cubic shape in agreement with an almost equal occupation of orbitals and hybridization. The experimental analysis is well reproduced by density functional calculations. There is no qualitative change in the magnetization distribution between 2 and 200 K.
pacs:
I Introduction
SrRuO3 is a material with fascinating properties Randall and Ward (1959); Callaghan et al. (1966); Koster et al. (2012) and has a strong application potential as an electrode for functional perovskites. It is metallic and exhibits ferromagnetic ordering below the Curie temperature of TC=165 K Koster et al. (2012). There is strong coupling between the magnetism and charge carriers as the resistivity sharply drops at the ferromagnetic ordering Allen et al. (1996); Klein et al. (1996). At low temperature high-quality single crystals exhibit good conductivity but well above the ferromagnetic order the resistivity increases with temperature exceeding the Ioffe-Regel limit already at moderate temperatures Allen et al. (1996). Non-Fermi liquid behavior was reported at low temperature Kostic et al. (1998) and an invar effect in the magnetic phase Kiyama et al. (1996). The material is furthermore known for its peculiar anomalous Hall effect, that changes sign slightly below TC Izumi et al. (1997); Fang et al. (2003); Kats et al. (2004); Haham et al. (2011); Koster et al. (2012); Itoh et al. (2016). It is argued that the larger spin-orbit coupling in this 4d compound together with the exchange splitting of the electronic bands results in various Weyl points close to the Fermi level Chen et al. (2013), which are proposed to cause the anomalous Hall effect Fang et al. (2003); Itoh et al. (2016). More recently it was realized that Weyl physics may also influence the spin dynamics due to the intrinsic coupling of magnetization and current density. Neutron scattering studies of the gap of the spin-wave dispersion Jen ; Itoh et al. (2016) as well as of its stiffness Jen reveal an anomalous softening in the ferromagnetic state that contrasts with the expected behavior of a simple ferromagnet. The temperature dependent occupation of the Weyl points leads to the peculiar temperature dependence of the anomalous Hall effect, and also causes softening of the magnon gap and stiffness Fang et al. (2003); Itoh et al. (2016).
Spin-orbit coupling has a strong impact in SrRuO3 as can be learned from the sizeable anisotropy gap of about 1meV Jen ; Langner et al. (2009). This strong anisotropy is also seen in the anisotropic magnetization curves Kanbayasi (1976); Cao et al. (1997); Kunkemöller et al. (2016, 2017a). Due to two structural phase transitions at 975 and 800 K the crystal structure of initially cubic SrRuO3 is heavily distorted at low temperatures with RuO6 octahedra being rotated and tilted by about 9 degrees. The low-temperature space group is Pnma with lattice constants =5.53, =7.85, and =5.57 ÅRandall and Ward (1959); Jones et al. (1989); Chakoumakos et al. (1998); Lee et al. (2013); Bushmeleva et al. (2006) and therefore single crystals of SrRuO3 exhibit complex structural twinning with six domain orientations unless some detwinning procedure is applied. The easy axis of SrRuO3 corresponds to the orthorhombic direction, parallel to the longest edge of the RuO6 octahedron Kunkemöller et al. (2017a). Thus the magnetic moment points along the elongation of the RuO6 octahedron in agreement with what one may expect from the spin-orbit coupling. Magnetization curves along the three orthorhombic directions indicate efficient anisotropies of the order of 10 T Kanbayasi (1976); Cao et al. (1997); Kunkemöller et al. (2016, 2017a) in perfect agreement with the microscopic anisotropy value of 1 meV Jen . However, there are several conflicting reports due to the ability of SrRuO3 to change its domain distribution as function of external magnetic field Kunkemöller et al. (2017a). If the magnetic field is not applied along the easy axis parallel to the direction in an untwinned single crystal the structural domains reorient. For magnetic field along a cubic [110] direction, the structural domains with the orthorhombic parallel to the field grow on the cost of the other domains. For field along cubic [100], the domains with direction at 45∘ to the field grow on the cost of those with perpendicular to the field. This coupling of domains and magnetization can also explain some glassy processes Palai et al. (2009); Sow et al. (2012) that are not intrinsically magnetic but structural.
Recent density functional theory (DFT) calculations characterize SrRuO3 as a moderately correlated electron system Etz et al. (2012) in contrast to e.g. Ca2RuO4 being considered as a Mott insulator Zhang and Pavarini (2017). SrRuO3 seems not to be half metallic but the free charge carriers possess minority spin Worledge and Geballe (2000). The orbital moment is found by X-ray magnetic circular dichroism (XMCD) to be tiny, about two orders of magnitude smaller than the spin contribution Agrestini et al. (2015); Okamoto et al. (2007); Agrestini et al. report ratios of 0.01 Agrestini et al. (2015) and Okamoto et al. give an orbital moment of 0.04(4) Bohr magnetons Okamoto et al. (2007). These very small orbital moments also agree with our DFT calculations, see below.
The perovskite SrRuO3 furthermore is relevant for the understanding of the unconventional superconductor Sr2RuO4 because its ferromagnetism inspired the first proposals of -wave triplet pairing in Sr2RuO4 Baskaran (1996); Rice and Sigrist (1995). Recent inelastic neutron scattering studies indeed find quasi-ferromagnetic fluctuations in Sr2RuO4 Steffens et al. (2019), but they clearly differ from the magnon and paramagnon response Mor observed in SrRuO3 Jen . While the electronic structure is well studied and well understood to fine details in Sr2RuO4, ARPES measurements of similar quality are lacking for SrRuO3.
Early DFT studies emphasized a large magnetization of the oxygen in SrRuO3, in total about one third of the magnetization would reside on the oxygen orbitals Mazin and Singh (1997). Since oxygen orbitals can be polarized in a ferromagnetic but not in an antiferromagnetic arrangement of neighboring Ru spins, a dependence of the electronic interaction parameter was deduced Mazin and Singh (1997); such interaction is used in an RPA treatment Ere as well as in the BCS gap equation calculations Mazin and Singh (1999); Steffens et al. (2019). Experimental evidence for a large polarization of oxygen orbitals was indeed found in polarized neutron diffraction experiments on Ca2-xSrxRuO4, which exhibits a metamagnetic transition Gukasov et al. (2002). The polarized measurement even allowed one to identify the Ru orbital as the one carrying the magnetization. More recently, the triple-layer member of the Ruddlesdon Popper series, Sr4Ru3O10, was studied by polarized neutron diffraction Granata et al. (2016), also revealing sizeable oxygen moments. But the complex crystal structure with many different oxygen sites limits the precision of the spin-density determination at various sites. Here we report on polarized neutron diffraction studies of the spin density in SrRuO3, which reveal that 30% of the magnetization are indeed carried by the oxygen orbitals. Thus hybridization cannot be ignored in ruthenates.
II Experimental
Single crystals of SrRuO3 were grown by the traveling floating-zone technique in a mirror furnace as described in Kunkemöller et al. (2016). The magnetization as function of temperature was determined in a commercial SQUID magnetometer (MPMS, Quantum Design). Unpolarized neutron diffraction experiments were performed at the KOMPASS instrument at the Maier Leibnitz Zentrum kompass . A neutron beam with a wavelength of 4.00Å was obtained with a highly oriented pyrolytic graphite monochromator and higher order contaminations were suppressed by a velocity selector. The instrument was operated in two-axis mode. The polarized neutron-diffraction measurements were performed at the Institut Laue Langevin using the spin polarized hot neutron diffractometer D3 in the high-field set up with a lifting-counter detector ill . A 10 T cryomagnet was used and the Heusler monochromator produced a 95 % polarized neutron beam with a wavelength of 0.85 Å. Two Erbium filters were introduced to suppress higher order contaminations.
III Results and Discussion
III.1 Polarized and unpolarized neutron experiments
Figure 1 compares the temperature dependence of the magnetization in SrRuO3 determined by the SQUID experiments with that obtained from the neutron diffraction study. In the unpolarized neutron diffraction experiment the magnetization is observed as an additional contribution to the (100)cubic Bragg reflection intensity, which is proportional to the square of the magnetization, the order parameter of the ferromagnetic transition. Indeed the magnetization and the square root of the additional (100) intensity scale very well with each other down to low temperature. For the magnetization we show the results obtained from extrapolating full hysteresis cycles, data taken from Ref. Jen , and a temperature dependent measurement with H=5 mT parallel to the cubic [110] direction (recorded after field cooling the sample in H=7 T). The temperature dependence of the magnetization is well described by a critical power law with =0.27(2) in agreement with previous powder analyzes =0.25(1)Itoh et al. (2016) and =0.24(4) Bushmeleva et al. (2006). If only the more dense temperature dependent magnetization data is used to determine the critical exponent, we obtain =0.267(4) with the data between 0.5Tc and Tc and =0.262(6) with data between 0.9Tc and Tc. It is remarkable that the power law can very well describe the data down to half of the Curie temperature.
In the polarized neutron experiment we analyzed a nearly cube shaped piece of single crystalline SrRuO3 Kunkemöller et al. (2016, 2017a) with a mass of 60 mg. The crystal edges corresponded to the orthorhombic directions, and the magnetic field was applied parallel to the -direction. The sample was cooled down to 2 K in a field of 9 T. The magnetic field has two roles in the polarized neutron experiment, it aligns the spins of the sample and guides the neutron spins. The sample was mechanically detwinned before the neutron experiment yielding a strongly dominant, 85%, domain Kunkemöller et al. (2017a). The magnetic field was applied parallel to the direction of the main domain, which due to our previous neutron diffraction studies results in an almost complete monodomain state Kunkemöller et al. (2017a). The absence of twining is crucial for the precision of the spin-density analysis. A large set of 306 flipping ratios, i.e. ratios of the Bragg reflection intensities for neutron spin parallel and antiparallel to the external magnetic field, was measured at 2 K and after heating to 200 K another set of 177 flipping ratios was recorded. These sets contained 92 and 65 symmetrically inequivalent flipping ratios with weighted reliability factor values for equivalent reflections of 3.98 and 1.41% ill .
The flipping ratio is given by the quotient of the squared sums and differences of nuclear and magnetic structure factors, and for a centrosymmetric system with magnetization perfectly aligned by the magnetic field it can be written as (without corrections for extinction and absorption) Sch :
where is the nuclear structure factor, is the magnetic structure factor corresponding to the Fourier transform of the magnetization density, and with the angle between the magnetic field and the scattering vector. The advantage of the flipping ratio method as compared to an unpolarized experiment stems from its enhanced sensitivity. If the magnetic intensity contribution amounts to one percent of the nuclear intensity in an unpolarized experiment, corresponding to , and assuming , the flipping ratio already amounts to 1.5, which can be easily studied.
The flipping ratio data were used to determine the spin-density distribution by performing a least square refinement of magnetization models with the program FULLPROF Rodríguez-Carvajal (1993); Frontera and Rodriguez-Carvajal (2003), and by using the maximum entropy method (MEM) and routines implemented in the Cambridge Crystallography Subroutine Library (CCSL) Gull1989 . The MEM is a model free method to reconstruct the spin density. With the program FULLPROF two models for the spin density were refined. Firstly, a simple monopole model was refined with a maximum of two parameters per magnetic atom. In this dipole approximation one parameter corresponds to the total magnetic moment and the other one to the orbital contribution. Secondly, a multipole model was applied which allows one to describe an anisotropic shape of the spin density at the Ru site. The results of the monopole and multipole refinements are summarized in TABLE I and the comparison of calculated and observed flipping ratios is shown and discussed in the Appendix. The structural data were taken from structural analyzes performed by single-crystal neutron diffraction on comparable crystals, see Ref. Kunkemöller et al. (2017a).
| 2K | Rutot | Ruorb | Oapic | Obasal | ||
|---|---|---|---|---|---|---|
| mult | 0.85(5) | / | 0.16(3) | 0.17(2) | 1.35(7) | 16.1 |
| mono | 1.35(3) | 0.36(8) | 0.20(2) | 0.20(2) | 1.95(9) | 25.2 |
| mono | 1.42(3) | / | 0.20(2) | 0.20(2) | 2.00(9) | 26.4 |
| 200K | ||||||
| mult | 0.29(2) | / | 0.09(1) | 0.06(1) | 0.50(3) | 4.2 |
| mono | 0.34(1) | 0.16(3) | 0.02(1) | .026(6) | 0.40(3) | 8.3 |
| mono | 0.37(1) | / | 0.01(1) | .019(6) | 0.42(2) | 9.2 |
The focus of this study is set on the low-temperature spin-density distribution. The dataset recorded at 2 K contains more reflections than the dataset recorded at 200 K. Additional reflections are either recorded at higher or are superstructure reflections with respect to the high-temperature ideally cubic structure in space group Fmm. The latter contain no contribution of the Ru because the higher symmetry of the Ru site excludes a contribution at any superstructure reflection. These superstructure reflection data possess a strong weight in the refinement of the oxygen contribution to the spin density. The refinement of the monopole model with the data recorded at 2 K results in a total magnetic moment at the Ru site of 1.35(3) and an orbital moment of 0.36(8) , see TABLE I. This orbital moment is much larger than values obtained by two soft XMCD studies Agrestini et al. (2015); Okamoto et al. (2007) and also our DFT calculations yield an orbital moment of only 0.007 . In the dipole approximation the entire, spin plus orbital, moment contributes to the magnetic formfactor through the spherical Bessel function of 0th order while only the orbital component also contributes through second order function . There are no radial functions available for fourvalent Ru so that the function for monovalent Ru was used in this and in other studies Gukasov et al. (2002); Granata et al. (2016). The fitted large orbital moment seems to result from the inadequacy of the function and from the pronounced anisotropies. Furthermore the monopole fit with an orbital moment is only slightly better. In these monopole models both oxygen sites carry large moments, in total about one third of the entire magnetic moment. In the multipole refinement 14 parameters were used to describe the anisotropic spin density at the Ru site, while oxygen distributions were treated as monopoles. Again about one third of the total spin density is found at the oxygen positions. These large oxygen moments result from the large hopping and the near degeneracy of the Ru and O states Mazin and Singh (1997) and are also observed in layered ruthenate compounds either by neutron diffraction Gukasov et al. (2002); Granata et al. (2016) or in the magnetic excitations by inelastic neutron-scattering experiments Kunkemöller et al. (2017b). The fraction of oxygen moments to the total moment obtained with the monopole model, 31% in our SrRuO3 experiment, can be directly compared with that observed for Ca1.5Sr0.5RuO4, 31% Gukasov et al. (2002), and that reported for Sr4Ru3O10, 33% Granata et al. (2016). The amount of transferred moment is thus very similar in these three metallic ruthenates underlining the universal character of the hybridization in ruthenates.
Addressing the anisotropic spin-density distribution demands the fit with a multipole model, which results in significantly smaller reliability values, , compared to the fit with the monopole model, see Table I and the Appendix. In Fig. 2 cuts through the spin-density distribution parallel to the orthorhombic axes can be seen. The spin density around the Ru position is clearly anisotropic. The magnetic moments on the O sites amount to 0.16(3) and 0.17(2) for the apical and basal O, respectively, again about one third of the magnetization is carried by the oxygen orbitals.
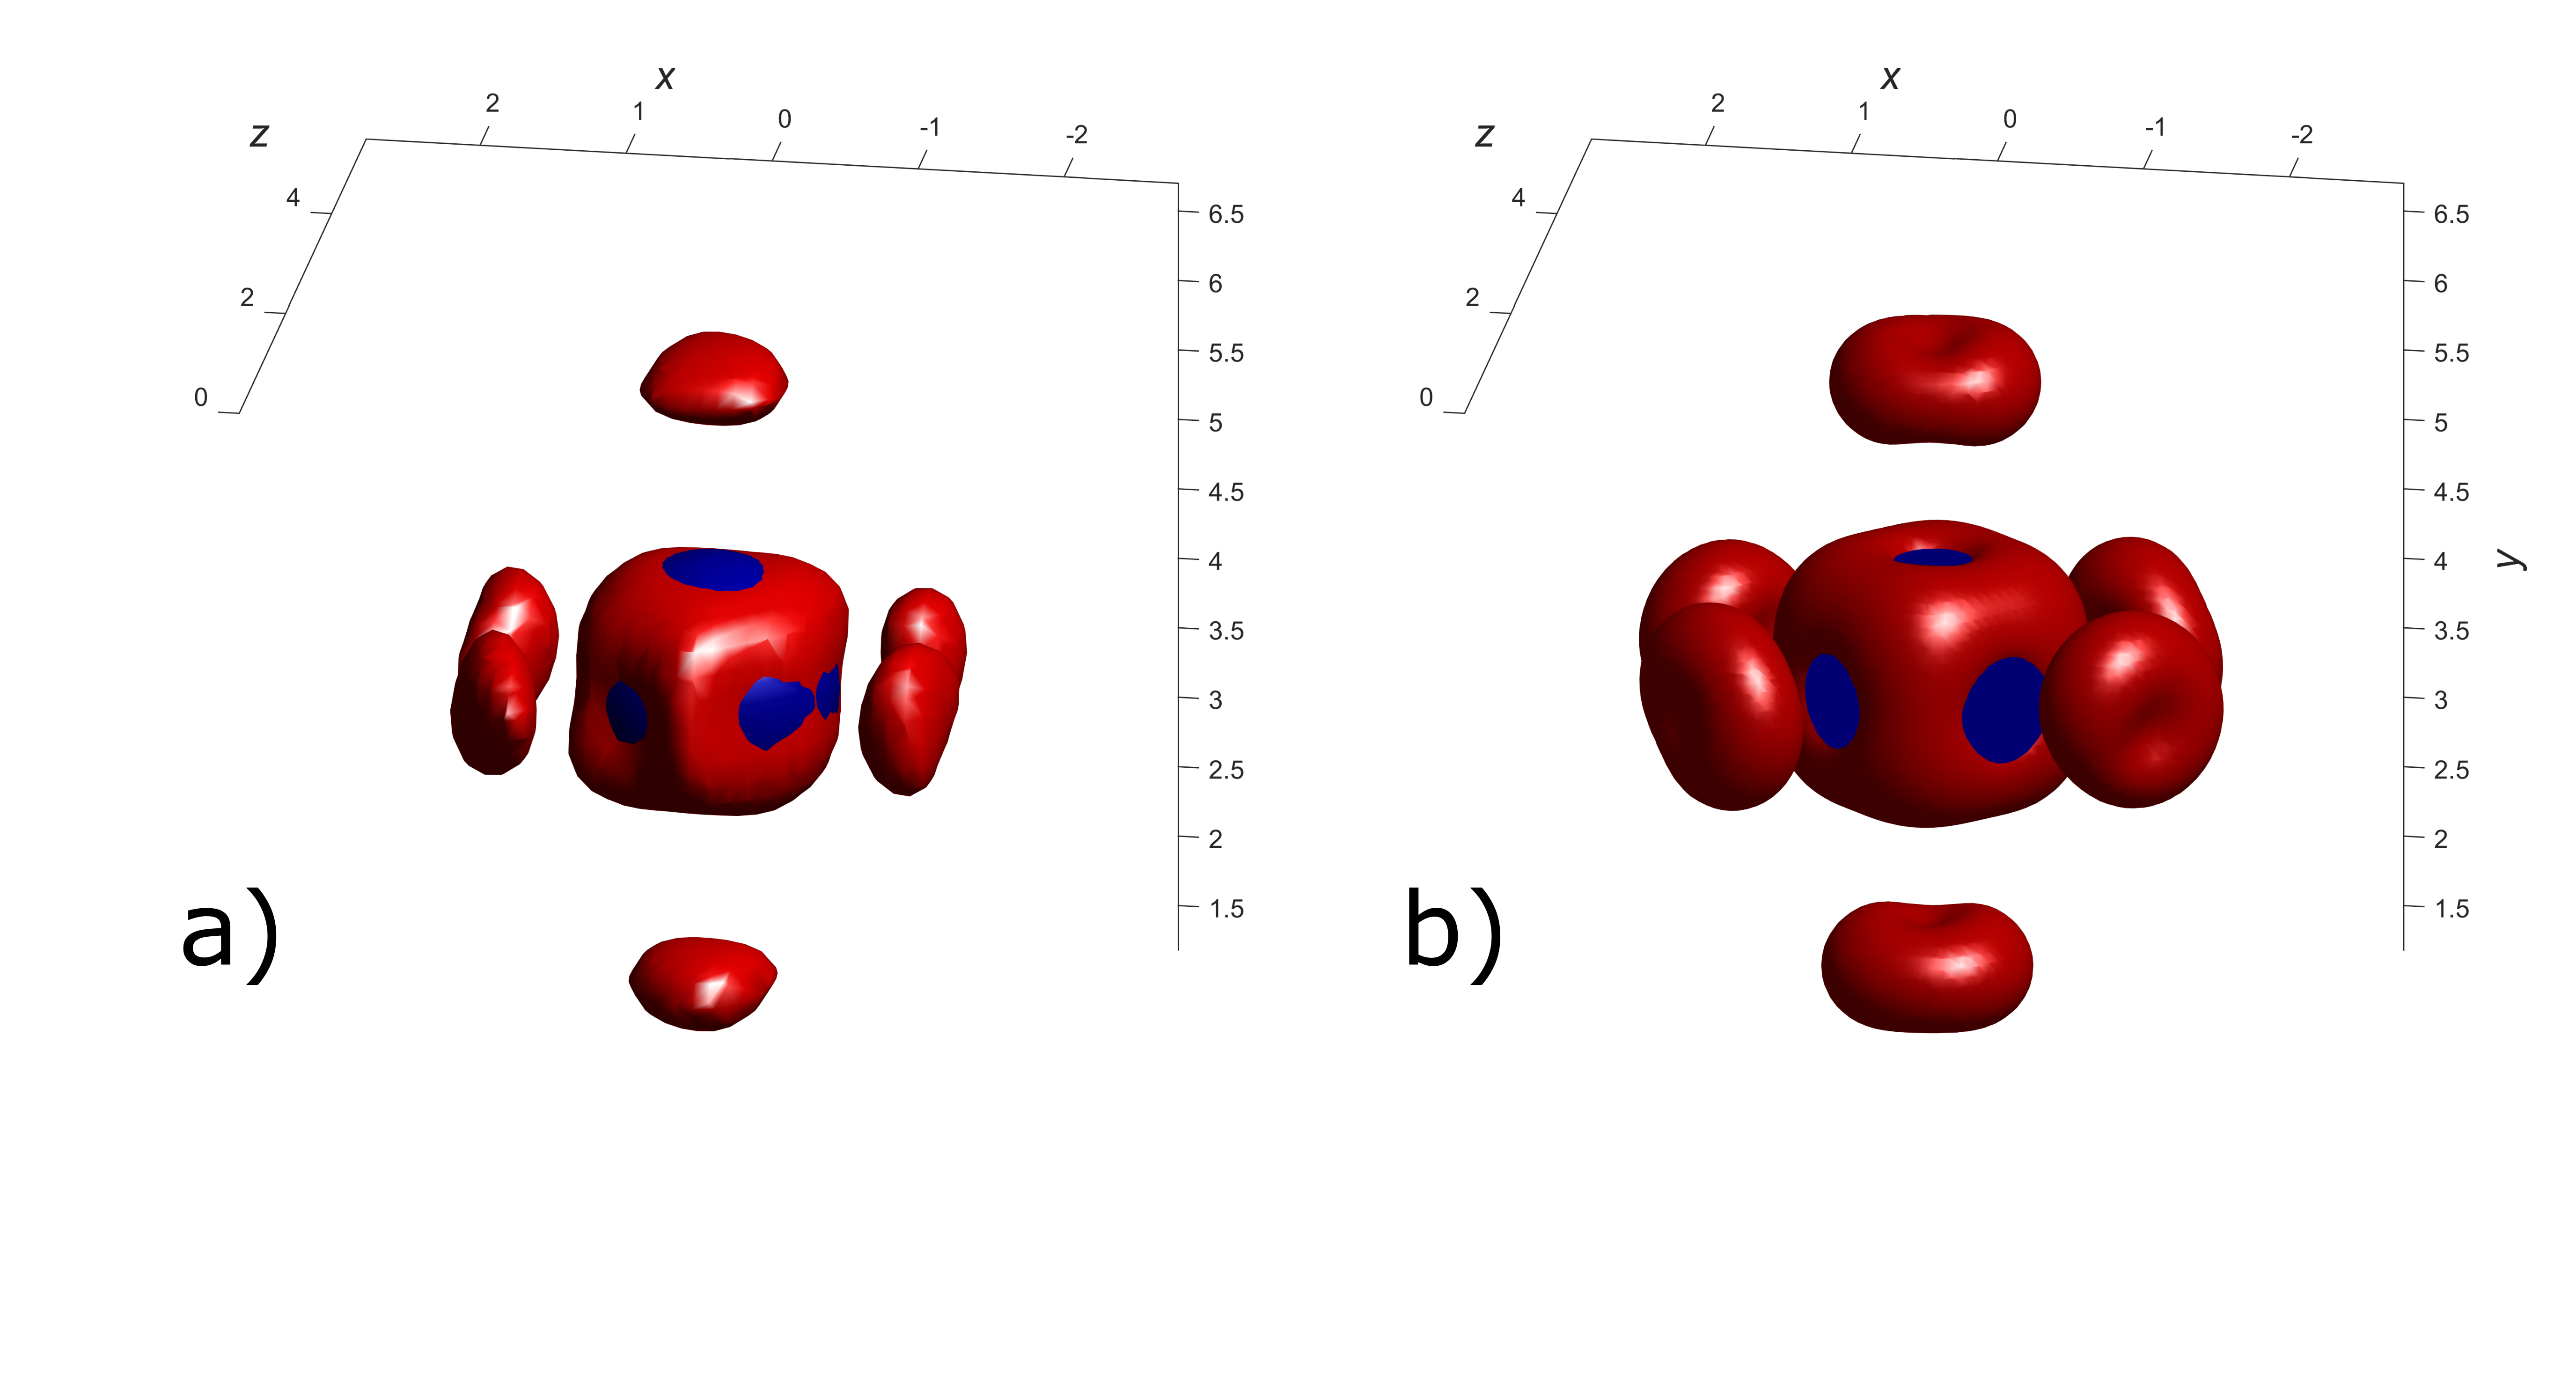
Detailed plots of the spin density distribution can be obtained by an image reconstruction using the MEM Gull1989 . The spin density is discretized into 125000 pixels, 50 in each direction, and the reconstruction algorithm was used with a conventional flat density as start map, which tends to suppress artificial spin-density peaks. From this spin-density reconstruction the total magnetic moments can be obtained by numerical integration. The radius for the Ru position is chosen to be 1.2 Å and to 0.9 Å for the O positions. This leads to magnetic moments of 0.91 at the Ru site, of 0.07 at the apical O site and of 0.12 at the basal O site. The smaller moments at the oxygen sites result from the flat start map, that acts against local moments. The study on Ca2-xSrxRuO4 in Ref. Gukasov et al. (2002) also found smaller magnetic moments with the MEM because of the negative bias against any local magnetic spin density. Keeping this tendency in mind, the observation of oxygen moments in the MEM reconstruction unambiguously confirms the sizeable magnetization carried by the oxygen orbitals. Besides the underestimation of the oxygen moments, there is an excellent agreement between the multipole refinements and the MEM reconstruction, see Fig. 2. In particular both methods also agree about the anisotropy of the spin-density distribution at the Ru site. Instead of a simple sphere we find a cube shaped distribution. In Figure 3 we show similar MEM maps along the orthorhombic diagonals, which are nearly parallel to the Ru-O bonds. Therefore, the oxygen moments become better visible in these maps. The comparison of these spin-density maps at 2K and 9T, see Fig. 3, with those at the same field and 200K, Fig. 4, indicates no qualitative differences besides the overall reduction of magnetic moments. This excludes an essential change in the character of the magnetization to occur between 200 and 2 K. Therefore, the invar effect cannot be explained by a change in the local magnetization associated with changing orbital occupation. In Fig. 5, we present a threedimensional plot of the MEM spin-density distribution for a single RuO6 octahedron in form of an isocontourplot for a magnetization-density value of 0.06Å3 at 2K and 9T. One recognizes the cube shape of the Ru spin density with the cube faces pointing perpendicular to the Ru-O bonds, while the spin density at the oxygen exhibits a disc shape with the discs being perpendicular to the bonds. All these features perfectly agree with our DFT calculations.
III.2 Spin-polarized DFT calculations
We have performed spin-polarized DFT calculations to construct the theoretical spin-density distribution, which is also visualized in figure 5. We used Perdew-Burke-Ernzerhof Perdew et al. (1996) version of the exchange-correlation potential and utilized pseudo-potential method (as realized in the VASP code Kresse and Furthmüller (1996)). The mesh in space was chosen to be . The plane wave cutoff energy was set to 600 eV. The crystal structure corresponding to T=10 K was taken from Ref. Kunkemöller et al. (2017a), but ionic positions were relaxed until total energy change between ionic iterations exceeded 10-5 eV/u.c. (unit cell consists of 4 formula units). The magnetic moments on the Ru and O ions were found to be 1.34 and 0.13-0.16 respectively (they were calculated by integration of the spin density in the atomic spheres with radii 1.25 and 0.73 ), which perfectly agrees with the experiment. Thus also in the DFT calculations about one third of the magnetization resides on the oxygen orbitals. The calculated magnetization density is compared to the one determined by the MEM algorithm in figure 5. There is excellent agreement with the experimental density concerning the strong polarization of the oxygen sites and the peculiar anisotropy of the distribution at the Ru site, see Fig. 5. The Ru anisotropy can be attributed to the nearly equal occupation of the orbitals carrying the main part of the magnetization, while orbitals are empty. In addition there is hybridization between the and the oxygen orbitals perpendicular to the bond, which perfectly explains the cubic faces of the Ru spin density as well as the disc-shaped spin density at the O positions are both perpendicular to the bonds. E.g. for a Ru-O bond along the direction the and may form bonds with oxygen and orbitals, respectively, but hybridization of the orbital is impossible for this bond.
IV Conclusions
In conclusion we have studied the spin-density distribution in the metallic ferromagnetic SrRuO3 by the flipping ratio method using polarized neutrons. The studied single crystal was first mechanically detwinned and the application of the magnetic field along the orthorhombic easy axis of the main domain results in an almost complete monodomain crystal. Due to the monodomain sample, high-quality data were obtained that can be easily analyzed in the orthorhombic structure yielding a high precision for the spin-density distribution. We may fully confirm the strong magnetic polarization of the oxygen orbitals that was deduced from early DFT calculations. Indeed about one third of the total magnetization is carried by the oxygen orbitals. Furthermore, the spin-density maps exhibit pronounced anisotropies at the Ru and oxygen sites that agree with the bonding and hybridization of the Ru and oxygen orbitals. The experimental magnetization densities including this peculiar anisotropy agrees perfectly with the calculated one. The hybridization is an essential effect in all ruthenates and even stronger effects can be expected for 5d materials. Neglecting this transfer of magnetization will result in rather incorrect determination of magnetic moments for ferromagnetic as well as for antiferromagnetic ruthenates. The absence of a qualitative temperature dependence of the anisotropic magnetization density indicates that the orbital occupation in SrRuO3 does not essentially change with temperature.
Acknowledgements.
This work was funded by the Deutsche Forschungsgemeinschaft (DFG, German Research Foundation) - Project number 277146847 - CRC 1238, projects A02 and B04. S.V.S thanks the Russian Ministry of Science and High Education, which supported the research through the program AAAA-A18-118020190095-4 (topic “Quantum”) and contract 02.A03.21.0006. We acknowledge stimulating discussions with T. Lorenz and D. Khomskii.*
Appendix A Comparison of observed and calculated flipping ratios
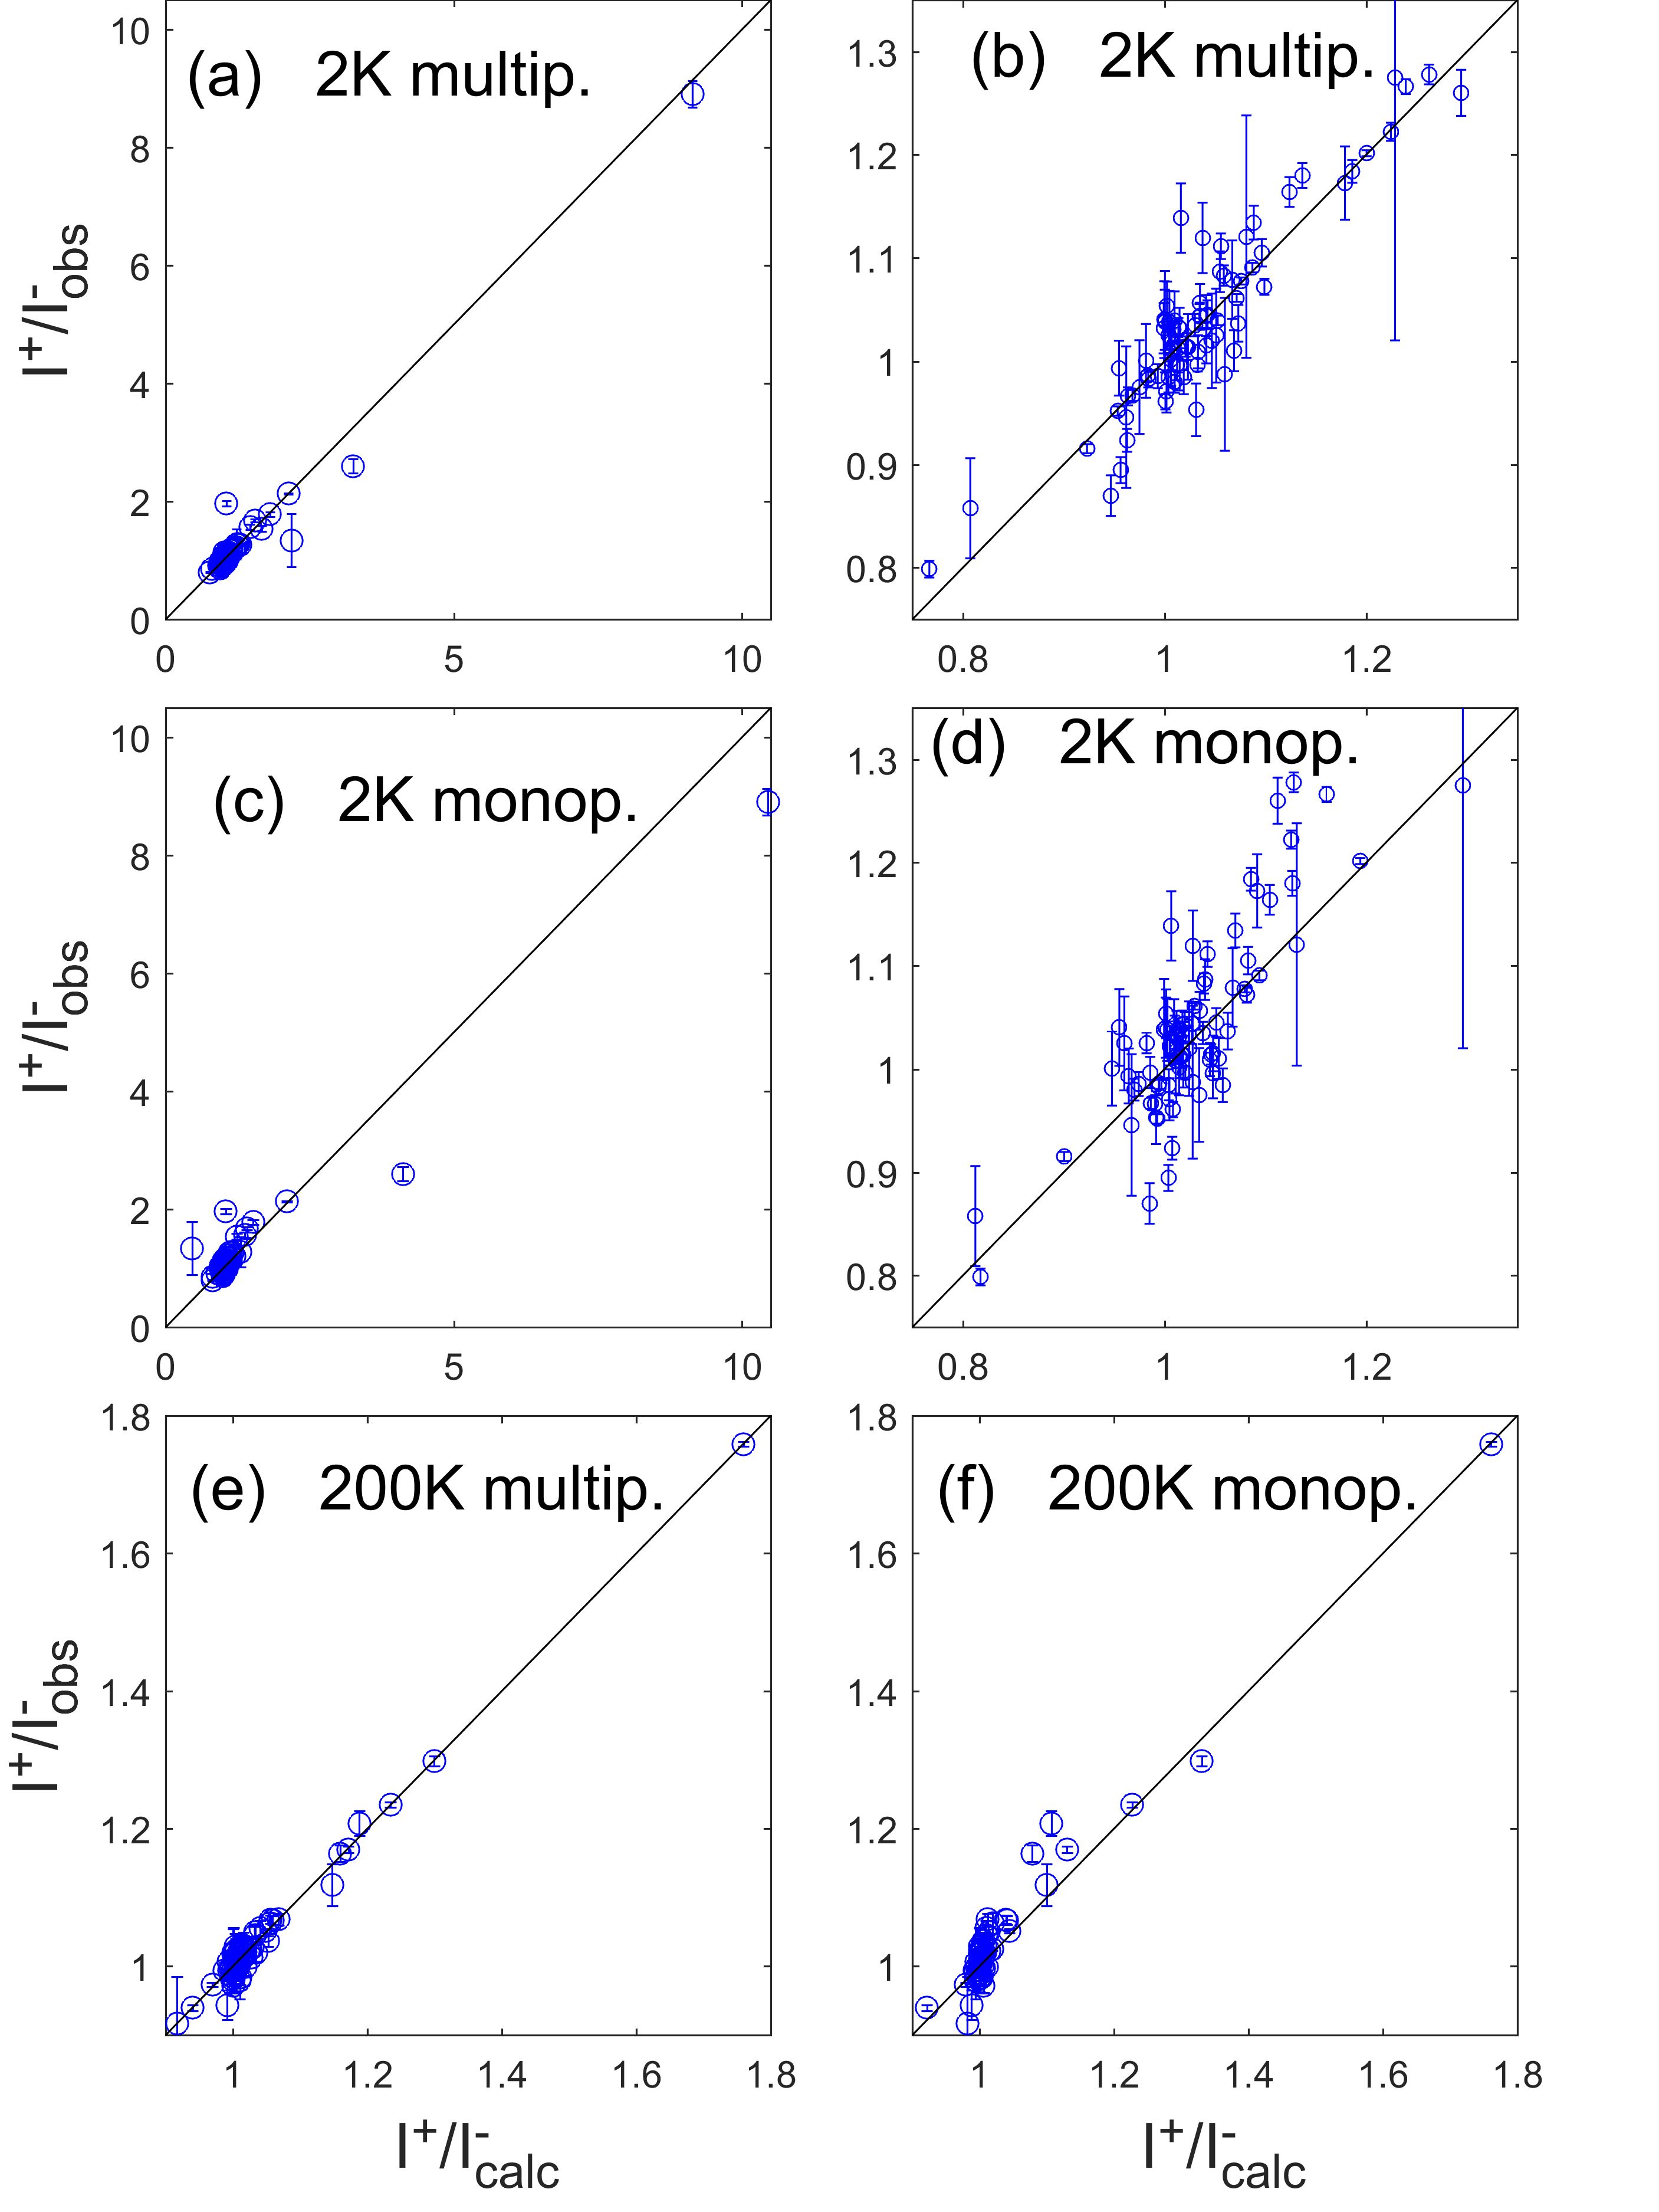
The quality of the data and the refinements can been accessed by comparing the observed flipping ratios to those calculated with monopole and multipole models at the temperatures of 2 and 200 K, see Fig. 6. For both temperatures there is a clear improvement when passing from the monopole to the multipole models. While the 200 K data set can be very well described yielding a low reliability factor for the flipping ratios subtracted by one, this value remains larger, 16% , for the more complete 2 K data set even for the multipole model. One difference results from the larger number of superstructure reflections that were recorded at low temperature, and that exhibit smaller flipping ratios due to the absence of the Ru contributions. However, this cannot fully account for the larger value at 2 K. In the multipole model we assume monopole distributions at the two oxygen sites, which is inadequate in view of the maximum entropy and the DFT analysis. Refining also the multipole distributions for the two oxygen position induces 12 more parameters, which significantly limits the precision of all parameters but reduces the value to 12.7% . Close inspection of the calculated and observed flipping ratios, see Fig. 6 (a,b), indicates that some stronger flipping ratios deviate more than their errors but that the majority of this data set is well described in the multipole model. In particular the (-141) reflection cannot be correctly described. This problem seems to arise from extinction, which becomes very anisotropic in the detwinned crystal Kunkemöller et al. (2017a). For this particular reflection extinction can suffer from nearly perfect blocks being aligned parallel to the beam. Excluding this single reflection from in total 92 (inequivalent) reflections analyzed yields =11.7% for the model with only Ru described by a multipole, and =7.0% for the complete multipole model. In the text we discuss the Ru multipole refinement with the full data set, because there are no significant changes in the two refinements with only Ru multipole distributions. Note that extinction is better corrected in the MEM procedure.
References
- Randall and Ward (1959) J. J. Randall and R. Ward, J.Am.Chem.Soc 81, 2629 (1959).
- Callaghan et al. (1966) A. Callaghan, C. W. Moeller, and R. Ward, Inorg Chem 5, 1572 (1966).
- Koster et al. (2012) G. Koster, L. Klein, W. Siemons, G. Rijnders, J. S. Dodge, C.-B. Eom, D. H. A. Blank, and M. R. Beasley, Rev. Mod. Phys. 84, 253 (2012).
- Allen et al. (1996) P. B. Allen, H. Berger, O. Chauvet, L. Forro, T. Jarlborg, A. Junod, B. Revaz, and G. Santi, Physical Review B 53, 4393 (1996).
- Klein et al. (1996) L. Klein, J. S. Dodge, C. H. Ahn, G. J. Snyder, T. H. Geballe, M. R. Beasley, and A. Kapitulnik, Phys. Rev. Lett. 77, 2774 (1996).
- Kostic et al. (1998) P. Kostic, Y. Okada, N. C. Collins, Z. Schlesinger, J. W. Reiner, L. Klein, A. Kapitulnik, T. H. Geballe, and M. R. Beasley, Phys. Rev. Lett. 81, 2498 (1998).
- Kiyama et al. (1996) T. Kiyama, K. Yoshimura, K. Kosuge, Y. Ikeda, and Y. Bando, Phys. Rev. B 54, R756 (1996).
- Izumi et al. (1997) M. Izumi, K. Nakazawa, Y. Bando, Y. Yoneda, and H. Terauchi, Journal of the Physical Society of Japan 66, 3893 (1997), http://dx.doi.org/10.1143/JPSJ.66.3893 .
- Fang et al. (2003) Z. Fang, N. Nagaosa, K. S. Takahashi, A. Asamitsu, R. Mathieu, T. Ogasawara, H. Yamada, M. Kawasaki, Y. Tokura, and K. Terakura, Science 302, 92 (2003), http://www.sciencemag.org/content/302/5642/92.full.pdf .
- Kats et al. (2004) Y. Kats, I. Genish, L. Klein, J. W. Reiner, and M. R. Beasley, Phys. Rev. B 70, 180407 (2004).
- Haham et al. (2011) N. Haham, Y. Shperber, M. Schultz, N. Naftalis, E. Shimshoni, J. W. Reiner, and L. Klein, Phys. Rev. B 84, 174439 (2011).
- Itoh et al. (2016) S. Itoh, Y. Endoh, T. Yokoo, S. Ibuka, J.-G. Park, Y. Kaneko, K. S. Takahashi, Y. Tokura, and N. Nagaosa, Nature Communications 7, 11788 (2016).
- Chen et al. (2013) Y. Chen, D. L. Bergman, and A. A. Burkov, Phys. Rev. B 88, 125110 (2013).
- (14) K. Jenni, S. Kunkemöller, D. Brüning, T. Lorenz, Y. Sidis, A. Schneidewind, A. A. Nugroho, A. Rosch, D. I. Khomskii, M. Braden, Phys. Rev. Lett. 123, 017202 (2019)..
- Kunkemöller et al. (2017a) S. Kunkemöller, D. Brüning, A. Stunault, A. A. Nugroho, T. Lorenz, and M. Braden, Phys. Rev. B 96, 220406 (2017a).
- Langner et al. (2009) M. C. Langner, C. L. S. Kantner, Y. H. Chu, L. M. Martin, P. Yu, J. Seidel, R. Ramesh, and J. Orenstein, Phys. Rev. Lett. 102, 177601 (2009).
- Kanbayasi (1976) A. Kanbayasi, Journal of the physical society of japan 41, 1876 (1976).
- Cao et al. (1997) G. Cao, S. McCall, M. Shepard, J. E. Crow, and R. P. Guertin, Phys. Rev. B 56, 2916 (1997).
- Kunkemöller et al. (2016) S. Kunkemöller, F. Sauer, A. A. Nugroho, and M. Braden, Crystal Research and Technology 51, 299 (2016).
- Jones et al. (1989) C. W. Jones, P. D. Battle, P. Lightfoot, and W. T. A. Harrison, Acta Crystallographica Section C 45, 365 (1989).
- Chakoumakos et al. (1998) B. Chakoumakos, S. Nagler, S. Misture, and H. Christen, Physica B 241-243, 358 (1998).
- Lee et al. (2013) S. Lee, J. R. Zhang, S. Torii, S. Choi, D.-Y. Cho, T. Kamiyama, J. Yu, K. A. McEwen, and J.-G. Park, Journal of Physics: Condensed Matter 25, 465601 (2013).
- Bushmeleva et al. (2006) S. Bushmeleva, V. Pomjakushin, E. Pomjakushina, D. Sheptyakov, and A. Balagurov, Journal of Magnetism and Magnetic Materials 305, 491 (2006).
- Palai et al. (2009) R. Palai, H. Huhtinen, J. F. Scott, and R. S. Katiyar, Phys. Rev. B 79, 104413 (2009).
- Sow et al. (2012) C. Sow, D. Samal, P. S. A. Kumar, A. K. Bera, and S. M. Yusuf, Phys. Rev. B 85, 224426 (2012).
- Etz et al. (2012) C. Etz, I. V. Maznichenko, D. Böttcher, J. Henk, A. N. Yaresko, W. Hergert, I. I. Mazin, I. Mertig, and A. Ernst, Phys. Rev. B 86, 064441 (2012).
- Zhang and Pavarini (2017) G. Zhang and E. Pavarini, Phys. Rev. B 95, 075145 (2017).
- Worledge and Geballe (2000) D. C. Worledge and T. H. Geballe, Phys. Rev. Lett. 85, 5182 (2000).
- Agrestini et al. (2015) S. Agrestini, Z. Hu, C.-Y. Kuo, M. W. Haverkort, K.-T. Ko, N. Hollmann, Q. Liu, E. Pellegrin, M. Valvidares, J. Herrero-Martin, P. Gargiani, P. Gegenwart, M. Schneider, S. Esser, A. Tanaka, A. C. Komarek, and L. H. Tjeng, Phys. Rev. B 91, 075127 (2015).
- Okamoto et al. (2007) J. Okamoto, T. Okane, Y. Saitoh, K. Terai, S.-I. Fujimori, Y. Muramatsu, K. Yoshii, K. Mamiya, T. Koide, A. Fujimori, Z. Fang, Y. Takeda, and M. Takano, Phys. Rev. B 76, 184441 (2007).
- Baskaran (1996) G. Baskaran, Physica B: Condensed Matter 223, 490 (1996).
- Rice and Sigrist (1995) T. Rice and M. Sigrist, J. Phys.: Cond. Matter 7, L643 (1995).
- Steffens et al. (2019) P. Steffens, Y. Sidis, J. Kulda, Z. Q. Mao, Y. Maeno, I. I. Mazin, and M. Braden, Phys. Rev. Lett. 122, 047004 (2019).
- (34) T. Moriya, Spin Fluctuations in Itinerant Electron Magnetism, Springer-Verlag Berlin Heidelberg (1985).
- Mazin and Singh (1997) I. I. Mazin and D. J. Singh, Phys. Rev. B 56, 2556 (1997).
- (36) I. Eremin, D. Manske, S. G. Ovchinnikov, and J. F. Annett, Ann. Phys. 13, 149 (2004).
- Mazin and Singh (1999) I. I. Mazin and D. J. Singh, Phys. Rev. Lett. 82, 4324 (1999).
- Gukasov et al. (2002) A. Gukasov, M. Braden, R. J. Papoular, S. Nakatsuji, and Y. Maeno, Phys. Rev. Lett. 89, 087202 (2002).
- Granata et al. (2016) V. Granata, L. Capogna, F. Forte, M.-B. Lepetit, R. Fittipaldi, A. Stunault, M. Cuoco, and A. Vecchione, Phys. Rev. B 93, 115128 (2016).
- (40) https://www.mlz-garching.de/kompass
- (41) S. Kunkemöller, M. Braden and A. Stunnault; Institut Laue-Langevin (ILL) doi:10.5291/ILL-DATA.5-51-519 .
- (42) J. Schweizer, in Neutron Scattering from Magnetic Materials, Editor T. Chatterji, Elsevier Amsterdam (2006).
- Rodríguez-Carvajal (1993) J. Rodríguez-Carvajal, Physica B: Condensed Matter 192, 55 (1993).
- Frontera and Rodriguez-Carvajal (2003) C. Frontera and J. Rodriguez-Carvajal, Physica B: Condensed Matter 335, 219 (2003), proceedings of the Fourth International Workshop on Polarised Neutrons for Condensed Matter Investigations.
- (45) S. F. Gull and J. Skilling, MEMSYS III Quantified Maximum Entropy Subroutine Library, Meldreth UK (1989).
- (46) In the Fullprof suite the density maps are calculated by generating a large set of structure factors from the multipole model and Fourier transforming these.
- Kunkemöller et al. (2017b) S. Kunkemöller, E. Komleva, S. V. Streltsov, S. Hoffmann, D. I. Khomskii, P. Steffens, Y. Sidis, K. Schmalzl, and M. Braden, Phys. Rev. B 95, 214408 (2017b).
- Perdew et al. (1996) J. P. Perdew, K. Burke, and M. Ernzerhof, Phys. Rev. Lett. 77, 3865 (1996).
- Kresse and Furthmüller (1996) G. Kresse and J. Furthmüller, Phys. Rev. B 54, 11169 (1996).