A global economic policy uncertainty index from principal component analysis
Abstract
This paper constructs a global economic policy uncertainty index through the principal component analysis of the economic policy uncertainty indices for twenty primary economies around the world. We find that the PCA-based global economic policy uncertainty index is a good proxy for the economic policy uncertainty on a global scale, which is quite consistent with the GDP-weighted global economic policy uncertainty index. The PCA-based economic policy uncertainty index is found to be positively related with the volatility and correlation of the global financial market, which indicates that the stocks are more volatile and correlated when the global economic policy uncertainty is higher. The PCA-based global economic policy uncertainty index performs slightly better because the relationship between the PCA-based uncertainty and market volatility and correlation is more significant.
keywords:
Economic policy uncertainty; Principal component analysis; Volatility; Correlation JEL Classification: D80, G18, E661 Introduction
The study on uncertainty has attracted much attention (Bloom, 2009). Pástor and Veronesi (2012) and Pástor and Veronesi (2013) develop a general equilibrium model to study how changes in government policy choice affect stock prices and explore the relationship between political uncertainty and stock risk premium. Baker et al. (2016) construct an index as the proxy for economic policy uncertainty (EPU) in the United States and 11 other major economies, which was initially put forward by Baker et al. (2013). Many scholars, such as Moore (2017) and Arbatli et al. (2017), construct other indices for different economies successively using the same method. Bontempi et al. (2016) introduce a new uncertainty indicator based on Internet searches. Castelnuovo and Tran (2017) develop uncertainty indices for the United States and Australia, which are based on Google Trends data.
Many papers have studied the influence of economic policy uncertainty on the international financial markets. Li et al. (2015) investigate the impacts of economic policy uncertainty shocks on stock-bond correlations for the financial market in United States. Klößner and Sekkel (2014) discuss international spillovers of policy uncertainty using the EPU indices from six developed economies. Brogaard and Detzel (2015) use a search-based measure to capture economic policy uncertainty for 21 economies, and found economic policy uncertainty has a significant effect on the contemporaneous market returns and volatility.
Recently, the aggregate global economic policy uncertainty (GEPU) has been proposed and investigated. Davis (2016) constructs an index of global economic policy uncertainty which is a GDP-weighted average of national EPU indices for 20 economies. Fang et al. (2018) examine whether the GDP-based GEPU index provides predictability for the gold futures market volatility. Ersan et al. (2019) access the effect of the GDP-based GEPU index on the stock returns of travel and leisure companies.
For a financial market with multiple assets, the largest eigenvalue of the correlation matrix of returns, when normalized by the number of assets, quantifies the systemic risk of the market, while its eigenvector reflects the whole movement of the market (Plerou et al., 2002; Shapira et al., 2009; Kenett et al., 2010; Song et al., 2011; Kritzman et al., 2011; Billio et al., 2012; Meng et al., 2014; Dai et al., 2016; Han et al., 2017; Sandoval Jr., 2017; Emmert-Streib et al., 2018). Inspired by these studies, we construct an alternative index for the aggregate global economic policy uncertainty based on the principal component analysis. In addition, we explore the effect of global economic policy uncertainty on the volatility and correlation of the global stock market.
2 Data
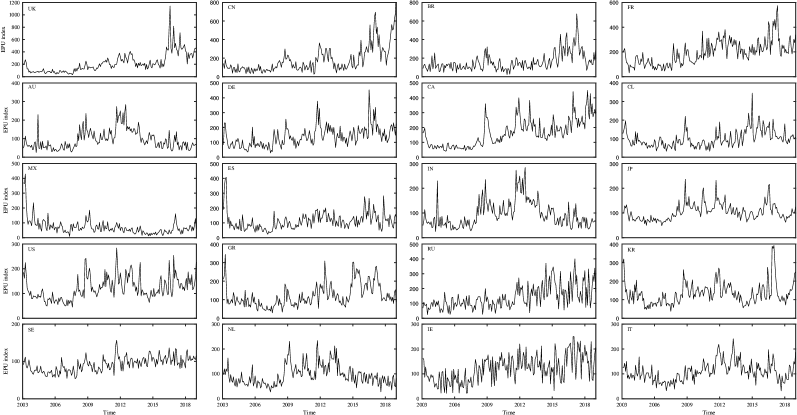
In order to calculate the PCA-based GEPU index, we retrieve the economic policy uncertainty indices for twenty economies from http://www.policyuncertainty.com. These twenty economies are Australia (AU), Brazil (BR), Canada (CA), Chile (CL), China (CN), France (FR), Germany (DE), Greece (GR), India (IN), Ireland (IE), Italy (IT), Japan (JP), Mexico (MX), the Netherlands (NL), Russia (RU), South Korea (KR), Spain (ES), Sweden (SE), the United Kingdom (UK), and the United States (US), which are in perfect accordance with the economies that Davis (2016) apply to construct the GDP-based GEPU index. Fig. 1 shows the evolution of these EPU indices from January 2003 to December 2018, where each index includes 192 monthly observations.
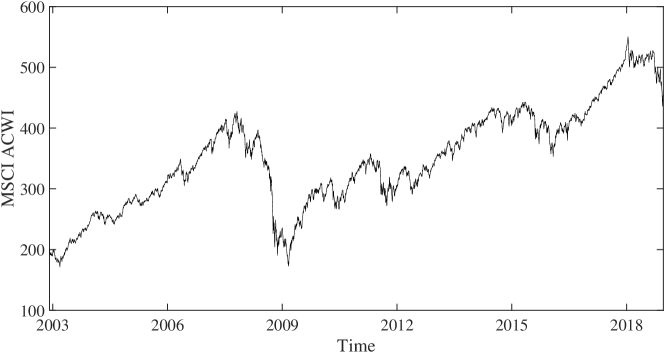
In terms of the global financial market, we select MSCI’s All Country World Index (ACWI) as its measure. The MSCI ACWI represents the performance of the stocks across 23 developed and 24 emerging markets. Fig. 2 displays the trend of MSCI ACWI, which covers the daily closing prices from December 2002 to December 2018. The composite indices for each market (from Bloomberg) are utilized to evaluate the correlations between markets also using the daily closing prices from December 2002 to December 2018.
3 Methodology
First, we normalize the EPU index for each economy over a moving window of size :
| (1) |
where represents the index for the th economy in the -th month and is the standard deviation of . Second, we obtain the cross-correlation matrix by computing the pairwise cross-correlation coefficient between any two EPU indices for the economies:
| (2) |
By definition, the elements vary from to , where corresponds to a perfect positive cross-correlation, corresponds to a perfect anti-correlation, and reflects no cross-correlations between the indices for economy and economy . The cross-correlation matrix can also be expressed in the matrix form:
| (3) |
where is an matrix with elements and denotes the transpose of . Third, we obtain the eigenvector for the largest eigenvalue of the cross-correlation matrix in the -th window:
| (4) |
where . Finally, we construct the PCA-based GEPU index by the eigenportfolio of the economic policy uncertainty indices for the economies:
| (5) |
where .
4 Empirical results
In order to examine the robustness of the results, we construct the PCA-based GEPU index for five window sizes , and months. Fig. 3 displays the comparison between the GEPU-PCA and GEPU-GDP indices for months. We find that the evolutionary trajectories of the GEPU-GDP and GEPU-PCA indices are close to each other, which is also indicated by the nice linearity of the data points in the corresponding scatter plot. The results for other window sizes are very similar. Overall, all the GEPU-PCA indices are very close to the GEPU-GDP indices, although GEPU-PCA is obtained without using any other economic data. The discrepancy between the two indices increases when the uncertainty is high.
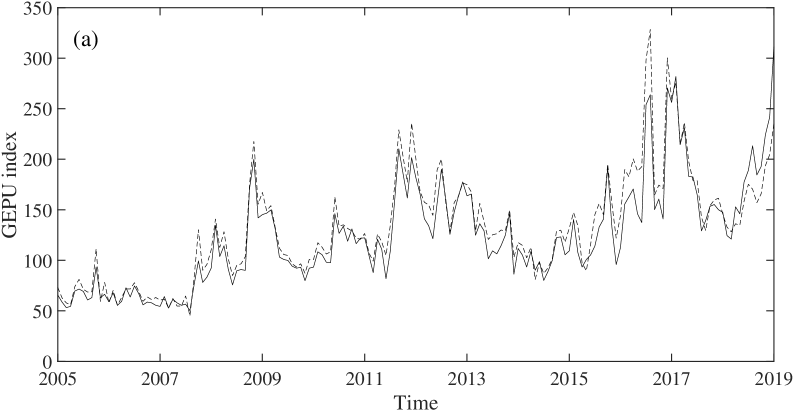
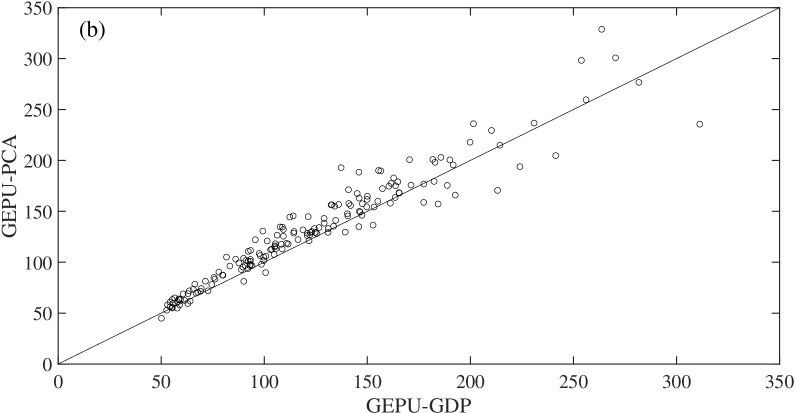
Table 1 shows the correlation coefficients between GEPU-PCA and GEPU-GDP for different window sizes , all of which are greater than 0.94. The window size seems to have no impact on the correlation.
| Obs. | Correlation | ||
|---|---|---|---|
| 24 M | 2004.12 | 169 | 0.9572 |
| 30 M | 2005.06 | 163 | 0.9521 |
| 36 M | 2005.12 | 157 | 0.9417 |
| 42 M | 2006.06 | 151 | 0.9473 |
| 48 M | 2007.12 | 145 | 0.9525 |
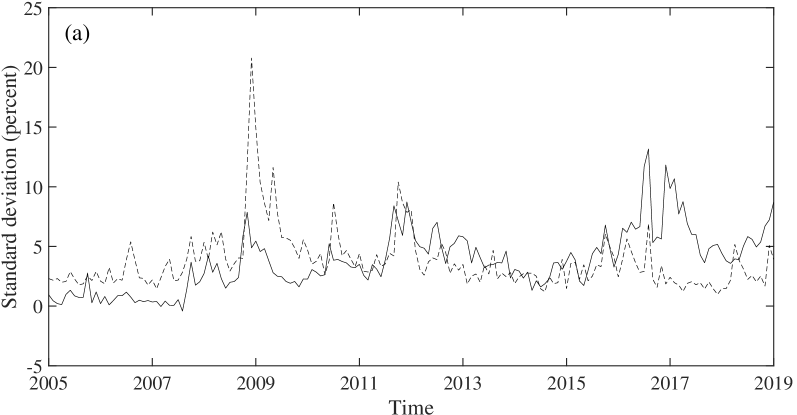
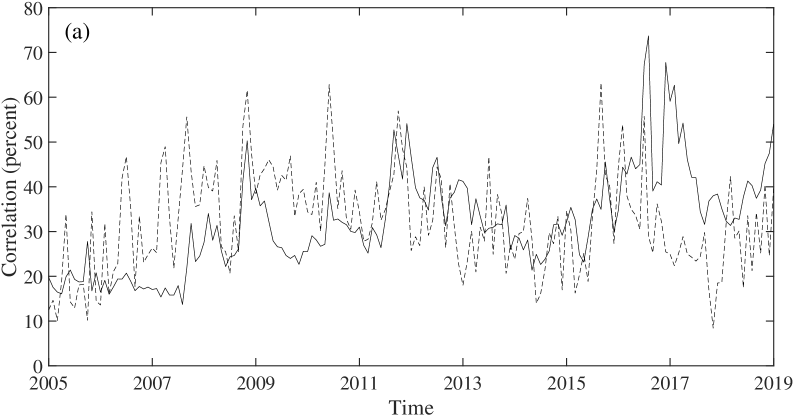
Pástor and Veronesi (2013) provide the theoretical foundation for the positive relations between economic policy uncertainty and both volatility and correlation and conduct an empirical analysis in the American market with the results supporting the theoretical arguments. To verify that this association does also exist in the global market, GEPU-PCA and GEPU-GDP are respectively used as proxy for global economic policy uncertainty. Fig. 4 reveals the strong correlation between GEPU-PCA and the two variables about the global market, especially in the first half of the samples.
For the sake of a comparative analysis, we adopt the same empirical models as Pástor and Veronesi (2013). For volatility, we employ the following regressions:
| (6) |
| (7) |
where represents the volatility. For correlation, the following regressions are considered:
| (8) |
| (9) |
where stands for the correlation. The lagged terms, and , eliminate most of the autocorrelation in the dependent variable series.
| Panel A: Volatility | |||||
|---|---|---|---|---|---|
| Obs. | Eq. (6) | Eq. (7) | Eq. (6) | Eq. (7) | |
| GEPU-PCA | GEPU-GDP | ||||
| 169 | 0.0018 | 0.0010 | 0.0017 | 0.0011 | |
| (3.02) | (2.23) | (2.70) | (2.17) | ||
| 163 | 0.0017 | 0.0010 | 0.0016 | 0.0011 | |
| (2.74) | (2.09) | (2.50) | (2.09) | ||
| 157 | 0.0015 | 0.0009 | 0.0016 | 0.0011 | |
| (2.36) | (1.88) | (2.31) | (2.01) | ||
| 151 | 0.0014 | 0.0009 | 0.0015 | 0.0011 | |
| (2.11) | (1.81) | (2.12) | (1.95) | ||
| 145 | 0.0013 | 0.0009 | 0.0015 | 0.0011 | |
| (1.89) | (1.71) | (1.96) | (1.87) | ||
| Panel B: Correlation | |||||
| Obs. | Eq. (8) | Eq. (9) | Eq. (8) | Eq. (9) | |
| GEPU-PCA | GEPU-GDP | ||||
| 169 | 0.0459 | 0.0194 | 0.0377 | 0.0163 | |
| (2.88) | (1.36) | (2.30) | (1.14) | ||
| 163 | 0.0311 | 0.0127 | 0.0262 | 0.0112 | |
| (1.96) | (0.90) | (1.58) | (0.77) | ||
| 157 | 0.0152 | 0.0051 | 0.0154 | 0.0063 | |
| (0.97) | (0.37) | (0.99) | (0.43) | ||
| 151 | 0.0017 | 0.0003 | 0.0067 | 0.0038 | |
| (0.10) | (0.02) | (0.39) | (0.25) | ||
| 145 | -0.0063 | -0.0054 | 0.0020 | -0.0005 | |
| (-0.04) | (-0.04) | (0.11) | (-0.03) | ||
Table 2 reports the estimates of and their -statistics in all the forty regressions. Panel A shows that in all twenty regressions and all the 20 point estimates are significant at the level, which provides strong evidence for the theoretical foundation that the global market should be more volatile when there is higher economic policy uncertainty. Panel B presents weaker supporting evidence for the associated theoretical foundation since only three point estimates of are at the level although is positive in 17 of the 20 regressions.
We also find that after removing the autocorrelation in the volatility and correlation, the coefficient decreases. In addition, in most cases, increases with increasing sample length, except for GEPU-GDP versus volatility using Eq. (9) in which is independent of the sample length. Indeed, we argue that this trending phenomenon is caused by the fact that the correlation is stronger between market volatility (or correlation) and uncertainty in early years, as shown in Fig. 4.
5 Conclusions
This paper constructs a novel index of global economic policy uncertainty based on the principal component analysis. This index is shown to be quite close to the GDP-weighted average global economic policy uncertainty index. We employ both GEPU-PCA and GEPU-GDP as the proxies for uncertainty to investigate the association between the global financial market and economic policy uncertainty and find that the global market should be more volatile and correlated when there is higher economic policy uncertainty. Moreover, GEPU-PCA performs lightly better than GEPU-GDP when the observations are enough in the sense that the correlations are more significant when GEPU-PCA is adopted in the analysis.
Acknowledgements
This work was supported by the National Natural Science Foundation of China (Grants No. 71532009, U1811462, 71790594), the Fundamental Research Funds for the Central Universities, and Tianjin Development Program for Innovation and Entrepreneurship.
References
- Arbatli et al. (2017) Arbatli, E.C., Davis, S.J., Ito, A., Miake, N., Saito, I., 2017. Policy uncertainty in Japan. IMF Working Paper doi:10.5089/9781484300671.001.
- Baker et al. (2013) Baker, S.R., Bloom, N., Davis, S.J., 2013. Measuring economic policy uncertainty. Chicago Booth Research Paper.
- Baker et al. (2016) Baker, S.R., Bloom, N., Davis, S.J., 2016. Measuring economic policy uncertainty. Quart. J. Econ. 131, 1593–1636. doi:10.1093/qje/qjw024.
- Billio et al. (2012) Billio, M., Getmansky, M., Lo, A.W., Pelizzon, L., 2012. Econometric measures of connectedness and systemic risk in the finance and insurance sectors. J. Financ. Econ. 104, 535–559. doi:10.1016/j.jfineco.2011.12.010.
- Bloom (2009) Bloom, N., 2009. The impact of uncertainty shocks. Econometrica 77, 623–685. doi:10.3982/ECTA6248.
- Bontempi et al. (2016) Bontempi, M.E., Golinelli, R., Squadrani, M., 2016. A new index of uncertainty based on internet searches: a friend or foe of other indicators? Quaderni-Working Paper DSE N. 1062 doi:10.2139/ssrn.2746346.
- Brogaard and Detzel (2015) Brogaard, J., Detzel, A., 2015. The asset-pricing implications of government economic policy uncertainty. Manag. Sci. 61, 3–18. doi:10.1287/mnsc.2014.2044.
- Castelnuovo and Tran (2017) Castelnuovo, E., Tran, T.D., 2017. Google it up! A google trends-based uncertainty index for the United States and Australia. Econ. Lett. 161, 149–153. doi:10.1016/j.econlet.2017.09.032.
- Dai et al. (2016) Dai, Y.H., Xie, W.J., Jiang, Z.Q., Jiang, G.J., Zhou, W.X., 2016. Correlation structure and principal components in the global crude oil market. Empir. Econ. 51, 1501–1519. doi:10.1007/s00181-015-1057-1.
- Davis (2016) Davis, S., 2016. An index of global economic policy uncertainty. Technical Report. NBER Working Paper No.22740. doi:10.3386/w22740.
- Emmert-Streib et al. (2018) Emmert-Streib, F., Musa, A., Baltakys, K., Kanniainen, J., Tripathi, S., Yli-Harja, O., Jodlbauer, H., Dehmer, M., 2018. Computational analysis of structural properties of economic and financial networks. J. Network Theory Financ. 4, 1–32. doi:10.21314/JNTF.2018.043.
- Ersan et al. (2019) Ersan, O., Akron, S., Demir, E., 2019. The effect of European and global uncertainty on stock returns of travel and leisure companies. Tourism Econ. 25, 51–66. doi:10.1177/1354816618792398.
- Fang et al. (2018) Fang, L., Chen, B., Yu, H., Qian, Y., 2018. The importance of global economic policy uncertainty in predicting gold futures market volatility: A garch-midas approach. J. Financ. Markets 38, 413–422. doi:10.1002/fut.21897.
- Han et al. (2017) Han, R.Q., Xie, W.J., Xiong, X., Zhang, W., Zhou, W.X., 2017. Market correlation structure changes around the Great Crash: A random matrix theory analysis of the Chinese stock market. Fluct. Noise Lett. 16, 1750018. doi:10.1142/S0219477517500183.
- Kenett et al. (2010) Kenett, D.Y., Tumminello, M., Madi, A., Gur-Gershgoren, G., Mantegna, R.N., Ben-Jacob, E., 2010. Dominating clasp of the financial sector revealed by partial correlation analysis of the stock market. PLoS One 5, e15032. doi:10.1371/journal.pone.0015032.
- Klößner and Sekkel (2014) Klößner, S., Sekkel, R., 2014. International spillovers of policy uncertainty. Econ. Lett. 124, 508–512. doi:10.1016/j.econlet.2014.07.015.
- Kritzman et al. (2011) Kritzman, M., Li, Y.Z., Page, S., Rigobon, R., 2011. Principal components as a measure of systemic risk. J. Portf. Manag. 37, 112–126. doi:10.3905/jpm.2011.37.4.112.
- Li et al. (2015) Li, X.M., Zhang, B., Gao, R., 2015. Economic policy uncertainty shocks and stock-bond correlations: Evidence from the US market. Econ. Lett. 132, 91–96. doi:10.1016/j.econlet.2015.04.013.
- Meng et al. (2014) Meng, H., Xie, W.J., Jiang, Z.Q., Podobnik, B., Zhou, W.X., Stanley, H.E., 2014. Systemic risk and spatiotemporal dynamics of the US housing market. Sci. Rep. 4, 3655. doi:10.1038/srep03655.
- Moore (2017) Moore, A., 2017. Measuring economic uncertainty and its effects. Econ. Rec. 93, 550–575. doi:10.1111/1475-4932.12356.
- Pástor and Veronesi (2012) Pástor, L., Veronesi, 2012. Uncertainty about government policy and stock prices. J. Financ. 67, 1219–1264. doi:10.1111/j.1540-6261.2012.01746.x.
- Pástor and Veronesi (2013) Pástor, L., Veronesi, 2013. Political uncertainty and risk premia. J. Financ. Econ. 110, 520–545. doi:10.1016/j.jfineco.2013.08.007.
- Plerou et al. (2002) Plerou, V., Gopikrishnan, P., Rosenow, B., Amaral, L.A.N., Guhr, T., Stanley, H.E., 2002. Random matrix approach to cross correlations in financial data. Phys. Rev. E 65, 066126. doi:10.1103/PhysRevE.65.066126.
- Sandoval Jr. (2017) Sandoval Jr., L., 2017. Networks of log returns and volatilities of international stock market indexes. J. Network Theory Financ. 3, 41–82. doi:10.21314/JNTF.2017.033.
- Shapira et al. (2009) Shapira, Y., Kenett, D., Ben-Jacob, E., 2009. The Index cohesive effect on stock market correlations. Eur. Phys. J. B 72, 657–669. doi:10.1140/epjb/e2009-00384-y.
- Song et al. (2011) Song, D.M., Tumminello, M., Zhou, W.X., Mantegna, R.N., 2011. Evolution of worldwide stock markets, correlation structure, and correlation-based graphs. Phys. Rev. E 84, 026108. doi:10.1103/PhysRevE.84.026108.