VER J2227+608: A Hadronic PeVatron Pulsar Wind Nebula ?
Abstract
We report the detection of GeV -ray emission from the very-high-energy (VHE) -ray source VER J2227+608 associated with the “tail” region of SNR G106.3+2.7. The GeV -ray emission is extended and spatially coincident with molecular clouds traced by CO emission. The broadband GeV to TeV emission of VER J2227+608 can be well fitted by a single power-law function with an index of 1.900.04, without obvious indication of spectral cutoff toward high energies. The pure leptonic model for the -ray emission can be marginally ruled out by the X-ray and TeV data. In the hadronic model, the low energy content of CRs and the hard -ray spectrum, in combination with the center-bright source structure, suggest that VER J2227+608 may be powered by the PWN instead of shocks of the SNR. And the cutoff energy of the proton distribution needs to be higher than 400 TeV, which makes it an attractive PeVatron candidate. Future observations by the upcoming Large High Altitude Air Shower Observatory (LHAASO) and the Cherenkov Telescope Array in the north (CTA-North) could distinguish these models and constrain the maximum energy of cosmic rays in supernova remnants.
=1 \fullcollaborationNameThe Friends of AASTeX Collaboration
1 Introduction
It is widely believed that supernova remnants (SNRs) are the dominant accelerators of Galactic cosmic rays (CRs). The acceleration of electrons to hundreds of TeV energies has been supported by the detection of non-thermal synchrotron X-ray emission (Koyama et al., 1995). In the -ray band, Fermi-LAT and several ground-based Cherenkov telescopes, like HESS, VERITAS, MAGIC, etc, have detected tens of SNRs. Especially, the -ray emission of SNRs IC 443 and W44 observed by Fermi-LAT provides direct evidence for proton acceleration in SNRs (Ackermann et al., 2013). However, we still lack direct observational evidence for CRs in SNRs up to the spectral knee. Pulsar wind nebulae (PWNe) driven by the central pulsars are also important particle accelerators and a large amount of PWNe have been detected in the -ray band (Abramowski et al., 2012; Xin et al., 2018). High-energy particles can be accelerated at the termination shocks of PWNe. In particular, GeV flares from the Crab nebula show that it can accelerate electrons to PeV energy (Balbo et al., 2011), implying that PWNe could be important contributors to VHE Galactic CRs.
SNR G106.3+2.7 was first discovered by the northern Galactic plane survey of the Dominion Radio Astrophysical Observatory (DRAO) at 408 MHz(Joncas & Higgs, 1990). Pineault & Joncas (2000) later found that it has a comet-shaped radio morphology with the spectral index , where the flux density S. G106.3+2.7 consists of two distinct regions, a compact “head” region produced by the SNR shock interacting with the ambient dense material and an elongated “tail” region which corresponds to an outbreak to the interior of an neutral hydrogen (HI) bubble created by the stellar wind or supernova explosion (Kothes et al., 2001, 2006b). The “head” region also contains an off-center PWN in the north named “Boomerang” powered by the pulsar PSR J2229+6114, whose characteristic age and luminosity are 10 kyr and 2.2 erg s-1, respectively (Halpern et al., 2001b). For the PWN, a spectral break at about 4.3 GHz is detected and has been attributed to the synchrotron cooling (Kothes et al., 2006a). The “tail” region with a lower surface brightness also has a steeper spectrum with than the “head” region (; Pineault & Joncas, 2000). Kothes et al. (2001) detected HI and molecular materials associated with SNR G106.3+2.7 and derived a distance of 800 pc, which is much smaller than the value of 3 kpc estimated from X-ray absorption by Halpern et al. (2001b). Moreover, strong linearly polarized radio emission was detected in G106.3+2.7 (Kothes et al., 2001; Gao et al., 2011), which supports a close distance. At a distance of 800 pc, SNR G106.3+2.7 is 14 pc long and 6 pc wide.
In the -ray band, Fermi-LAT has detected GeV emission from PSR J2229+6114 (Abdo et al., 2009a), which is associated with the previously unidentified EGRET source 3EG J2227+6122 (Hartman et al., 1999). Milagro has reported extended VHE -ray emission from G106.3+2.7 (Abdo et al., 2007, 2009b). However, it was not clear whether the emission origins from the SNR or pulsar complex. In Acciari et al. (2009), VERITAS collaboration detected significant TeV -ray emission from the elongated radio extension of SNR G106.3+2.7, away from the position of PSR J2229+6114 and named it VER J2227+608. The VHE energy spectrum can be well fitted by a power-law of the form , with an index of = 2.29 0.33stat 0.30sys and the Milagro flux is coincide with the high-energy extrapolation of this spectrum (Acciari et al., 2009). Meanwhile, the extended -ray emission is also coincident with molecular clouds traced by 12CO (=10) emission (Heyer et al., 1998; Kothes et al., 2001), favoring a hadronic origin of the -ray emission.
In this work, we carry out a detailed analysis of GeV emission near VER J2227+608 with ten years of Fermi-LAT Pass 8 data. In Section 2, the data analysis routines and results are presented. The origin of the -ray emission and the expected detection in the TeV band are discussed in Section 3, followed by conclusions in Section 4.
2 Data Analysis
2.1 Data Reduction
In the following analysis, we select the latest Pass 8 version of the Fermi-LAT data with “Source” event class (evclass=128 & evtype=3), collected from August 4, 2008 (Mission Elapsed Time 239557418) to August 4, 2018 (Mission Elapsed Time 555033605). Only events with energies above 3 GeV are selected to avoid a too large point spread function (PSF) in the lower energy band. To suppress the contamination of the Earth Limb, the maximum zenith angle is adopted to be 90∘. The region of interest (ROI) is a square area of centered at the position of VER J2227+608 (R.A., decl.=, ; Acciari et al., 2009). We used the standard LAT analysis software Fermitools, available from the Fermi Science Support Center 111http://fermi.gsfc.nasa.gov/ssc/data/analysis/software/. Meanwhile, the binned likelihood analysis method with gtlike and the instrument response function (IRF) of “P8R3_SOURCE_V2” are adopted to fit the data. The diffuse backgrounds including the Galactic emission and the isotropic component, are modeled according to gll_iem_v07.fits and iso_P8R3_SOURCE_V2_v1.txt222http://fermi.gsfc.nasa.gov/ssc/data/access/lat/BackgroundModels.html. All sources in the fourth Fermi catalog (4FGL; The Fermi-LAT collaboration, 2019) within a radius of 20∘ from the ROI center and the two diffuse backgrounds are included in the source model. During the fitting procedure, the spectral parameters and the normalizations of sources within distance smaller than to VER J2227+608 are set to be free, as well as the normalizations of the two diffuse backgrounds.
2.2 Results
In the direction of SNR G106.3+2.7, there is only one 4FGL point source, 4FGL J2229.0+6114, which is the counterpart of PSR J2229+6114 (The Fermi-LAT collaboration, 2019). We first created a Test Statistic (TS) map using gttsmap by subtracting the emission from the diffuse backgrounds and all 4FGL sources in the best-fit model, which is shown in the Figure 1. The TS map shows significant -ray emission toward the “tail” region of SNR G106.3+2.7, which is marked as SrcX afterwards. Then we added SrcX in the model file as a point source with power-law spectrum and redo the likelihood fitting. The best-fit position of SrcX optimized by the gtfindsrc command is R.A., decl.=, with 1 error radius of . The TS value of SrcX as a point source is 35.5, corresponding to a significance level of 5.1. The spectral index and integral photon flux are 1.600.17 and (9.182.68) photon cm-2 s-1, respectively.
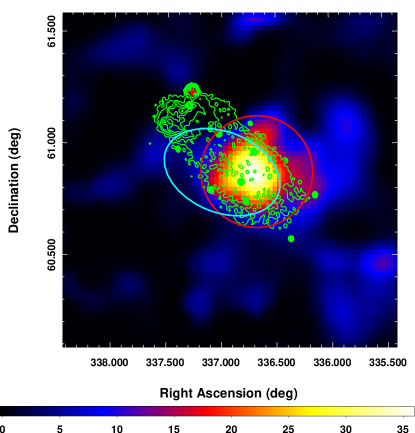
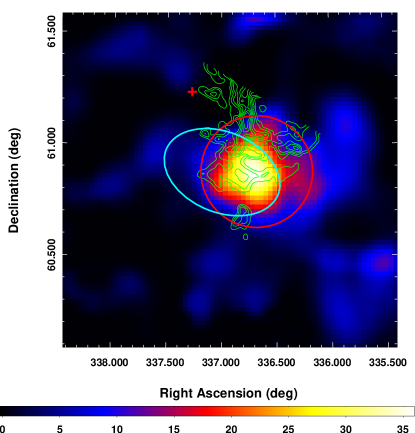
We carried out a spatial extension test for the -ray emission of SrcX using four uniform disks with different radii. These uniform disks are centered at the best-fit position of SrcX and the radii of them are adopted to be , , and . The TS values for the different spatial templates are 46.2, 49.8, 51.5 and 49.7, respectively. The Akaike information criterion (AIC; Akaike, 1974) is adopted to compare the different spatial models, which shows AIC = AICpoint - AICext = 14. Here AICpoint and AICext represent the AIC values for point source and extended uniform disk with radius of , respectively. This result shows an obvious improvement for using the extended spatial template than a point-source hypothesis. Meanwhile, the extended -ray emission of SrcX is consistent with the extended TeV -ray emission of VER J2227+608 as shown in Figure 1 (Acciari et al., 2009), which supports SrcX to be the counterpart of VER J2227+608. Hereafter, we adopted the uniform disk with radius of to describe the -ray emission of SrcX in the spectral analysis.
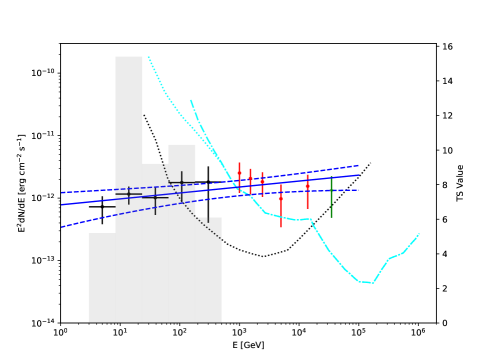
With the extended spatial template for SrcX, the spectral index and integrated photon flux of SrcX in the energy band of 3-500GeV are fitted to be 1.810.16 and (2.040.48) photon cm-2 s-1, respectively. To obtain the spectral energy distribution (SED) of SrcX, the data are further divided into five equal logarithmic energy bins between 3 GeV and 500 GeV. And the likelihood analysis is repeated for each energy bin with only the spectral normalizations of all sources within from SrcX and the two diffuse backgrounds left free. For any bin with TS value of SrcX smaller than 5.0, a 95% confidence level upper limit is calculated. The SED of SrcX is shown in Figure 2, together with the SED of VER J2227+608 (Acciari et al., 2009). Interestingly, the GeV spectrum of SrcX is well consistent with the TeV spectrum of VER J2227+608 and the global spectral index is fitted to be 1.900.04 shown as the blue lines in Figure 2.
3 Discussion
The above data analysis shows that SrcX with the extended -ray emission is positionally coincident with VER J2227+608 and the GeV spectrum of SrcX is also in agreement with the TeV spectrum of VER J2227+608, which all support SrcX as the counterpart of VER J2227+608. In Figure 1, the radio emission of SNR G106.3+2.7 at 1420 MHz by the Canadian Galactic Plane Survey (CGPS; Kothes et al., 2001; Taylor et al., 2003) shows that the -ray emission of VER J2227+608 is spatially consistent with the “tail” region of SNR G106.3+2.7. And in the right panel of Figure 1, the 12CO (=10) emission integrated between -5.59 and -7.23 km from the Five College Radio Astronomy Observatory (FCRAO; Heyer et al., 1998; Kothes et al., 2001) shows the molecular clouds around VER J2227+608, whose distance of 800 pc is derived from the center velocity of -6.4 km (Kothes et al., 2001). This suggests that the -ray emission of VER J2227+608 may be associated with the molecular clouds.
For the -ray origin of VER J2227+608, several radiation mechanisms are considered here. For the hadronic model, the -ray emission is from the decay of neutral pion mesons produced by inelastic pp collisions. And for the leptonic model, the -ray emission can be produced by inverse Compton scattering (ICS) or a bremsstrahlung process of relativistic electrons. The radio and non-thermal X-ray emission is produced by high-energy electrons via the synchrotron process.
Pineault & Joncas (2000) reported the radio flux densities and spectral indices of the “tail” and “head” regions of G106.3+2.7. And here we treat the “tail” region as the radio counterpart of VER J2227+608 considering the spatial correlation. In the X-ray band, only PSR J2229+6114 and its PWN in the “head” region have been detected and the “tail” region has no significant X-ray emission (Halpern et al., 2001a, b, 2002). Here, we adopted the intrinsic 2-10 keV flux of PSR J2229+6114, 1.310-12 erg cm-2 s-1 (Halpern et al., 2001b), as an upper limit for VER J2227+608 in the X-ray band, which can be lower than that obtained via proper data analyses for the expended -ray source region.
Here we quantitatively discuss a pure leptonic model and a hadronic-leptonic hybrid one for the multi-wavelength spectrum of VER J2227+608. And the spectrum of electrons and/or protons is simply assumed to be a power-law spectrum with an exponential cutoff: , where and are the spectral index and the cutoff energy, respectively, for or . The distance of VER J2227+608 is adopted to be 800 pc (Kothes et al., 2001), and the radius of the radiation region is 3.5 pc considering the best-fit uniform disk with radius of for the -ray emission in the data analysis above. Besides the cosmic microwave background (CMB), an infrared (IR) radiation field ( = 30 K, = 1.0 eV cm-3; Porter et al., 2006) is also considered in the ICS process. The gas density is assumed to be = 1.0 cm-3 for the bremsstrahlung and hadronic processes.
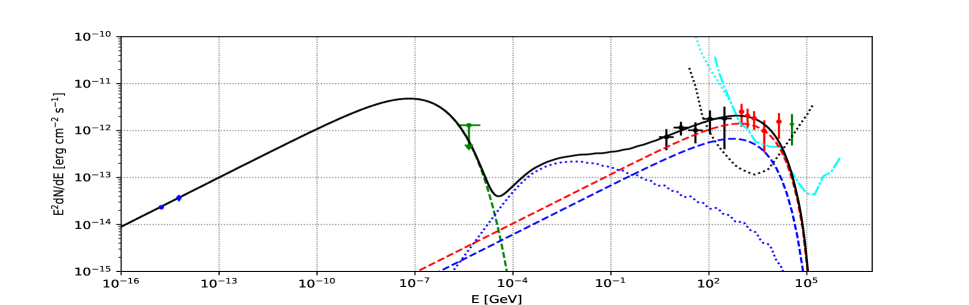
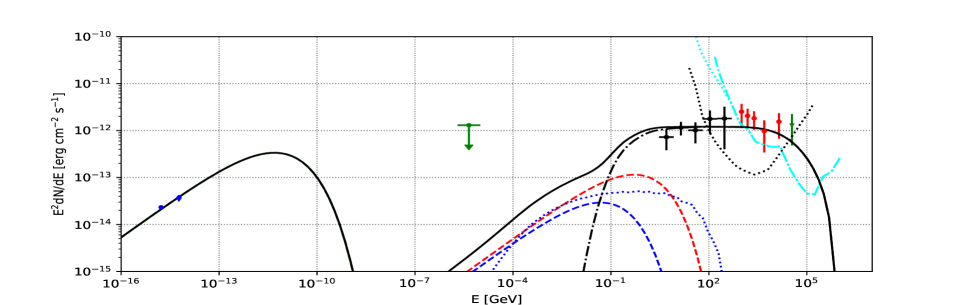
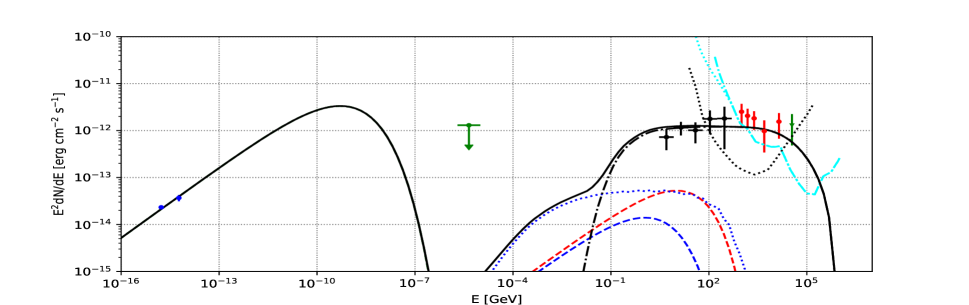
In the pure leptonic model, the spectral index of electrons is about 2.3. And the total energy of electrons above 1 GeV and the magnetic field strength are 41046 erg and 8 G, respectively. Without considering the TeV data measured by Milagro (Abdo et al., 2007, 2009b), the cutoff energy of electrons need to be less than about 20 TeV to avoid exceeding the upper limit in the X-ray band. With = 8 G and = 20 TeV, the synchrotron cooling timescale of electrons is estimated to be about 9400 yr, which is close to the age of G106.3+2.7, yr, inferred from the pulsar data (Halpern et al., 2001b). And such a scenario is likely consistent with the expectation about the evolution of high-energy particle distribution in SNRs by Zeng et al. (2017, 2019) and Zhang & Liu (2019a), which suggests that the acceleration of high-energy electrons has stopped at present. However, this leptonic model can not reproduce the flux in the two highest energy bins and it requires that high-energy electrons accelerated by shocks in the early stage of the SNR evolution are still trapped inside the SNR.
For the hadronic-leptonic hybrid model, the spectral indices of electrons and protons are adopted to be 2.0 to reduce the number of parameters. Meanwhile, the ratio of the normalization of electron distribution to that of protons, , is fixed to be 0.01, which is in accord with the locally measured CR electron to proton flux ratio (Yuan et al., 2012). With the gas density of = 1.0 cm-3, the total energy of protons with the energy above 1 GeV is . To explain the flat -ray spectra, the cutoff energy of protons should be greater than 400 TeV. The cutoff energy of electrons should be less than 0.1 TeV to avoid excessive the flux in the GeV -ray band. And the magnetic field strength of G is needed to explain the radio flux by synchrotron process.
Considering the presence of molecular clouds in this region as shown in the right panel of Figure 1, we get an approximate density of about 10.0 cm-3 based on the values of the column density, the CO brightness temperature, the velocity width and the approximate size of the molecular cloud (Kothes et al., 2001). And we also present the hadronic-leptonic hybrid model with the gas density of = 10.0 cm-3. Here neutral gases and dense molecular clumps can serve as targets for hadronic processes. With the cutoff energy of protons 400 TeV, the total energy content of protons above 1 GeV is reduced to be . Here the cutoff energy of electrons is poorly constrained and we fix by making the synchrotron radiation loss timescale equal to the age of SNR ( 104 yr). And the radio flux gives a magnetic field strength of G and the corresponding is about 0.5 TeV. Based on the observations of the HI and CO emission, Kothes et al. (2001) suggested that the “tail” of G106.3+2.7 was created by a breakout of the SNR shock wave into the HI bubble with a lower density. However, the relatively lower energy content in CRs, the hard -ray spectrum, and its center bright morphology are distinct from typical SNRs (Zeng et al., 2019), implying that this source may be driven by the PWN instead of shocks of the SNR. Nevertheless, if high-energy ions accelerated in the early stage of SNR evolution (Zhang et al., 2017) can be trapped within the SNR, the -ray emission may be attributed to the SNR.
If the tail is due to a breakout of the PWN into the HI bubble, we can get a value of the total ejected mass Mej of the supernova using equation (2) in Chevalier (2004), which describes the dynamical evolution of a PWN. And for PSR J2229+6114 with = 2.2 erg s-1 and the age of 10 kyr (Halpern et al., 2001b), the value of Mej is about 2.5 M⊙, assuming a typical explosion energy of 1051 erg and the rough radius of 14 pc (the long axis of G106.3+2.7). And this value of Mej seems to be reasonable for typical SNRs Chevalier (2004). The -ray emission from PWN is usually attributed to the ICS process with electrons accelerated by its termination shock. However, in dense environments, relativistic protons can also be produced and contribute to the -ray emission of PWN with the hadronic process (Cheng et al., 1990; Bartko & Bednarek, 2008). Although evidence for the presence of relativistic hadrons in PWNe has been elusive so far, the broadband spectra of several sources have been explained by the hadronic model, e.g. Vela X (Zhang & Yang, 2009), PWN G54.1+0.3 (Li et al., 2010) and DA 495(Coerver et al., 2019). Moreover, Ohira et al. (2018) suggested that PWNe inside SNRs could further re-accelerate the relativistic protons up to the energy of 1 PeV and such PWNe may therefore be important PeVatrons. The hard spectrum of protons and high proton cutoff energy of 400 TeV in the hybird model make VER J2227+608 a potential PeVatron. Other TeV sources with very hard spectra may have a similar origin (Guo et al., 2017).
Upcoming -ray experiments LHAASO (Bai et al., 2019; Liu et al., 2016) and CTA-North (CTA Consortium, 2019) can detect -ray emission from VER J2227+608. As shown in Figure 2, the global spectral index of the -ray emission from VER J2227+608 is hard with spectral index of 1.900.04. And the differential sensitivities of LHAASO (1 year) with different sizes of photomultiplier tube (PMT; Bai et al., 2019) and CTA-North (50 hrs; CTA Consortium, 2019) are also overplotted. Especially in the higher energy band (e.g. above 20 TeV), LHAASO has a great advantage than CTA-North. The different radiation models discussed above predict different spectra of VER J2227+608 for the energy above several tens of TeV, and the future accurate measurements of the TeV-PeV spectrum can distinguish these different radiation models and clarify whether it is a PeVatron.
4 Conclusion
In this work, we analyze the -ray emission toward VER J2227+608, which is associated with the “tail” region of SNR G106.3+2.7, using ten years Pass 8 data of Fermi-LAT. The GeV -ray emission of VER J2227+608 is extended and the global GeV to TeV spectra can be described by a hard power-law form with an index of 1.900.04. Both the pure leptonic and the hadronic-leptonic hybrid models are considered for the multiwavelength data of VER J2227+608. The pure leptonic model shows that the synchrotron cooling timescale of electrons is approximately equal to the age of SNR G106.3+2.7, implying quenching of VHE electron acceleration. However, the cutoff energy of electrons derived from the upper limit in the X-ray band seems to contradict with the TeV flux measured by Milagro. The hybrid model seems to be favored considering the spatial coincident between the -ray emission and the likely dense molecular clouds traced by CO emission. The cutoff energy of protons is constrained to be higher than 400 TeV. Such high-energy protons makes VER J2227+608 a promising PeVatron candidate. The low energy content of CRs in this source, its hard -ray spectrum and center bright morphology suggest that it may be powered by the PWN instead of shocks of the SNR. Future observations by LHAASO and CTA-North in the TeV band, especially accurate measurements of the TeV-PeV spectrum by LHAASO, would distinguish the different -ray origins of VER J2227+608 and test its PeVatron nature.
References
- Abdo et al. (2007) Abdo, A. A., Allen, B., Berley, D., et al. 2007, ApJ, 664, L91
- Abdo et al. (2009a) Abdo, A. A., Ackermann, M., Ajello, M., et al. 2009a, ApJ, 706, 1331
- Abdo et al. (2009b) Abdo, A. A., Allen, B. T., Aune, T., et al. 2009b, ApJ, 700, L127
- Abramowski et al. (2012) Abramowski, A., Acero, F., Aharonian, F., et al. 2012, A&A, 548, A38
- Acciari et al. (2009) Acciari, V. A., Aliu, E., Arlen, T., et al. 2009, ApJ, 703, L6
- Ackermann et al. (2013) Ackermann, M., Ajello, M., Allafort, A., et al. 2013, Science, 339, 807
- Akaike (1974) Akaike, H. 1974, IEEE Transactions on Automatic Control, 19, 716
- Bai et al. (2019) Bai, X., Bi, B. Y., Bi, X. J., et al. 2019, arXiv:1905.02773
- Balbo et al. (2011) Balbo, M., Walter, R., Ferrigno, C., & Bordas, P. 2011, A&A, 527, L4
- Bartko & Bednarek (2008) Bartko, H., & Bednarek, W. 2008, MNRAS, 385, 1105
- Cheng et al. (1990) Cheng, K. S., Cheung, T., Lau, M. M., Yu, K. N., & Kwok, P. W. 1990, Journal of Physics G Nuclear Physics, 16, 1115
- Chevalier (2004) Chevalier, R. A. 2004, Advances in Space Research, 33, 456
- Coerver et al. (2019) Coerver, A., Wilcox, P., Zhang, H., et al. 2019, ApJ, 878, 126
- CTA Consortium (2019) CTA Consortium 2019, Science with the Cherenkov Telescope Array, 9789813270091
- Gao et al. (2011) Gao, X. Y., Han, J. L., Reich, W., et al. 2011, A&A, 529, A159
- Grondin et al. (2013) Grondin, M.-H., Romani, R. W., Lemoine-Goumard, M., et al. 2013, ApJ, 774, 110
- Guo et al. (2017) Guo, X.-L., Xin, Y.-L., Liao, N.-H., et al. 2017, ApJ, 835, 42
- Halpern et al. (2001a) Halpern, J. P., Gotthelf, E. V., Leighly, K. M., & Helfand, D. J. 2001b, ApJ, 547, 323
- Halpern et al. (2001b) Halpern, J. P., Camilo, F., Gotthelf, E. V., et al. 2001b, ApJ, 552, L125
- Halpern et al. (2002) Halpern, J. P., Gotthelf, E. V., Camilo, F., Collins, B., & Helfand, D. J. 2002, Neutron Stars in Supernova Remnants, 271, 199
- Hartman et al. (1999) Hartman, R. C., Bertsch, D. L., Bloom, S. D., et al. 1999, ApJS, 123, 79
- Heyer et al. (1998) Heyer, M. H., Brunt, C., Snell, R. L., et al. 1998, ApJS, 115, 241
- Hinton et al. (2011) Hinton, J. A., Funk, S., Parsons, R. D., & Ohm, S. 2011, ApJ, 743, L7
- Joncas & Higgs (1990) Joncas, G., & Higgs, L. A. 1990, A&AS, 82, 113
- Kothes et al. (2001) Kothes, R., Uyaniker, B., & Pineault, S. 2001, ApJ, 560, 236
- Kothes et al. (2006a) Kothes, R., Reich, W., & Uyanıker, B. 2006a, ApJ, 638, 225
- Kothes et al. (2006b) Kothes, R., Fedotov, K., Foster, T. J., & Uyanıker, B. 2006b, A&A, 457, 1081
- Koyama et al. (1995) Koyama, K., Petre, R., Gotthelf, E. V., et al. 1995, Nature, 378, 255
- Li et al. (2010) Li, H., Chen, Y., & Zhang, L. 2010, MNRAS, 408, L80
- Liu et al. (2016) Liu, Y., Cao, Z., Chen, S., et al. 2016, ApJ, 826, 63
- Ohira et al. (2018) Ohira, Y., Kisaka, S., & Yamazaki, R. 2018, MNRAS, 478, 926
- Pineault & Joncas (2000) Pineault, S., & Joncas, G. 2000, AJ, 120, 3218
- Porter et al. (2006) Porter, T. A., Moskalenko, I. V., & Strong, A. W. 2006, ApJ, 648, L29
- Taylor et al. (2003) Taylor, A. R., Gibson, S. J., Peracaula, M., et al. 2003, AJ, 125, 3145
- The Fermi-LAT collaboration (2019) The Fermi-LAT collaboration 2019, arXiv:1902.10045
- Xin et al. (2018) Xin, Y.-L., Liao, N.-H., Guo, X.-L., et al. 2018, ApJ, 867, 55
- Yuan et al. (2012) Yuan, Q., Liu, S., & Bi, X. 2012, ApJ, 761, 133
- Zeng et al. (2017) Zeng, H., Xin, Y., Liu, S., et al. 2017, ApJ, 834, 153
- Zeng et al. (2019) Zeng, H., Xin, Y., & Liu, S. 2019, ApJ, 874, 50
- Zhang et al. (2017) Zhang, Y., Liu, S., & Yuan, Q. 2017, ApJ, 844, L3
- Zhang & Liu (2019a) Zhang, X., & Liu, S. 2019a, ApJ, 876, 24
- Zhang & Liu (2019b) Zhang, X., & Liu, S. 2019b, ApJ, 874, 98
- Zhang & Yang (2009) Zhang, L., & Yang, X. C. 2009, ApJ, 699, L153