Oxygen abundance and the N/C vs N/O relation for AFG supergiants and bright giants
Abstract
Non-LTE analysis (LTE is local thermodynamic equilibrium) of the oxygen abundances for 51 Galactic A-, F- and G-type supergiants and bright giants is performed. In contrast with carbon and nitrogen, oxygen does not show any significant systematic anomalies in their abundances log (O). There is no marked difference from the initial oxygen abundance within errors of the log (O) determination across the interval from 4500 to 8500 K and the interval from 1.2 to 2.9 dex. This result agrees well with theoretical predictions for stellar models with rotation. With our new data for oxygen and our earlier non-LTE determinations of the N and C abundances for stars from the same sample, we constructed the [N/C] vs [N/O] relation for 17 stars. This relation is known to be a sensitive indicator of stellar evolution. A pronounced correlation between [N/C] vs [N/O] is found; the observed [N/C] increase from 0 to 1.6 dex is accompanied by the [N/O] increase from 0 to 0.9 dex. When comparing the observed [N/C] vs [N/O] relation with the theoretical one, we show that this relation reflects a strong dependence of the evolutionary changes in CNO abundances on the initial rotation velocities of stars. Given that the initial rotational velocities of these stars are expected to satisfy 150 km/s, it is found that they are mostly the post first dredge-up (post-FDU) objects. It is important that just such initial velocities are typical for about 80 % of stars in question (i.e. for stars with masses 4-19 M☉). A constancy of the total C+N+O abundance during stellar evolution is confirmed. The mean value log (C+N+O)=8.970.08 found for AFG supergiants and bright giants seems to be very close to the initial value 8.92 (the Sun) or 8.94 (the unevolved B-type MS stars).
keywords:
stars: abundances – stars: supergiants – stars: evolution1 Introduction
Carbon, nitrogen and oxygen are key light chemical elements whose atmospheric abundances may significantly change during the stellar evolution. Therefore, a study of these elements provides an opportunity for testing modern evolutionary theories. We consider here stars with masses between 4 and 20 M☉, which are observed at first as early and middle B-type stars on the Main Sequence (MS), i.e., luminosity classes V, IV and III. As is well known, the H-burning CNO-cycle is the main source of energy in these stars with such during this evolutionary phase. Next, these stars are observed as A, F and G-type supergiants and bright giants, i.e., luminosity classes I and II. These luminous stars are the focus of the present paper.
Rotation of a star plays an important role in evolution of stars with masses = 4-20 M☉. Rotation affects the stellar interior and may also affect the surface chemical composition. When the initial rotational velocity is rather high, the rotationally-induced mixing can lead to marked changes in the surface C and N abundances already during the MS stage. Further alterations in the surface C and N abundances can take place on the next stage of A, F and G supergiants, especially after the deep convecting mixing, the so-called First Dredge-Up (FDU). Since the surface and interior abundances of MS stars may depend on the stellar rotation so are the surface abundances in post-FDU dependent on the stellar rotation. The stars in their post-MS phase and after the FDU (post- FDU phase) are of special interest to us.
Our sample of the Galactic A-, F- and G-type supergiants and bright giants has been studied by us earlier in a series of papers providing: (a) accurate determination of fundamental parameters for 63 stars, including their effective temperature , surface gravity , microturbulent velocity and index of metallicity [Fe/H] (Lyubimkov et al. 2010, Paper I); (b) the non-LTE (LTE is local thermodynamic equilibrium) analysis of the nitrogen abundance for 30 stars that confirmed the N enrichment in atmospheres of this type stars (Lyubimkov et al. 2011, Paper II); (c) the non-LTE analysis of the lithium abundance for 55 stars which led to some interesting conclusions after comparison with theory (Lyubimkov et al. 2012, Paper III); (d) the non-LTE analysis of the carbon abundance for 36 stars that confirmed both the expected C general deficiency in their atmospheres and the N vs C anticorrelation (Lyubimkov et al. 2015, Paper IV).
Now, we present our results of the non-LTE oxygen abundance determination for 51 A-, F- and G-type supergiants and bright giants. We used in this analysis the parameters , , and [Fe/H] found in Paper I. These new data for oxygen together with our earlier results for nitrogen (Paper II) and carbon (Paper IV) allow us construct the N/C vs N/O relation for 17 stars. According to Maeder et al. (2014), the N/C vs N/O relation is a very sensitive indicator of mixing in stars. These authors noted that the N/C vs N/O plot can be considered as ”an ideal quality test for observational results“.
There are a lot of works on the C, N and O abundance determination for late-type stars, mostly for dwarfs and giants. However, data on the CNO abundances for FGK supergiants are rather limited, especially as for the O abundance. On the one hand, it was found with confidence, at first in early LTE determinations (see, e.g., Luck 1978; Luck & Lambert 1985 and later in non-LTE analyses (see, e.g., our Papers II and IV), that the systematic C underabundance and the N overabundance (as compared with the Sun) take place in these stars.
On the other hand, not numerous data on the O abundance were less definite. In particular, a mild oxygen deficiency was found for FGK supergiants in LTE analysis of Luck & Lambert (1985). A question arose: is oxygen really somewhat underabundant in such stars? The later non-LTE determinations did not touch upon this problem. For instance, in the work of Korotin et al. (2014) a non-LTE analysis of the O abundances was implemented for a large sample of variable supergiants (cepheids) with various distances. It was found there that marked variations in the derived O abundances are connected with different Galactocentric distances of the stars (they vary from 5 to 17 kpc). An aim of this work was a determination of the radial O/H gradient in Galactic thin disk.
The aim of our work is a non-LTE determination of O abundances for non-variable AFG supergiants and bright giants which are mostly within 1 kpc from the Sun. The derived values for these nearby stars are compared with the initial O abundance; their dependence on basic parameters and is considered as well. Both the obtained O abundances and the constructed N/C vs N/O relation are compared with theoretical predictions based on stellar models with rotation. The total C+N+O abundance for these evolved stars is determined; its conservation during stellar evolution is discussed.
2 SPECTRAL OBSERVATIONS AND THE O i LINE LIST
We base the present work, like Papers I-IV, on the high-resolution spectral observations of Galactic AFG-type supergiants and bright giants, which have been acquired by us at the W.J. McDonald Observatory in 2003-2006 using the 2.7-m telescope and the Tull echelle spectrometer (Tull et al., 1995). Additional observations of some stars were performed in 2009 with the same spectrometer. The stars were observed at a resolving power of R = 60000. The spectral region from about 4000 to 9700 Å was covered. The typical signal-to-noise ratio of the extracted one-dimensional spectra was between 100 and 400. Two spectra for each programme star have been obtained.
The list of O i lines used in our non-LTE analysis is presented in Table 1. The oscillator strengths log here are taken from the NIST database (Kramida et al., 2018) and the damping constants , and are taken from the VALD database (Ryabchikova et al., 2015).
| (Å) | Elow(eV) | log | |||
|---|---|---|---|---|---|
| 5577.34 | 1.96 | -8.20 | 0.15 | -6.29 | -8.04 |
| 6155.96 | 10.74 | -1.36 | 7.62 | -3.95 | -6.85 |
| 6155.97 | 10.74 | -1.01 | 7.62 | -3.95 | -6.85 |
| 6155.99 | 10.74 | -1.12 | 7.61 | -3.95 | -6.85 |
| 6156.74 | 10.74 | -1.49 | 7.62 | -3.95 | -6.85 |
| 6156.76 | 10.74 | -0.90 | 7.62 | -3.95 | -6.85 |
| 6156.78 | 10.74 | -0.69 | 7.61 | -3.95 | -6.85 |
| 6158.15 | 10.74 | -1.84 | 7.62 | -3.95 | -6.85 |
| 6158.18 | 10.74 | -1.00 | 7.62 | -3.95 | -6.85 |
| 6158.19 | 10.74 | -0.41 | 7.61 | -3.95 | -6.85 |
| 6300.30 | 0.00 | -9.72 | -2.16 | -8.12 | -6.48 |
| 7771.94 | 9.15 | 0.37 | 7.52 | -5.54 | -7.47 |
| 7774.16 | 9.15 | 0.22 | 7.52 | -5.54 | -7.47 |
| 7775.39 | 9.15 | 0.00 | 7.52 | -5.54 | -7.47 |
| 8446.25 | 9.52 | -0.46 | 8.77 | -5.43 | -7.60 |
| 8446.36 | 9.52 | 0.24 | 8.77 | -5.43 | -7.60 |
| 8446.76 | 9.52 | 0.01 | 8.77 | -5.43 | -7.60 |
| 9260.81 | 10.74 | -0.24 | 7.87 | -4.94 | -7.42 |
| 9260.85 | 10.74 | 0.11 | 7.88 | -4.94 | -7.42 |
| 9260.94 | 10.74 | 0.00 | 7.90 | -4.94 | -7.42 |
| 9262.58 | 10.74 | -0.37 | 7.88 | -4.94 | -7.42 |
| 9262.67 | 10.74 | 0.22 | 7.90 | -4.94 | -7.42 |
| 9262.78 | 10.74 | 0.43 | 7.93 | -4.94 | -7.42 |
| 9265.83 | 10.74 | -0.72 | 7.90 | -4.94 | -7.42 |
| 9265.93 | 10.74 | 0.13 | 7.94 | -4.94 | -7.42 |
| 9266.01 | 10.74 | 0.71 | 7.88 | -4.94 | -7.42 |
Three infrared triplets are included in Table 1, namely 7771-7775 Å, 8446 Å and 9260-9266 Å. Large non-LTE effects take place for these lines, which lead to their significant strengthening (see below). Unfortunately, the 9260-9266 Å triplet is often seriously blended with telluric lines, so it was of limited use. Apart from the generally strong IR lines, we also considered the following generally weak lines in the visual spectral region: the forbidden 5577 Å and 6300 Å lines and the permitted lines at 6155, 6156 and 6158 Å.
| HR | Sp | (km/s) | M/M☉ | [Fe/H] | log (O) | ||
|---|---|---|---|---|---|---|---|
| 27 | F2 II | 6270 | 2.10 | 3.6 | 6.1 | -0.09 | 8.97 0.20 |
| 207 | G0 Ib | 5220 | 1.55 | 4.0 | 7.9 | -0.12 | 8.76 0.15 |
| 292 | F0 II | 6880 | 2.05 | 2.7 | 7.1 | 0.05 | 8.89 0.18 |
| 461 | G5 II | 4430 | 1.18 | 2.8 | 9.5 | -0.03 | 8.69 0.20 |
| 792 | G5 II | 5020 | 2.09 | 2.9 | 5.0 | -0.01 | 8.72 0.10 |
| 849 | G5 Iab | 5020 | 1.73 | 2.2 | 6.5 | 0.08 | 8.77 0.10 |
| 1017 | F5 Ib | 6350 | 1.90 | 5.3 | 7.3 | -0.07 | 8.84 0.10 |
| 1135 | F5 II | 6560 | 2.44 | 3.5 | 4.8 | 0.06 | 8.74 0.20 |
| 1270 | G8 IIa | 5060 | 1.91 | 1.7 | 5.7 | 0.09 | 8.68 0.10 |
| 1303 | G0 Ib | 5380 | 1.73 | 3.6 | 7.0 | -0.09 | 8.67 0.10 |
| 1327 | G5 IIb | 5440 | 2.89 | 1.2 | 2.8 | -0.09 | 8.69 0.12 |
| 1603 | Ib-IIa | 5300 | 1.79 | 4.8 | 6.5 | -0.04 | 8.81 0.18 |
| 1740 | A5 II | 8300 | 2.10 | 4.3 | 8.8 | -0.08 | 8.70 0.15 |
| 1829 | G5 II | 5450 | 2.60 | 1.3 | 3.5 | -0.09 | 8.61 0.15 |
| 1865 | F0 Ib | 6850 | 1.34 | 3.9 | 13.9 | 0.03 | 8.74 0.15 |
| 2000 | G2 Ib-II | 5000 | 2.45 | 2.1 | 3.9 | -0.10 | 8.69 0.15 |
| 2453 | G5 Ib | 4900 | 1.70 | 2.3 | 6.5 | 0.12 | 8.76 0.15 |
| 2597 | F2 Ib-II | 6710 | 2.02 | 3.3 | 7.1 | -0.18 | 8.79 0.20 |
| 2786 | G2 Ib | 5260 | 1.90 | 3.2 | 5.9 | 0.05 | 8.77 0.12 |
| 2833 | G3 Ib | 5380 | 2.21 | 4.0 | 4.7 | 0.08 | 8.81 0.13 |
| 2881 | G3 Ib | 5300 | 1.66 | 5.2 | 7.3 | -0.17 | 8.66 0.15 |
| 3045 | G6 Iab-Ib | 4880 | 1.21 | 5.1 | 9.9 | -0.07 | 8.71 0.18 |
| 3073 | F1 Ia | 6670 | 2.61 | 3.5 | 4.2 | 0.10 | 8.84 0.20 |
| 3102 | F7 II | 5690 | 2.17 | 3.7 | 5.1 | 0.11 | 8.87 0.20 |
| 3183 | A 5 II | 8530 | 2.67 | 3.5 | 5.4 | 0.04 | 8.75 0.18 |
| 3188 | G2 Ib | 5210 | 1.75 | 3.3 | 6.6 | 0.01 | 8.75 0.12 |
| 3229 | G5 II | 5130 | 2.04 | 2.3 | 5.2 | 0.01 | 8.73 0.15 |
| 3459 | G1 Ib | 5370 | 2.08 | 3.5 | 5.2 | 0.03 | 8.73 0.12 |
| 4166 | G2.5 IIa | 5475 | 2.36 | 2.7 | 4.2 | 0.02 | 8.73 0.12 |
| 4786 | G5 II | 5100 | 2.52 | 1.5 | 3.7 | 0.10 | 8.78 0.12 |
| 5165 | G0 Ib-IIa | 5430 | 2.37 | 2.5 | 4.2 | -0.17 | 8.82 0.15 |
| 6081 | A5 II | 8370 | 2.12 | 2.8 | 8.7 | 0.03 | 8.67 0.15 |
| 6536 | G2 Ib-IIa | 5160 | 1.93 | 3.0 | 6.0 | 0.02 | 8.78 0.15 |
| 6978 | F7 Ib | 6000 | 1.70 | 4.6 | 8.2 | -0.09 | 8.74 0.15 |
| 7014 | F2 Ib | 6760 | 1.66 | 4.6 | 10.0 | -0.07 | 8.89 0.20 |
| 7094 | F2 Ib | 6730 | 1.75 | 3.4 | 9.1 | -0.19 | 8.61 0.18 |
| 7164 | G3 II | 5200 | 2.25 | 2.5 | 4.5 | -0.10 | 8.71 0.12 |
| 7264 | F2 II | 6590 | 2.21 | 3.2 | 5.9 | -0.17 | 8.71 0.20 |
| 7387 | F3 Ib | 6700 | 1.43 | 4.4 | 12.5 | -0.03 | 8.71 0.20 |
| 7456 | G0 Ib | 5550 | 2.06 | 2.8 | 5.5 | -0.16 | 8.63 0.10 |
| 7542 | F8 Ib-II | 5750 | 2.15 | 4.2 | 5.3 | 0.17 | 8.79 0.18 |
| 7770 | F5 Ib | 6180 | 1.53 | 5.0 | 10.0 | -0.22 | 8.64 0.15 |
| 7795 | G5 III+A | 4870 | 2.00 | 3.1 | 5.3 | 0.00 | 8.72 0.10 |
| 7823 | F1 II | 6760 | 1.92 | 4.2 | 7.8 | -0.13 | 8.71 0.15 |
| 7834 | F5 II | 6570 | 2.32 | 3.6 | 5.3 | 0.00 | 8.84 0.14 |
| 7876 | A9 II | 7020 | 1.66 | 3.4 | 10.6 | -0.21 | 8.76 0.20 |
| 8232 | G0 Ib | 5490 | 1.86 | 3.7 | 6.4 | 0.10 | 8.73 0.17 |
| 8313 | G5 Ib | 4910 | 1.58 | 2.8 | 7.1 | -0.02 | 8.65 0.18 |
| 8412 | G5 Ia | 5280 | 2.35 | 2.3 | 4.2 | 0.05 | 8.72 0.18 |
| 8414 | G2 Ib | 5210 | 1.76 | 3.8 | 6.5 | 0.03 | 8.77 0.15 |
| 8692 | G4 Ib | 4960 | 1.90 | 3.4 | 5.6 | -0.10 | 8.68 0.15 |
3 NON-LTE COMPUTATIONS OF O i LINES
Populations of O i levels were determined using the MULTI code of Carlsson (1986) with modifications as given by Korotin et al. (1999). Proper comparison of observed and computed profiles in many cases requires a multi-element spectral synthesis in order to take into account possible blending lines of other species. For this process, we fold the non-LTE (MULTI) computations, specifically the departure coefficients, into the LTE synthetic spectrum code SYNTHV (Tsymbal, 1996) that enables us to calculate the non-LTE source function and opacity for O i lines. These calculations included all spectral lines from the VALD database (Ryabchikova et al., 2015) in a region of interest. The LTE approach was applied for lines other than the O i lines. Abundances of corresponding chemical elements were adopted in accordance with the [Fe/H] values for each programme star.
The oxygen model atom used in our non-LTE computations was first described by Mishenina et al. (2000) and then updated by Korotin et al. (2014). The model consists of 51 O i levels of singlet, triplet, and quintet systems, and the ground level of the O ii ion. An additional 24 levels of neutral oxygen and 15 levels of ions O ii and O iii are added for particle number conservation. Fine structure splitting was taken into account only for the ground level and the 3p 5P level (the upper level of the 7771-7775 Å triplet lines). A total of 248 bound-bound transitions were included. Accurate quantum mechanical calculations were employed for the first 19 levels to find collision rates with electrons (Barklem, 2007). The O i model is described in detail by Korotin et al. (2014).
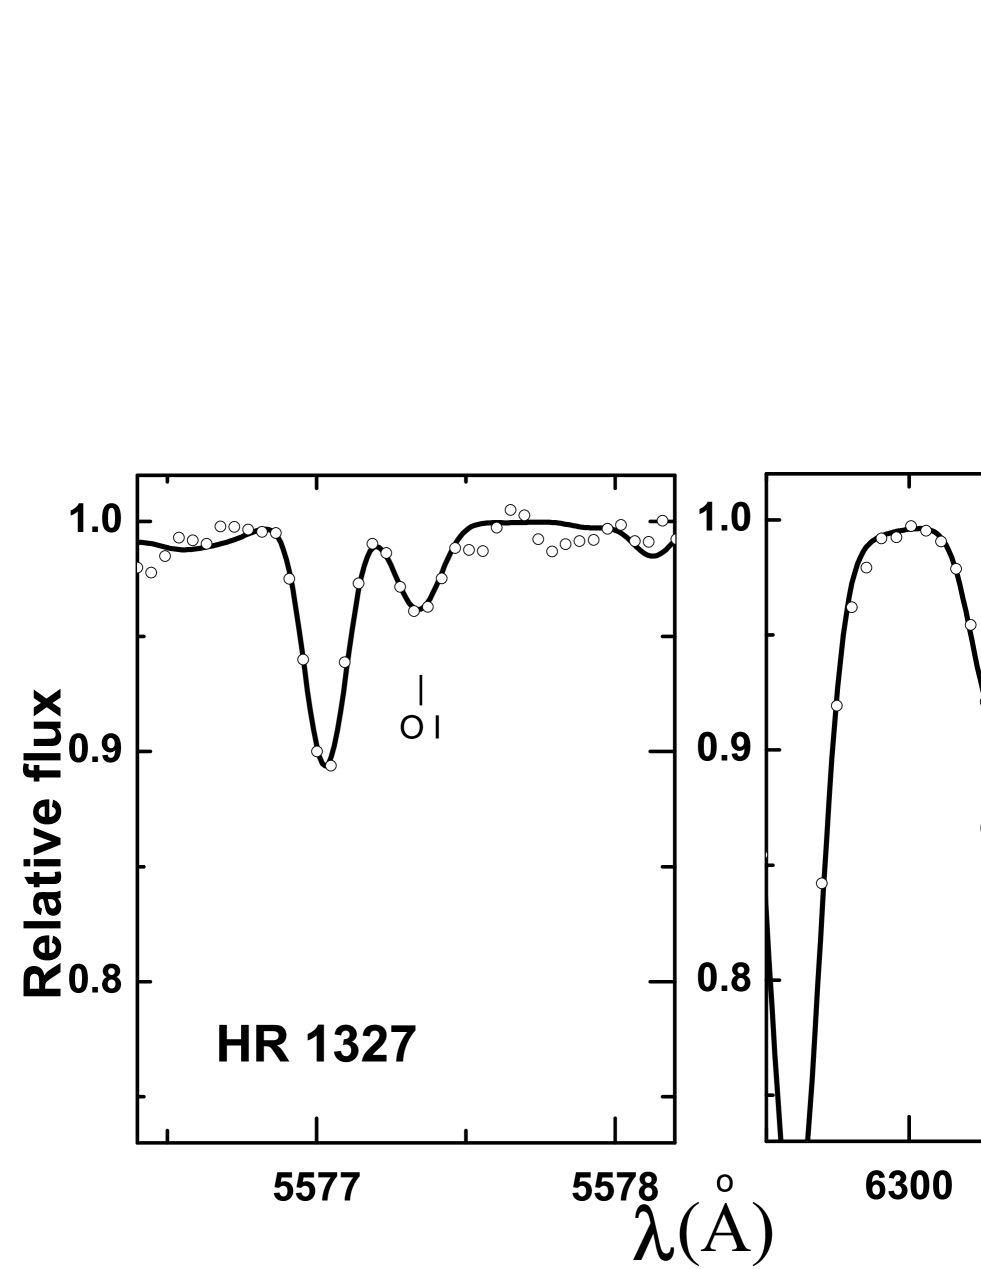
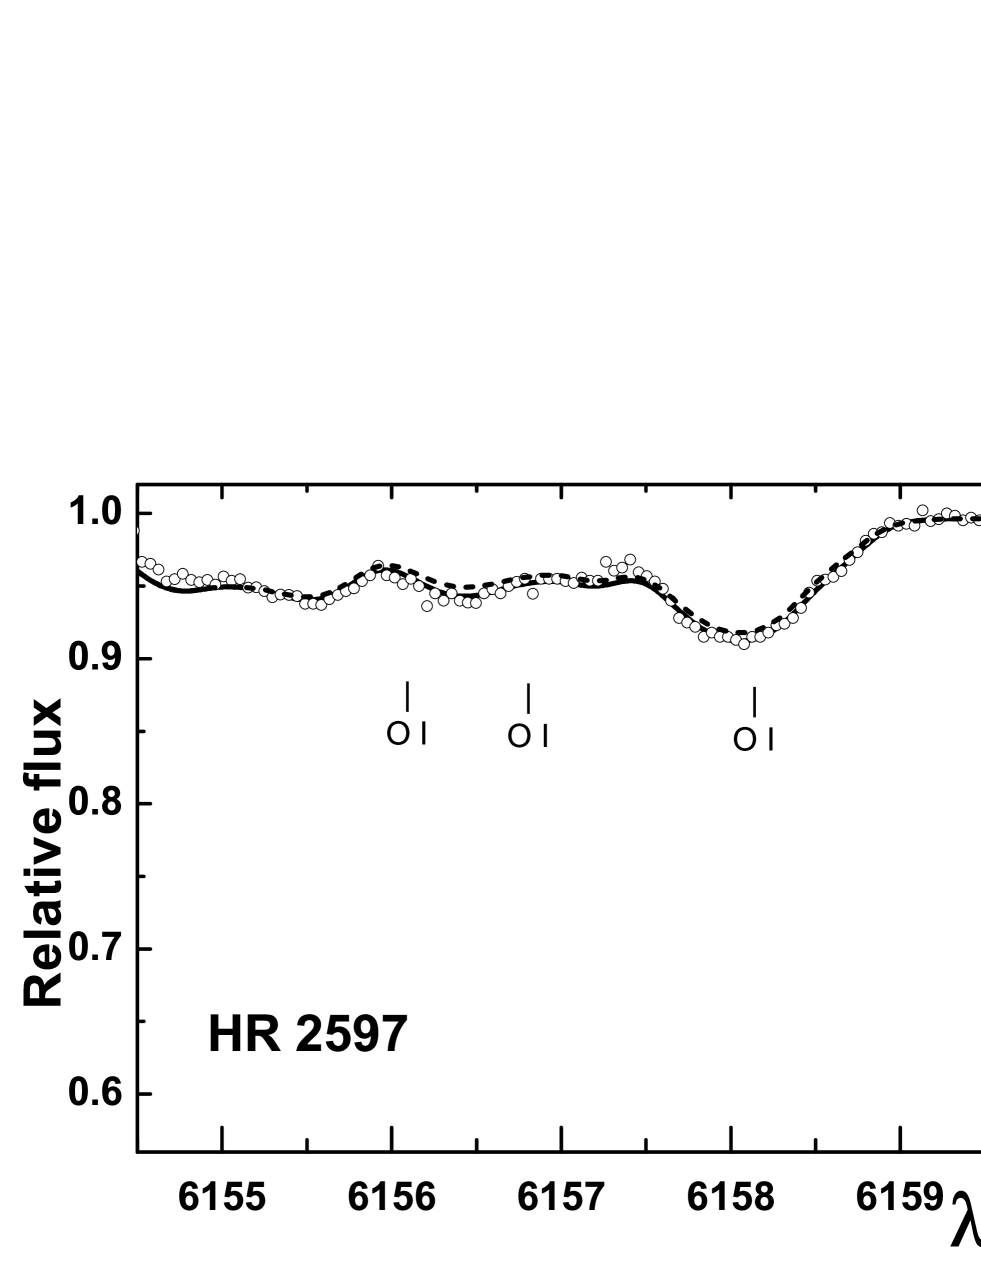
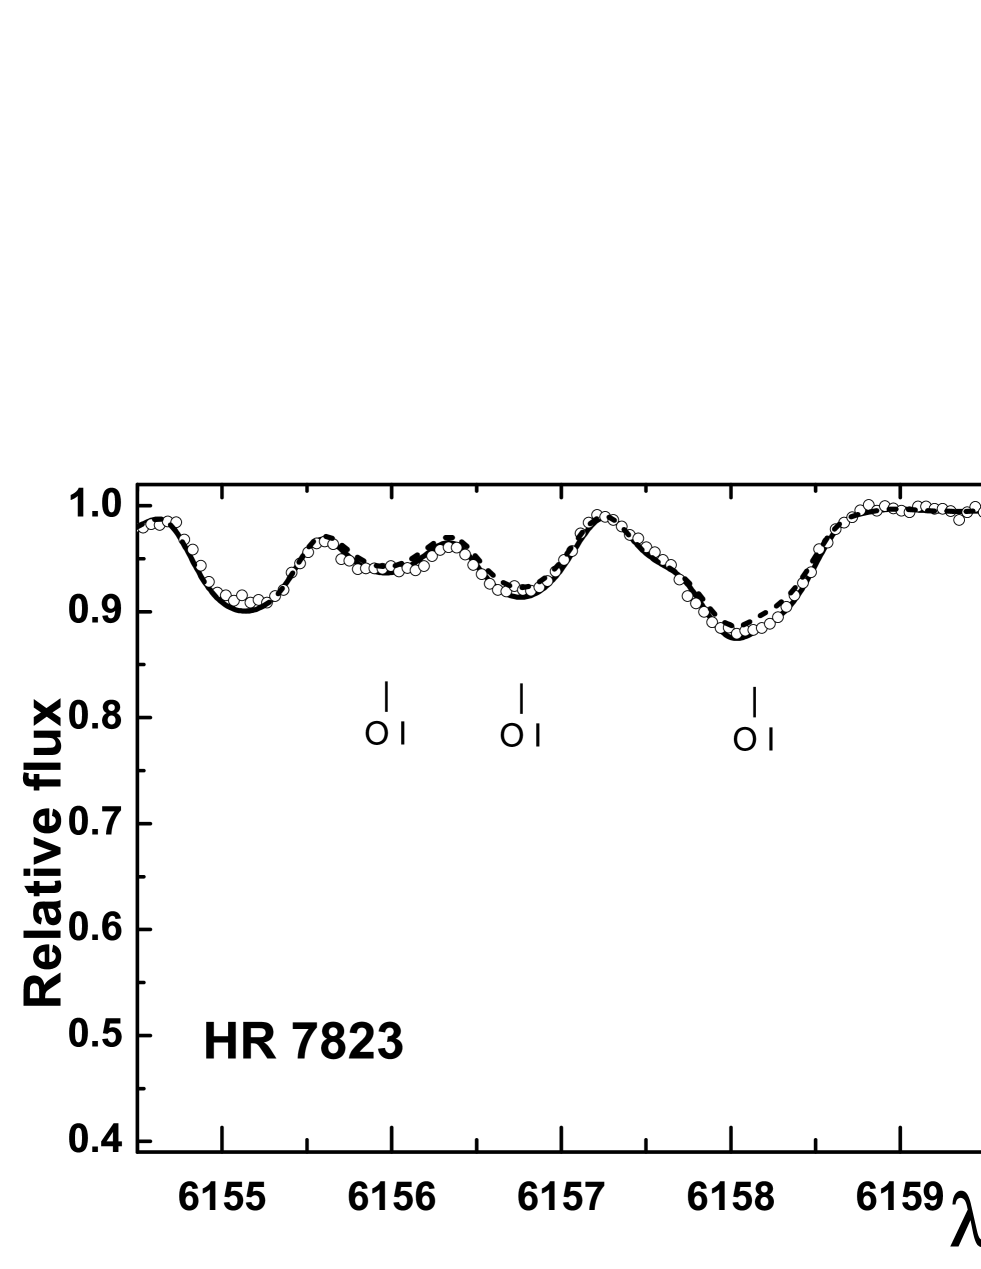
The IR triplets 7771-7775 Å, 8446 Å and 9260-9266 Å show the greatest non-LTE effects. On the contrary, the forbidden lines 5577 and 6300 Å are practically insensitive to non-LTE effects, so they can be considered as very suitable lines for an abundance analysis. However, there are some limitations on their application. For instance, the forbidden 6300 Å line becomes too weak for stars with temperatures 6500 K. Besides, for some programme stars with relatively high rotational velocities sin this line is strongly blended by the Sc ii 6300.69 Å line. Another forbidden line, 5577 Å, has low intensity for all programme stars, so it was used as a subsidiary line in our analysis.
The lines 6155, 6156 and 6158 Å each of them is a triplet, showed a moderate departures from LTE. They were successfully used in the O abundance determination for a part of the stars. Unfortunately, for stars with 5800 K these lines become too weak and, therefore, unusable for our analysis.
We show in Fig. 1 comparisons between observed and computed profiles of some O i lines for three programme stars with the effective temperatures = 5440, 6710 and 6760 K for HR 1327, 2597 and 7823, respectively. One may see that there is an excellent agreement in the non-LTE case (solid curves), whereas in the LTE case (dashed curves) for IR triplets the agreement is absent: the computed LTE profiles of the strong IR lines are much weaker than the non-LTE profiles fitted to the observed profiles and which also fit the weak visual region permitted and forbidden lines where the LTE and non-LTE profiles are very similar. The case of HR 2597 is interesting because of the relatively high rotational velocity sin= 35 km/s of this star. Therefore, the strong IR lines for HR 2597 are significantly broadened in comparison with the star HR 7823 that has similar but lower sin=19 km/s.
One may see in Fig. 1 a number of interesting details. In particular, the IR lines are significantly strengthening when increases. At the same time, when increases the lines on 6155-6158 Å become accessible for the analysis, whereas the forbidden lines at 6300 and 5577 Å are weakened and become unuseable.
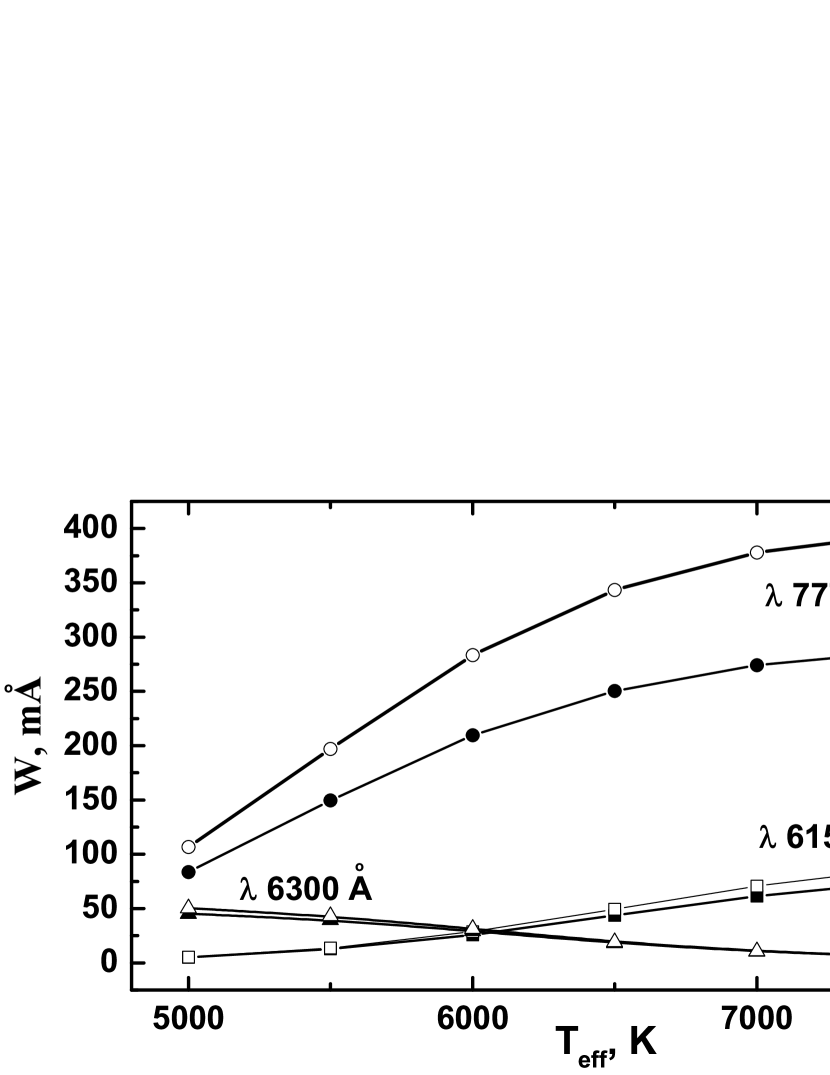
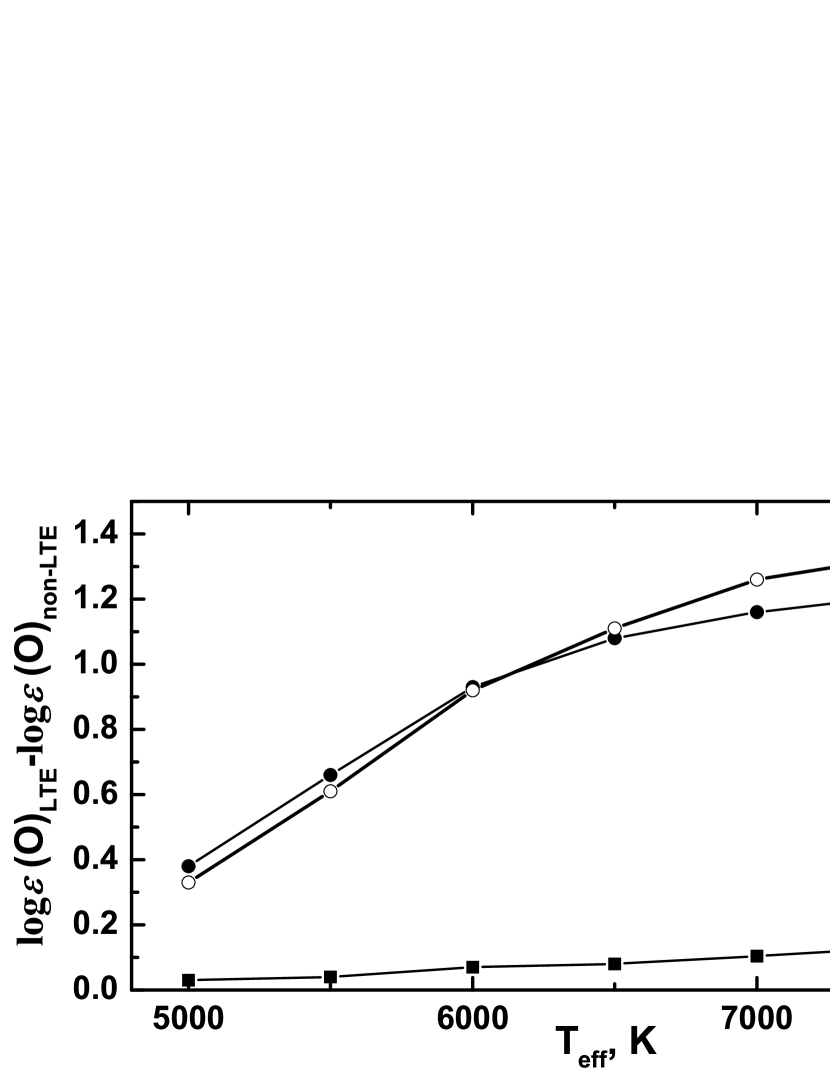
We found that high-exitation IR triplets, on the one hand, and the low-exitation forbidden O i lines in the visual region, on the other hand, show a different sensitivity to variations of star’s parameters, especially to the variations. We illustrate this with the help of Figs. 2 and 3, where some results of our computations for lines 7771 Å, 6300 Å and 6158 Å are presented. In particular, Fig. 2 shows equivalent widths W of these lines as a function of , whereas Fig. 3 shows a difference between LTE and non-LTE abundances as a function of (non-LTE corrections for 6300 Å are zero, so they are not shown in Fig. 3). Note that the computations were implemented for = 2.0, a solar O abundance and two values. One may see from Figs. 2 and 3 that both the equivalent width W and the non-LTE correction in O abundances for the IR line 7771 Å are significantly strengthened with , whereas for the line 6158 Å the strengthening is small. On the contrary, the values are weakened for the low-exitation forbidden 6300 Å line.
It is interesting to note that the non-LTE computations of O i lines for FGK dwarfs were made recently by Amarsi et al. (2016) on the basis of 3D hydrodynamic model stellar atmospheres. Unfortunately, we cannot compare directly the results of our non-LTE computations based on 1D hydrostatic models with these data because our programme stars (supergiants and bright giants) have lower values.
4 DETERMINATION OF THE OXYGEN ABUNDANCES
We applied in this work, as in Papers I-IV, the model atmospheres computed by us for the adopted , and values on the basis of Kurucz (1993) ATLAS9 code. Using these model atmospheres and the microturbulent parameter from Table 2, we determined the oxygen abundance log (O) for each star. The log (O) values are given in the standard scale, where for hydrogen the value log (H) = 12.00 is adopted. As noted above, in order to take into account the blending by lines of other chemical elements, we based our analysis on computations of synthetic spectra and their comparison with observed ones. For instance, it is known that in the solar spectrum the 5577 Å line is severely blended with C2 lines (Meléndez & Asplund, 2008), the 6300 Å line is severely blended with Ni i (Allende Prieto et al., 2001), and the 8446 Å lines are affected by two Fe i lines. Effects of these lines took into consideration in our computations.
Computation of synthetic spectra requires an adoption of the projected rotational velocity sin for each star. It was noted in Paper III that when spectra of cool supergiants and bright giants are studied, it is difficult to separate correctly the contributions to a line profile of the projected rotational velocity sin and the macroturbulent velocity . Two limiting cases were considered in Paper III: calculation of spectra with only sin or only with ; it was found that the derived Li abundances for these two cases are identical within 0.03 dex. Noting this result, we used here spectra computed using the sin values and neglected . The sin values were determined in Papers III and IV from Li I and C I lines, respectively, with excellent agreement between the two determinations. We displayed already in Fig. 1, as an example of our technique, the fitting of the computed non-LTE profiles of some O i lines to the observed ones for three stars.
We implemented a preliminary non-LTE analysis of the O i lines from Table 1 for all 63 stars listed in Paper I. As a result of such consideration, some stars were excluded from further analysis (see below). We included in a final list only the stars, for which a good agreement is obtained between the abundances log (O) determined for three groups of the O i lines: 1) the low-excitation forbidden lines on 6300 Å and 5577 Å, which are weak and blended, but insensitive to departures from LTE; 2) the high-excitation IR triplets 7771-7775 Å and 8446 Å, which are strong and less sensitive to blends, but can show large departures from LTE; 3) the high-excitation lines on 6155-6158 Å, which show weaker departures from LTE. We selected 51 stars in all; their oxygen abundances log (O) are presented in the last column of Table 2. It should be noted that all these stars have distances d 1000 pc; only for HR 7876 d 1700 pc (see Paper I).
The omitted 12 stars showed a marked discrepancy in the log (O) values (about 0.3 dex or more) between the O i lines in IR and visual regions; some discrepancy takes place as well between the forbidden and permitted lines in the visual region. In particular, such situation was obtained for two relatively hot A5-type supergiants, HR 825 (Teff = 8570 K) and HR 2874 (Teff = 8620 K), for which departures from LTE in IR lines are especially great. Apart from the possible uncertainties in the values for these supergiants, errors in their high microturbulent parameters, = 10.8 and 7.8 km/s, can distort the results. Note as well that a possible dependence of on height in atmospheres of such luminous stars can play a marked role. Such dependence was found, for example, for F supergiants by Lyubimkov & Samedov (1990).
There are also several cooler stars, for which we cannot find the O abundance with confidence. A marked discrepancy between O i lines in IR and visual regions was obtained for them, too. Possible errors in the parameters and can be a reason of the discrepancy. It should be noted that our results for oxygen on the whole seem to be more sensitive to the Teff and Vt variations then the previous results for carbon and nitrogen. We omitted 12 stars with unreliable log (O) in Table 2; however, we hope to redetermine in future more exactly both their basic parameters and the CNO abundances.
When deriving the oxygen abundance log (O) for 51 stars in Table 2, we used from 4 to 10 lines for each star. We evaluated that the mean errors in log (O) from the analyzed O i lines vary from 0.07 to 0.22 dex, if the uncertainties = 100 K, = 0.2 and = 0.3 km/s are adopted. The errors in log (O) presented in Table 2 take into account as well the uncertainty in fitting of computed to the observed profiles.
In Fig. 4 we show the derived oxygen abundance log (O) for programme stars as a function of two basic stellar parameters, namely the effective temperature (upper panel) and the surface gravity (lower panel). Two important values are shown by dashed lines: first, S - the solar O abundance log (O) = 8.69 (Asplund et al., 2009); second, B - the mean O abundance log (O) = 8.72 for the unevolved early B-type MS stars (Lyubimkov, 2013). As known, the CNO-abundances for such stars can be considered as the initial CNO-abundances for AFG supergiants and bright giants, descendants of B-type MS stars.


One may see from Fig. 4 that the derived log (O) values agree within their error bars with the S and B lines that correspond to the initial O abundance. Moreover, there is no trend with or across the interval from 4500 to 8500 K and the interval from 1.2 to 2.9 dex. We may conclude that, within possible uncertainties, the O abundance in the stars studied did not change markedly on either the main sequence or in evolution to the AFG supergiant stage.
Lack of a tie between O abundance and a star’s evolutionary stage contrasts sharply with results for the C and N abundances found in Papers II and IV, i.e., carbon deficiencies of between and dex and nitrogen overabundances of to dex in the supergiants, as compared with the Sun, and crucially a tight correlation between the C deficiency and the N overabundance. The contrast between C-N correlation and the independence of O on the evolutionary stage is readily understood in qualitative terms. First, the CN-cycle component of the H-burning CNO-cycles operates much faster than the ON-cycle. Thus, the CN-cycle converts C to N while leaving O almost completely unaffected. Operation of the ON-cycle, generally requiring higher temperatures, converts O to N but may raise the N abundance considerably above that provided by the CN-cycle; the initial O abundance is a factor of two greater than the initial C abundance. Second, predictions about changes to surface abundances of C, N and O caused by rotationally-induced mixing confirm the weaker role for the ON-cycle relative to the CN-cycle. For example, the computations of Heger & Langer (2000) predict that for AFG supergiants in the post-FDU phase the log (O) may be lowered by 0.05 dex for = 200 km/s and 0.15 dex for = 300 km/s. Only for rare stars with high rotational velocities 400 km/s the log (O) changes become observable. Predicted changes to C and N abundances are much larger, anti-correlated and comparable to the observed values.
5 THE N/C vs N/O RELATION
In pursuit of a quantitative comparison between observations and predictions of the mixing to their surface of products of the H-burning CNO-cycles – both the CN-cycle and the ON-cycle – we utilize the N/C vs N/O relation which may be considered a sensitive indicator of products of the CNO-cycles (Maeder et al., 2014). In order to construct this relation, it is necessary to have abundances of all three elements - C, N and O. Along with abundances obtained for oxygen in the present work, we used the previous data for nitrogen and carbon from Papers II and IV. As a result, we have the C, N and O abundances for 17 stars, i.e., for 1/3 of 51 stars analyzed for O in the present work.
These 17 stars and their C, N and O abundances are presented in Table 3. The abundances are given relatively to solar abundances. For example, the [C/Fe] value is defined as [C/Fe] = log (C/Fe) – log (C/Fe), where log (C/Fe) = log (C) – log (Fe). When calculating [C/Fe], [N/Fe] and [O/Fe] for stars in Table 3, we adopted the solar abundances C, N, O and Fe from Asplund et al. (2009) review. It should be noted that thanks to use of relative values [C/Fe], [N/Fe] and [O/Fe] instead of the standard abundances log (C), log (N) and log (O) we may compensate for differences in the metallicity [Fe/H] between stars.
| HR | [C/Fe] | [N/Fe] | [O/Fe] | [N/C] | [N/O] | log (C+N+O) |
|---|---|---|---|---|---|---|
| 292 | -0.34 | 0.61 | 0.13 | 0.950.17 | 0.480.22 | 9.090.25 |
| 1017 | -0.12 | 0.65 | 0.20 | 0.770.16 | 0.450.14 | 9.050.19 |
| 1740 | -0.12 | 0.37 | 0.07 | 0.490.13 | 0.300.17 | 8.900.20 |
| 1865 | -0.69 | 0.87 | 0.00 | 1.560.17 | 0.870.17 | 9.060.23 |
| 2597 | -0.21 | 0.50 | 0.26 | 0.710.38 | 0.240.35 | 8.940.43 |
| 3102 | -0.24 | 0.41 | 0.05 | 0.650.32 | 0.360.32 | 9.070.38 |
| 3183 | -0.08 | 0.25 | 0.00 | 0.330.16 | 0.250.18 | 8.970.24 |
| 6081 | -0.03 | 0.44 | -0.07 | 0.470.09 | 0.510.17 | 8.970.18 |
| 6978 | -0.30 | 0.51 | 0.12 | 0.810.13 | 0.390.17 | 8.920.20 |
| 7014 | -0.13 | 0.60 | 0.25 | 0.730.22 | 0.350.26 | 9.070.30 |
| 7094 | -0.16 | 0.51 | 0.09 | 0.670.22 | 0.420.24 | 8.830.28 |
| 7264 | -0.18 | 0.64 | 0.17 | 0.820.23 | 0.470.23 | 8.920.31 |
| 7387 | -0.40 | 0.81 | 0.03 | 1.210.20 | 0.780.24 | 9.010.28 |
| 7770 | -0.11 | 0.53 | 0.15 | 0.640.19 | 0.380.19 | 8.850.24 |
| 7823 | -0.23 | 0.73 | 0.13 | 0.960.21 | 0.600.21 | 8.950.25 |
| 7834 | -0.21 | 0.37 | 0.13 | 0.580.19 | 0.240.18 | 9.010.23 |
| 7876 | 0.00 | 0.13 | 0.26 | 0.130.18 | -0.130.24 | 8.900.27 |
The [N/C] and [N/O] values in Table 3 were defined according to the following formulae: [N/C] = [N/Fe] – [C/Fe] and [N/O] = [N/Fe] – [O/Fe]. The derived [N/C] and [N/O] values (filled circles) and their error bars are shown in Fig. 5. One may see that there is an obvious correlation between [N/C] and [N/O]. The [N/C] increase from 0 to 1.6 dex is accompanied by the [N/O] increase from 0 to 0.9 dex.
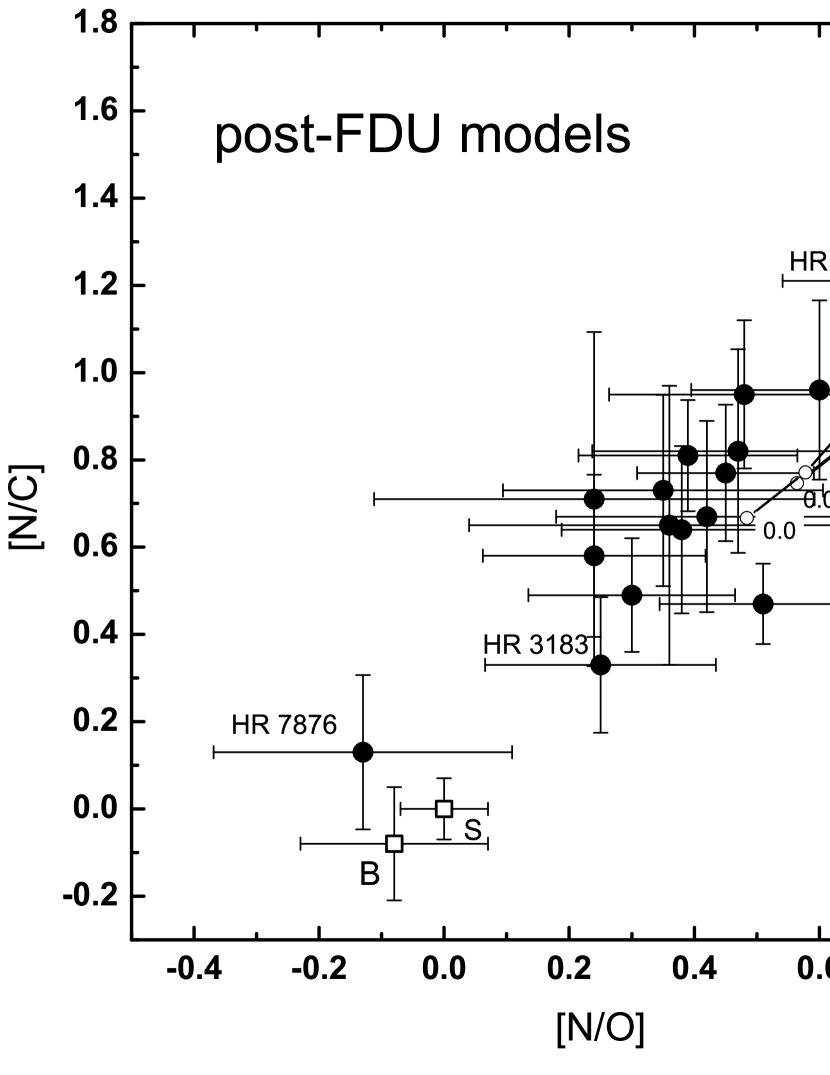
It is interesting to compare this observed relation with predictions of the theory. We used for such comparison computation of Georgy et al. (2013) for rotating stellar models. Results for two evolutionary phases, post-MS and post-FDU, are shown in Fig. 5 separately (upper and lower panels, respectively). It should be noted that Georgy et al. obtained their C, N and O abundances as mass fractions; we converted their values into our scale (by number of atoms). Note as well that we used their results obtained for the solar metallicity = 0.014 (see their Table 2); we identified their ”End of H-burning“ as the post-MS phase and their ”End of He-burning“ as the post-FDU phase.
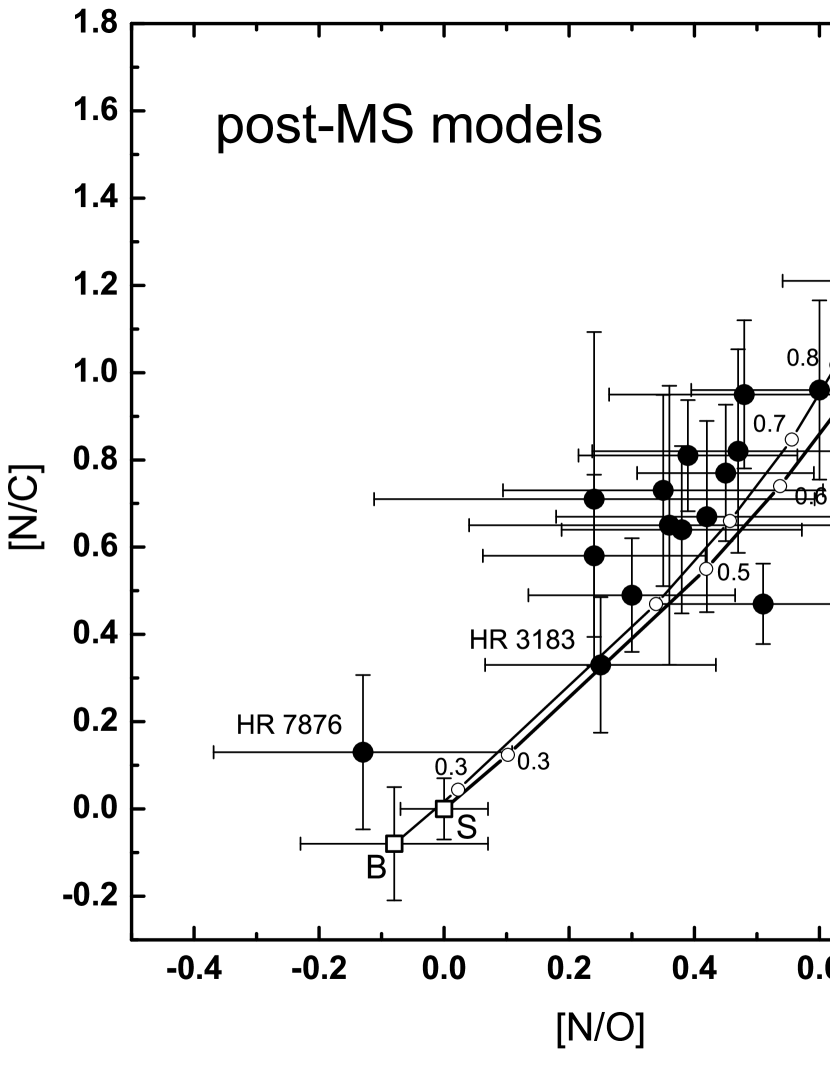
Maeder et al. (2014) noted that the theoretical [N/C] vs [N/O] relation is slightly dependent on the stellar mass M. Therefore, we show in Fig. 5 the theoretical data for the mass = 9 M☉, that is approximately the mean mass for stars of our sample. Nodal points on the theoretical tracks (open circles) in Fig. 5 correspond to the various initial angular velocities / from 0 to 0.95, where is a critical angular velocity. The relation between the / values and the corresponding equatorial velocities is presented in Table 4. One may see from Fig. 5 that theoretical [N/C] and [N/O] values depend strongly on the initial rotational velocity.
| / | (km/s) |
|---|---|
| 0.00 | 0 |
| 0.10 | 40 |
| 0.30 | 130 |
| 0.50 | 216 |
| 0.60 | 261 |
| 0.70 | 311 |
| 0.80 | 381 |
| 0.90 | 466 |
| 0.95 | 492 |
In order to consider the N/C vs N/O relation as an evolutionary phenomenon, we should indicate the initial values log(N/C) = log (N) – log (C) and log (N/O) = log (N) – log (O). We adopted at first Asplund et al.’s (2009) data for the Sun, namely log(N/C) = –0.60 and log (N/O) = –0.86; remind that the [N/C] and [N/O] values in Table 3 were related just to these Asplund et al.’s values. It is important that in Georgy et al.’s computations presented in Fig. 5 practically the same initial values log(N/C) and log(N/O) have been adopted. In Fig. 5 the point S with zero coordinates corresponds to these initial values.
It should be noted that the solar C, N and O abundances are known presently with high accuracy. For instance, if one takes Caffau et al. (2011) data instead of Asplund et al.’s values, the corresponding ”zero point“ in Fig. 5 would have the coordinates [N/C] = –0.04 and [N/O] = –0.04. Next, if we adopt the C, N and O abundances determined by us for the Sun with our non-LTE technique, ”zero point“ would have the coordinates [N/C] = –0.06 and [N/O] = –0.06.
Apart from these very close solar data, we used the above-mentioned CNO-abundances determined for the unevolved early B-type MS stars (Lyubimkov, 2013). These data can be actually considered as the initial abundances for AFG supergiants and bright giants, which are descendants of the B-type MS stars. The corresponding ”zero point“ B in Fig. 5 has the coordinates [N/C] = –0.08 and [N/O] = –0.08. Note that ”zero points“ S and B correspond to the zero initial velocity = 0 km/s.
One may see that two theoretical curves with beginning at the points S and B are very close. On the whole, from the qualitative point of view, there is a good agreement between these theoretical predictions and the observed [N/C] vs [N/O] relation. Both theoretical curves lie within error bars in Fig. 5. Positions of the curves show a little shift and remain within error bars, if we use Georgy et al. (2013) computations for other masses instead of = 9 M☉. We arrive at the same conclusion, when using earlier computations, for instance, Heger & Langer (2000) ones.
It is obvious that this relation is explained by the strong dependence on the initial rotational velocity : the higher the velocity the greater on average the values [N/C] and [N/O]. Note that the same explanation, i.e. dependence on , has been found in Paper IV for the N vs C anticorrelation in AFG supergiants and bright giants. These phenomena reflect the presence on a surface of rotating stars of the mixed material from stellar interiors. So, a majority of these stars passed through the rotationally induced mixing during the MS stage and/or the FDU phase.
As far as the quantitative agreement between theory and observation in Fig. 5, a detailed discussion is needed. We shall discuss as well our earlier relations for CNO abundances and an accordance of the relations obtained with the expected initial rotational velocities of stars.
6 DISCUSSION
A role of rotation seems to be very important. In this connection the following question arises: what the real initial rotational velocities occur for stars in question? In other words, what is it known about the values for the early B-type MS stars that are progenitors of AFG supergiants? We note once again that the stars of both types have masses = 4-19 M☉. The problem of observed rotational velocities for the MS stars of various spectral types is discussed in Lyubimkov (2018) review on light elements in stars.
In particular, it is noted there that modern observational data show that most of early B stars (about 80 %) had low rotational velocities 0-150 km/s at the beginning of evolution on MS. Moreover, a substantial fraction of them fell within a still narrower interval, 0-50 km/s. On the other hand, the number of stars with relatively high rotational velocities from 150 to 300-400 km/s is small (about 20 %). These results are very important for an interpretation of the observed evolutionary changes in abundances of light elements including the C, N and O abundances.
As an example of good agreement with these results, one may indicate an analysis of the N/O ratio for 46 early B-type MS stars (Lyubimkov, 2016, 2018). It was found that most of the stars near the MS termination (82 %) show the relatively low values [N/O] 0.3; from the viewpoint of the theory (Georgy et al., 2013), these stars had the low initial rotational velocities from 0 to 130 km/s. Only for 4 stars (18 %) the enhanced values [N/O] = 0.4-0.8 were derived; the models with = 220-300 km/s correspond to them. So, this study displays a very good accordance between three independent sets of data, namely 1) the abundances determined from observed spectra; 2) the abundances computed from rotational models; 3) the expected initial rotational velocities for stars in question.
Is there such accordance in the case of AFG supergiants and bright giants? In order to answer this question, it would be useful to remember the above-mentioned N vs C anticorrelation in these stars obtained by Lyubimkov et al. (2015) (see Fig.12 there). Like the present paper, a comparison between the observed and computed relations has been implemented there for the same two phases: post-MS and post-FDU. It should be noted that the earlier computations of Heger & Langer (2000) were used there, because the calculated N and C abundances are not presented in Georgy et al. (2013) work. It was found by Lyubimkov et al. (2015) that the most of the stars forms on the observed N vs C relation a compact cluster with [C/Fe] between –0.1 and –0.4 and with [N/Fe] between 0.3 and 0.7; they may be identified as either post-MS objects with 200-250 km/s or post-FDU objects with 0-150 km/s. So, there was some ambiguity in evolutionary status of these stars.
Recently this problem was solved by Lyubimkov (2018) on the basis of the above-mentioned data on the initial rotational velocities of the stars. Since about 80 % of the stars studied should have 150 km/s at the beginning of their evolution, it is obvious that the overwhelming majority of stars in the indicated cluster on the N vs C relation are the post-FDU objects with 0-150 km/s. The number of these stars is 19, i.e. 83 % of a total number of the most probable post-FDU stars (23 in all). The remaining 4 stars (17 %) with the highest nitrogen abundances [N/Fe] = 0.8-0.9, according to rotating models, correspond to velocities 200- 300 km/s. One may conclude that the N vs C anticorrelation observed for AFG supergiants and bright giants also shows a good agreement both with the predicted N vs C relation and with the expected rotational velocities.
Returning to Fig. 5, we should remind that the initial relative angular velocities / are marked there nearby the nodal points on theoretical curves. These values vary from 0 (for ”zero points“ S and B) to 0.95; the corresponding equatorial velocities for the 9 M☉ model are presented in Table 4. Basing on these values, we may analyze consecutively both cases in Fig. 5, i.e. both the post-MS phase and the post-FDU phase.
Basing on the above-mentioned data concerning the most probable initial rotational velocities 150 km/s for stars in question, we may see that only one star, HR 7876 (marked in Fig. 5), corresponds exactly to this upper limit. It was shown in Paper IV that this star with the almost unchanged C and N abundances is the post-MS object with 100 km/s or less. One more star nearby HR 7876 in Fig. 5, namely HR 3183 is close to the limit value = 150 km/s. However, majority of the remaining stars, 15 of 17, are located markedly higher than = 150 km/s. Only a little part of them can be in the post-MS phase; we may suppose that they are mostly in the post-FDU phase.
Two F supergiants, HR 7387 and HR 1865 (marked in Fig. 5), with the highest [N/C] values (1.21 and 1.56 respectively) are of special interest. In the case of HR 7387 a good agreement with model computations is obtained for 200-250 km/s, whereas in the case of HR 1865 ( Lep) the agreement is attained for 400 km/s. (Note that HR 1865 is the most massive star in Fig. 5; its mass is 13.9 M☉).
Locations of all other stars (13 in all), if they are post-FDU objects, correspond to the initial velocities between 0 and 130 km/s. Nevertheless, it is necessary to note that among these 13 stars a little part (maybe 1-2 stars) can be the post-MS objects with 200- 300 km/s. Then a total number of stars with 150 km/s in Fig. 5 would be about 80 % that is in excellent agreement with the observed distribution of stars on .
Therefore, the observed C, N and O abundances in AFG supergiants and bright giants, in particular, the observed N vs C and N/C vs N/O relations show good agreement with predictions of modern theory, i.e. with computations of rotating models.
An important test of reliability of the derived C, N and O abundances could be a conservation of the total C+N+O abundance during stellar evolution. In other words, according to the theory, the total value log (C+N+O) should remain the same from the beginning of the MS stage to the end of the AFG supergiant stage.
The derived values log (C+N+O) for 17 stars are presented in last column of Table 3. Their dependences on the basic parameters and are shown in Fig. 6a and Fig. 6b, respectively. We show for comparison in Figs 6c, d similar dependences for the oxygen abundances log (O) for the same 17 stars. One may see that there are no trends with and neither for log (C+N+O) nor for log (O). Moreover, there is a very good agreement (within error bars) with the initial values presented by dashed straight lines S (the Sun) and B (unevolved B stars).
We obtained the mean value log (C+N+O) = 8.970.08 for 17 stars in Fig. 6, whereas the initial value is log (C+N+O) = 8.92 (S) or 8.94 (B). Therefore, the sum C+N+O is actually conserved, and this fact confirms once more a good agreement between observations and the theory.


Nevertheless, it should be stated that such accordance between observations and the theory exists not always. As noted in Lyubimkov (2018) review, there is a significant discrepancy between observations and the theory for helium, the main product of CNO-cycle. The same computations of Georgy et al. (2013), which seem to be successful in the case of C, N and O, cannot explain the observed helium enrichment in the B-type MS stars. The predicted He enrichment is too small, especially for the most typical initial velocities 150 km/s. It is evident that the theory should be substantially perfected in order to correspond to the observed He enrichment.
7 Conclusions
Thus, our non-LTE analysis of the oxygen abundance for 51 Galactic A-, F- and G-type supergiants and bright giants (luminosity classes I and II) led to the following conclusions.
In contrast with carbon and nitrogen, oxygen did not show any significant systematic anomalies in their abundances log (O) for stars in question. There is no marked difference from the initial oxygen abundance within errors of the log (O) determination across the Teff interval from 4500 to 8500 K and the interval from 1.2 to 2.9 dex. This result agrees well with theoretical predictions, which show for AFG supergiants in the post-FDU phase that the log (O) lowering is less than 0.15 dex if the initial rotational velocities 300 km/s.
With our new results for oxygen and our earlier non-LTE determinations of the N and C abundances for stars from the same sample, we constructed the [N/C] vs [N/O] relation for 17 stars. A correlation between these values is found to be pronounced; the observed [N/C] increase from 0 to 1.6 dex is accompanied by the [N/O] increase from 0 to 0.9 dex.
The observed [N/C] vs [N/O] relation is compared with the theoretical predictions for stellar models with rotation. Such a comparison shows that this relation reflects a strong dependence of the evolutionary changes in CNO abundances on the initial rotation velocities of stars. Early the same conclusion was made for the N vs C anticorrelation observed for these stars (Paper IV).
It is shown that the stars studied are mostly the post-FDU objects with the initial rotational velocities 150 km/s. It is important that just such velocities are typical for about 80 % of stars in question, i.e. for stars with masses 4-19 M☉. It is confirmed that the star HR 7876 is the post-MS and the pre-FDU object with 100 km/s or less. The F supergiants HR 7387 and HR 1865 with the highest [N/C] values (1.21 and 1.56 respectively) are likely the post-FDU objects with 200-250 km/s and 400 km/s, respectively.
A constancy of the total C+N+O abundance during stellar evolution is confirmed. The mean value log (C+N+O) = 8.970.08 found by us for AFG supergiants and bright giants seems to be very close to the initial value 8.92 (the Sun) or 8.94 (the unevolved B-type MS stars).
Therefore, one may claim that theoretical predictions based on stellar models with rotations seem to be successful in explanation of the observed C, N and O abundances both in the B-type MS stars and in the AFG-supergiants and bright giants. However, it is necessary to note that the same models cannot explain the observed helium enrichment in the B-type MS stars. So, further perfecting of the theory is needed.
Acknowledgements
We thank our referee for thorough comments and useful remarks. DLL thanks the Robert A. Welch Foundation of Houston, Texas for support through grant F-634.
References
- Allende Prieto et al. (2001) Allende Prieto C., Lambert D. L., Asplund M., 2001, ApJ, 556, L63
- Amarsi et al. (2016) Amarsi A. M., Asplund M., Collet R., Leenaarts J., 2016, MNRAS, 455, 3735
- Asplund et al. (2009) Asplund M., Grevesse N., Sauval A. J., Scott P., 2009, ARA&A, 47, 481
- Barklem (2007) Barklem P. S., 2007, A&A, 462, 781
- Caffau et al. (2011) Caffau E., Ludwig H. G., Steffen M., Freytag B., Bonifacio P., 2011, Sol. Phys., 268, 255
- Carlsson (1986) Carlsson M., 1986, Uppsala Astronomical Observatory Reports, 33
- Georgy et al. (2013) Georgy C., Ekström S., Granada A., Meynet G., Mowlavi N., Eggenberger P., Maeder A., 2013, A&A, 553, A24
- Heger & Langer (2000) Heger A., Langer N., 2000, ApJ, 544, 1016
- Korotin et al. (1999) Korotin S. A., Andrievsky S. M., Luck R. E., 1999, A&A, 351, 168
- Korotin et al. (2014) Korotin S. A., Andrievsky S. M., Luck R. E., Lépine J. R. D., Maciel W. J., Kovtyukh V. V., 2014, MNRAS, 444, 3301
- Kramida et al. (2018) Kramida A., Ralchenko Y., Nave G., Reader J., 2018, in APS Division of Atomic, Molecular and Optical Physics Meeting Abstracts. p. M01.004
- Kurucz (1993) Kurucz R., 1993, ATLAS9 Stellar Atmosphere Programs and 2 km/s grid. Kurucz CD-ROM No. 13. Cambridge, 13
- Luck (1978) Luck R. E., 1978, ApJ, 219, 148
- Luck & Lambert (1985) Luck R. E., Lambert D. L., 1985, ApJ, 298, 782
- Lyubimkov (2013) Lyubimkov L. S., 2013, Astrophysics, 56, 472
- Lyubimkov (2016) Lyubimkov L. S., 2016, Astrophysics, 59, 461
- Lyubimkov (2018) Lyubimkov L. S., 2018, Astrophysics, 61, 262
- Lyubimkov & Samedov (1990) Lyubimkov L. S., Samedov Z. A., 1990, Astrophysics, 32, 30
- Lyubimkov et al. (2010) Lyubimkov L. S., Lambert D. L., Rostopchin S. I., Rachkovskaya T. M., Poklad D. B., 2010, MNRAS, 402, 1369
- Lyubimkov et al. (2011) Lyubimkov L. S., Lambert D. L., Korotin S. A., Poklad D. B., Rachkovskaya T. M., Rostopchin S. I., 2011, MNRAS, 410, 1774
- Lyubimkov et al. (2012) Lyubimkov L. S., Lambert D. L., Kaminsky B. M., Pavlenko Y. V., Poklad D. B., Rachkovskaya T. M., 2012, MNRAS, 427, 11
- Lyubimkov et al. (2015) Lyubimkov L. S., Lambert D. L., Korotin S. A., Rachkovskaya T. M., Poklad D. B., 2015, MNRAS, 446, 3447
- Maeder et al. (2014) Maeder A., Przybilla N., Nieva M.-F., Georgy C., Meynet G., Ekström S., Eggenberger P., 2014, A&A, 565, A39
- Meléndez & Asplund (2008) Meléndez J., Asplund M., 2008, A&A, 490, 817
- Mishenina et al. (2000) Mishenina T. V., Korotin S. A., Klochkova V. G., Panchuk V. E., 2000, A&A, 353, 978
- Ryabchikova et al. (2015) Ryabchikova T., Piskunov N., Kurucz R. L., Stempels H. C., Heiter U., Pakhomov Y., Barklem P. S., 2015, Phys. Scr., 90, 054005
- Tsymbal (1996) Tsymbal V., 1996, in Adelman S. J., Kupka F., Weiss W. W., eds, Astronomical Society of the Pacific Conference Series Vol. 108, M.A.S.S., Model Atmospheres and Spectrum Synthesis. p. 198
- Tull et al. (1995) Tull R. G., MacQueen P. J., Sneden C., Lambert D. L., 1995, PASP, 107, 251