Thermophysical modeling of NEOWISE observations of DESTINY+ targets Phaethon and 2005 UD.
Abstract
Thermophysical models allow for improved constraints on the physical and thermal surface properties of asteroids beyond what can be inferred from more simple thermal modeling, provided a sufficient number of observations is available. We present thermophysical modeling results of observations from the NEOWISE mission for two near-Earth asteroids which are the targets of the DESTINY+ flyby mission: (3200) Phaethon and (155140) 2005 UD. Our model assumes a rotating, cratered, spherical surface, and employs a Monte Carlo Markov Chain to explore the multi-dimensional parameter space of the fit. We find an effective spherical diameter for Phaethon of km, a geometric albedo of , and a thermal inertia , using five epochs of NEOWISE observations. The best model fit for (155140) 2005 UD was less well constrained due to only having two NEOWISE observation epochs, giving a diameter of km and a geometric albedo of .
1 Introduction
Near-Earth asteroids (NEAs) are compelling targets for study because of the hazard they pose to Earth due to their proximity to Earth’s orbit. NEAs are remnants from the formation of the Solar system, having recently been injected into near-Earth space from more distant reservoir populations (Binzel et al., 2015). Their complex history is reflected in the wide diversity of physical characteristics they are observed to have: internal structures from rubble piles to monoliths (Fujiwara et al., 2006; Polishook et al., 2017); shapes ranging from nearly spherical to elongated bi-lobes (Busch et al., 2011; Shepard et al., 2018); thermal histories from pristine to highly evolved (Barucci et al., 2018; Popescu et al., 2018). The natural link between NEAs and meteorites in worldwide collections provides a unique (though biased by atmospheric entry) ground-truth against which to compare NEA observations (e.g. Jenniskens et al., 2009), while the same proximity of NEAs that makes them a hazard also means they are convenient targets for spacecraft missions (e.g. Cheng, 2002; Yoshikawa et al., 2015; Ishiguro et al., 2014; Lauretta et al., 2017).
The DESTINY+ mission, currently being developed by JAXA, will conduct a flyby of NEA (3200) Phaethon and (155140) 2005 UD111https://destiny.isas.jaxa.jp/science/ (Arai et al., 2018, 2019). Phaethon has been linked to the Geminid meteor shower (Gustafson, 1989). There has been no evidence of sublimation-based cometary activity, however the brightening of this object at perihelion (Jewitt & Li, 2010; Li & Jewitt, 2013) has been linked to thermal cracking and dust lofting (e.g. Delbo et al., 2014) though the observed activity is not sufficient to explain the mass of the meteor shower. Previous observations have shown that Phaethon is a B-class asteroid based on visible light spectroscopy (Bus & Binzel, 2002; Neese, 2010), with a moderate geometric visible albedo of (Tedesco et al., 2004).
The NEA (155140) 2005 UD has been linked to Phaethon both dynamically and spectroscopically (Ohtsuka et al., 2006; Jewitt & Hsieh, 2006), implying that these two objects potentially formed from a single precursor object. Given the similarity in their orbits, it is possible that these two objects separated after moving into near-Earth orbital space. Observations from DESTINY+ would provide critical information for understanding the origin of these bodies.
Here we present new results for both of these objects, providing constraints on their physical properties based on the thermal emission observations from the NEOWISE survey data.
2 Data
We base this study on observations from the Wide-field Infrared Survey Explorer (WISE) satellite (Wright et al., 2010) which was used to conduct the Near-Earth Object WISE (NEOWISE) surveys (Mainzer et al., 2011a, 2014) during the cryogenic, 3-band cryogenic, post-cryogenic (Cutri et al., 2012), and Reactivation mission phases (Cutri et al., 2015). WISE was launched on 14 Dec 2009, and surveyed the sky from a Sun-synchronous polar orbit starting 7 Jan 2010, using beamsplitters to simultaneously take images at four infrared wavelengths: m, m, m, and m (known as W1, W2, W3, W4, respectively). After the outer cryogen tank was exhausted on 6 Aug 2010 the optics warmed up and the W4 channel was no longer able to be used to obtain survey data. W3 continued operation as the background temperature rose with decreasing exposure times until 29 Sept 2010 when the inner cryogen reserve was exhausted, causing the detectors to warm up. Operations were continued in 2-band post-cryo operations until 1 Feb 2011 when the telescope was put in hibernation. The 2 band survey was resumed 13 Dec 2013, and is currently on-going having recently completed 5 years of restarted operations.
This long operation period in nearly unchanging environmental conditions has resulted in some of the asteroids and comets observed having multiple detections at a range of orbital locations and viewing geometries, producing a well-calibrated and uniform data set. Using the WISE Catalog Search Tool at the Infrared Science Archive (https://irsa.ipac.caltech.edu) we performed a moving object search for all detections of our two objects of interest over all mission phases: (3200) Phaethon and (155140) 2005 UD. We find five epochs with detections of Phaethon in at least one band at high SNR (), one from the very beginning of the cryogenic survey and four from the Reactivation mission. For 2005 UD, we find two observation epochs, both during the Reactivation mission. We present the details of these data in Table 1. For detections from the Reactivation data, we use the reported AllWISE atlas source search results to filter out detections of background static astrophysical sources, removing any detection with an atlas counterpart brighter than one magnitude below the brightest band of the nominal moving object detection (W2 for objects near the Earth’s orbit).
Following the recommendations of the WISE Explanatory Supplement (Cutri et al., 2012), we set a minimum error of mag for all detections. For the most recent Phaethon observing epoch, the measured W2 magnitude was in the saturated regime. As discussed in Cutri et al. (2012), Section 6.3.c.i.4, and related Figure 6.3.8b, W2 band measurements for stars with magnitudes brighter than mag begin to show a linear deviation in their W2 color, resulting in a flux over-estimation for saturated sources. This is potentially due to a flux-dependent PSF shape in W2, but no cause for this effect is known.
We attempt to correct this flux overestimation by making a linear fit to the W2 color vs W2 magnitude plot in the explanatory supplement using the following procedure. For detections with mag:
| (1) |
Our observations of these two targets span a range of phase angles from . In Wright (2007), the thermophysical model (TPM) we use here was employed for data up to phase angles of , and thus the relatively large phase angles used here should not be beyond the bounds of the model. Mommert et al. (2018) showed through theoretical analysis that thermal model accuracy can be lower at extremely high phase angles, so care must be taken when interpreting these cases.
| Target | MJD | RA | Dec | Rhelio | phase angle | Number of | |||||
| midpoint | (deg) | (deg) | (AU) | (AU) | (deg) | Detections | (mag) | (mag) | (mag) | (mag) | |
| (3200) Phaethon | 55203.257 | 9.794 | +22.587 | 2.3170 | 2.07544 | 25.1 | 3 | 17.19 0.47† | 18.13 2.97† | 8.77 0.07 | 6.14 0.07 |
| (3200) Phaethon | 57035.346 | 21.646 | +16.851 | 1.3274 | 0.83122 | 47.7 | 7 | 14.34 0.04 | 11.26 0.03 | … | … |
| (3200) Phaethon | 57663.549 | 239.600 | +84.379 | 1.0813 | 0.40568 | 67.7 | 3 | 12.42 0.03 | 9.18 0.03 | … | … |
| (3200) Phaethon | 57729.562 | 350.026 | +22.871 | 1.8323 | 1.33255 | 31.5 | 27 | 16.16 0.09 | 14.01 0.05 | … | … |
| (3200) Phaethon | 58104.215 | 3.777 | +25.015 | 1.0067 | 0.06905 | 68.9 | 1 | 7.74 0.03 | 3.53 0.03†† | … | … |
| (155140) 2005 UD | 57750.591 | 357.719 | +47.069 | 1.3626 | 0.78202 | 45.2 | 7 | 16.78 0.35 | 13.96 0.13 | … | … |
| (155140) 2005 UD | 58383.429 | 89.606 | +5.946 | 1.0312 | 0.24469 | 76.7 | 3 | 13.94 0.13 | 10.68 0.06 | … | … |
This table describes the different epochs of observation used for our
modeling. Each row gives the mean MJD, right ascension and
declination of observation, distance to the sun and spacecraft,
magnitude in each WISE band, and the number of times the object was
detected in at least one band for each epoch. †This is an
upper limit extracted using forced photometry by the WISE photometric
pipeline.
††Saturated detection corrected
following Equation 1
‘…’ indicates no measurement
available
3 Thermophysical Model
3.1 Model Description
In order to simultaneously fit all observations of these two NEAs, we employ a thermophysical model to constrain the diameter, albedo, thermal inertia, pole position, and surface cratering fraction (analogous to surface roughness in other TPM implementations). For our TPM we employ a rotating, crater model described in Wright (2007) and Koren et al. (2015), using a Monte Carlo Markov Chain (MCMC) to more efficiently explore the multi-dimensional parameter space. Many previous analyses of NEOWISE data (e.g. Mainzer et al., 2011d; Masiero et al., 2018, etc.) have relied on the Near-Earth Asteroid Thermal Model (NEATM; Harris, 1998), which has fewer free parameters and runs orders of magnitude faster. However, NEATM relies on a non-physical “beaming parameter” that varies with phase and observing circumstance as well as the actual thermal, optical, and mechanical properties of the object (Wright et al., 2018). It is difficult to use beaming to infer these physical properties beyond identifying outliers that are candidate metallic objects or rapid rotators (Harris & Drube, 2014).
Our TPM uses as inputs the mean flux at each observing epoch, including forced photometry derived upper-limit fluxes reported by the WISE and NEOWISE source catalogs, as well as the midpoint modified Julian date, the observed RA and Dec, the observer-to-asteroid distance (queried from the JPL Horizons222https://ssd.jpl.nasa.gov/horizons.cgi system for each epoch), the visible absolute magnitude, and the rotation period if available. For these fits, we use rotation periods of 3.603958 hours for Phaethon and 5.231 hours for 2005 UD (Warner et al., 2018).
To account for the color corrections necessary to properly model the WISE passbands, we use the analytical function described in Wright (2013) to calculate the output magnitude from the model for each band :
| (2) |
where is the output color-corrected magnitude, and are the weights, and and are the model fluxes at the two characteristic wavelengths evaluated. We use weights:
and wavelengths:
The absolute visible magnitude we use to fit the visible-light component of the spectrum is drawn from the most recent value published, allowing us to constrain the geometric visible albedo and the ratio between the visible and infrared (m) albedos. In this work, we use for Phaethon (Hanus̆ et al., 2016) and for 2005 UD (from the Minor Planet Center333https://minorplanetcenter.net). Note that these input H values are treated as observational measurements along with IR data during the MCMC, so the and parameters in the model may not exactly reproduce the input.
Our TPM assumes a variable fraction of the surface is covered by craters, which provide self-heating to unlit regions. These craters are not meant to represent the actual fraction of the surface with visible impact markings, but rather provide a similar effect to “roughness” parameters used in other TPM implementations (e.g. Delbo’ et al., 2015, and references therein).
The MCMC uses the two-Rayleigh fit to the NEO albedo distribution from Wright et al. (2016) as the prior on the albedo distribution. The prior for the ratio is assumed to be log-normal. Priors on other distributions are assumed to be uniform, with the diameter and thermal inertia priors uniform in space, the crater fraction uniform in linear space, and the pole distribution uniform over steradians. Our routine performs 72,900 accepted steps in the MCMC, and reports the posterior parameter distribution based on the last 48,600 steps. The median plus the and percentile for each parameter are reported, along with the best fit model. The best fit is determined by the at each step of the MCMC, which is the sum of the squares of the infrared flux deviations plus the deviation of the model magnitude from the input , each weighted by the associated measurement uncertainty.
3.2 Model Validation
In order to validate the outputs of our TPM, in particular the diameter accuracy, we conducted model fits to 23 objects that were observed at multiple epochs by NEOWISE and also had high quality size measurements from independent methods. In this case we selected 22 Main Belt asteroids that had high quality occultation measurements (quality code or ) from Herald et al. (2018), as well as the NEO (433) Eros, which has both high quality occultation measurements as well as 3D shape model information from the NEAR spacecraft rendezvous (Veverka et al., 2000).
Table 2 shows the objects used for this validation test. The standard diameter (Dstd) used for comparison is the error-weighted average of the circular-equivalent radius of the ellipse fit to the occultation, for all U=3 and U=4 occultations. In the case of (433) Eros, we also show the spherical equivalent diameter from the 3D ellipsoid from the NEAR observations. We also list the size reported by our TPM (DTPM) and the number of epochs of NEOWISE data used for the fit. All objects were observed once or twice during the 2010-2011 mission phase, with the rest of the epochs coming from the reactivation mission.
For both asteroids (393) and (554), one observation epoch was obtained during the end of the 3-band cryo mission, when the integration time had been reduced to seconds due to the increasing background (Cutri et al., 2012). The W2-W3 color for these two objects in this epoch were significantly different from what was expected based on other Main Belt asteroids observed during the cryogenic mission. This is likely a symptom of the changing zero points and calibrations during the end stage of warm up. As the W3 zero points are not well-determined for these cases, we have excluded them from our modeling effort, as noted in the table. The remaining detections for the Main Belt objects were typically in the saturated regime for the cryogenic W3 and W4 detections, and in some cases in the W2 detections as well. Because of this, they are not ideal calibrators; however, the vast majority of objects with high-quality size measurements from occultations are these large MBAs. Therefore, they represent a reasonable validation set, but caution is recommended.
Additionally, as (433) Eros is a highly elongated object and the occultation data appear to be from a viewing geometry oriented along the long axis of the body, a more accurate comparison for the results from the TPM are to the spherical equivalent size. We list both diameters in Table 2, but only include the comparison with the NEAR data in Figure 1. This figure shows the fractional difference between the ground-truth sizes and the TPM-derived sizes, as well as the mean of these differences. The mean offset is (with the TPM results being slightly smaller), with 16th and 84th percentiles of and .
It should be noted that while the measurement error on occultation chords is typically smaller than (set by the speed of frame acquisition and length of the occultation), inferred sizes are subject to projection effects and can be significantly offset from the spherical equivalent size for elongated objects. The deviation in the occultation size of Eros from the in situ measurements is an example of this situation. Thus, while this validation process shows that for the bulk population the TPM-derived spherical equivalent diameters agree with the averaged occultation diameters, significant offsets are possible and we cannot say for individual cases where there is a discrepancy which size determination is more reliable.
| Asteroid Number | Dstd | DTPM | Number of NEOWISE epochs |
|---|---|---|---|
| km | km | ||
| 17 | 70.8 | 77.0 | 8 |
| 51 | 146.1 | 138.4 | 8 |
| 81 | 117.8 | 117.1 | 8 |
| 95 | 140.0 | 139.7 | 9 |
| 129 | 126.5 | 125.5 | 9 |
| 134 | 116.6 | 107.8 | 8 |
| 141 | 128.2 | 118.6 | 6 |
| 144 | 141.4 | 122.1 | 7 |
| 208 | 44.3 | 43.2 | 8 |
| 225 | 114.0 | 100.1 | 8 |
| 238 | 145.3 | 148.3 | 9 |
| 308 | 124.8 | 124.1 | 9 |
| 393† | 123.6 | 123.0 | 7 |
| 404 | 100.5 | 97.2 | 9 |
| 433 (occultation) | 10.1 | 17.5 | 5 |
| 433 (NEAR) | 16.3 | 17.5 | 5 |
| 526 | 44.6 | 42.0 | 9 |
| 554† | 103.4 | 84.5 | 7 |
| 578 | 74.2 | 57.5 | 7 |
| 580 | 49.5 | 47.8 | 8 |
| 757 | 36.8 | 36.6 | 8 |
| 874 | 43.9 | 54.6 | 8 |
| 1263 | 44.2 | 33.3 | 6 |
| 1366 | 29.8 | 26.8 | 7 |
†W3 measurement from end of 3-band cryo mission phase discarded as discussed in the text

4 Results and Discussion
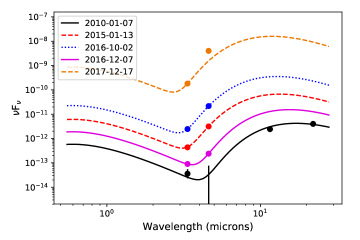
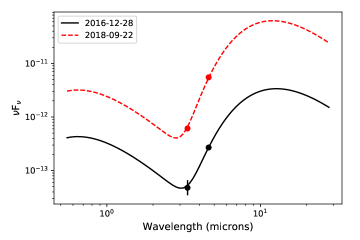
Our best fit TPM for each asteroid is shown in Figures 2 & 3, and the fitted model parameters are given in Table 3. Both objects have moderate albedos, consistent with Pallas family-like B-type objects (Alí-Lagoa et al., 2013), and the ratios of their infrared albedo to optical albedo are consistent with flat or weakly red spectral slopes between m and m, also consistent with B-type taxonomy (Mainzer et al., 2011c). This slope follows the trend across the surface of the reflectance spectrum change from blue to more neutral with increasing wavelength (Kareta et al., 2018).
Previous TPM fits of Phaethon (Hanus̆ et al., 2016, 2018) have resulted in a slightly larger diameter than we find (km vs km for our fit, a difference of ), but comparable thermal inertias ( J m-2 s-0.5 K-1 vs J m-2 s-0.5 K-1 for our fit) despite using different data sources (e.g. Spitzer and IRAS) and model assumptions. We assume that thermal inertia is constant for Phaethon, although as discussed in (Delbo’ et al., 2015) thermal inertia can vary as a function of temperature, and thus heliocentric distance. Because of the fixed WISE viewing geometry, heliocentric distance is correlated with phase angle, which plays an important role in constraining the cratering fraction of the surface in our model. Future work will investigate whether our results would be improved by using a distance-corrected thermal inertia for our model.
We note that our best fit model is unable to reproduce the highly saturated flux in W2 for the 2017-12-17 observing epoch (MJD), even after our attempts to correct for the non-linearity seen in W2 for very bright sources (see Equation 1). Our best fit model falls below the measured value. As this epoch consists of only a single observation, this result may be due to our model’s assumption that the object is spherical, or may indicate our bright source correction is insufficient.
Recent radar data from Arecibo Observatory (Taylor et al., 2019) show that the observations are consistent with an sphere of diameter of km, or a top-shaped figure with equivalent spherical diameter of km, both of which are larger than either our result or the results of Hanus̆ et al. (2018). Further, Taylor et al. (2019) state that a km sphere with a hr rotation period would have a maximum Doppler broadening of the radar return significantly smaller than the measured broadening. The radar data would thus imply that neither our TPM fit nor the Hanus̆ et al. (2018) TPM fit could be consistent with the radar observations. As both TPM fits are consistently below the radar size measurement, this may point to a surface that behaves thermophysically in a highly unusual way, or that Phaethon has a non-spherical shape with a significant equatorial bulge (see discussion in Taylor et al., 2019).
As NEOWISE only observed 2005 UD at two epochs, the TPM fit for this object was not as well constrained as the fit for Phaethon. We find for 2005 UD a diameter of km and a geometric albedo of . This is comparable to the diameter of found through a fit to the single epoch data from the fourth year of NEOWISE data using NEATM (Masiero et al.in prep), and both fits have similar uncertainties.
The posterior distribution of the rotational pole can be used to constrain its position for objects with multiple observing geometries that provide sufficient constraints. However, our observations of 2005 UD do not sufficiently constrain the pole, resulting in a significant degeneracy in the on-sky pole position. Our model finds a mean position for the pole of Phaethon at (ecliptic long/lat), but with significant extension of possible solutions to (near the best-fit solutions from (Hanus̆ et al., 2018) and (Kim et al., 2018)) as well as its antipode. Thus our position posterior does not provide an improved constraint over previous work. The median of all MCMC solutions settled on a derived H magnitude of for Phaethon and for 2005 UD, comparable to the input values.
| Target | Diameter | geometric visible albedo | crater fraction | ||
|---|---|---|---|---|---|
| km | J m-2 s-0.5 K-1 | ||||
| (3200) Phaethon | |||||
| (155140) 2005 UD | … |
‘…’ indicates value was not constrained by the model
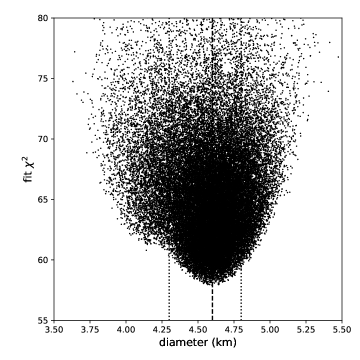
We show in Figures 4 & 5 a comparison of fitted diameter with the value of the fit for each Monte Carlo iteration of the MCMC. For Phaethon, the multiple epochs enabled a better constraint on the diameter, resulting in a tight clustering of Monte Carlo trial results. For 2005 UD, the diameter is less well-constrained due to having fewer observing epochs (and thus measurements) available, resulting in a lower overall (because of the fixed number of fitted parameters) but a broader spread in values. The large range of values at the best fitting diameter is a result of variations in the other parameters, such a thermal inertia and rotation pole.

5 Conclusions
Using a spherical, cratered MCMC thermophysical model, we have set constraints on the physical properties for (3200) Phaethon and (155140) 2005 UD based on thermal infrared measurements at multiple observing epochs. The model for Phaethon, based on one epoch of 4-band cryogenic WISE observations as well as four additional epochs of 2-band NEOWISE reactivation observations, is well constrained and offers improvements over simpler NEATM-based thermal model fits to the same data. We find that the median of all TPM fits gives an effective spherical diameter of km , a geometric albedo of , and a thermal inertia , where the uncertainties quoted are for the and percentiles of the distributions, which are non-Gaussian. These fits are consistent within of previous TPM fits of other infrared data, but are different from the maximum extent measured by radar.
The TPM for 2005 UD is less well-constrained as only two observing epochs were available, both during the 2-band reactivation survey. This median fit gives a size of km and a geometric albedo of , comparable to the quality of a NEATM-based fit. No useful constraint can be placed on the thermal inertia from these data. Two epochs of infrared observations combined with a known rotation period is therefore likely to be the bare minimum at which TPMs can produce results comparable to, or better than, simple thermal models. For observations with single observation epochs, as is found for the majority of NEAs observed by NEOWISE, thermal models like NEATM with fewer free parameters are preferred due to the significantly smaller computational requirements, while objects with many epochs covering multiple viewing geometries will derive the most benefit from detailed thermophysical modeling. In particular, thermophysical modeling will become a critical tool for understanding NEAs as future infrared surveys such as the Near-Earth Object Camera (NEOCam; Mainzer et al., 2015) begin producing multi-epoch infrared measurements of thousands of near-Earth asteroids.
Acknowledgments
The authors thank the anonymous referee for the detailed and helpful comments that resulted in a significant improvement to this work. JRM thanks Shinsuke Abe for discussions that inspired this paper. This publication makes use of data products from the Wide-field Infrared Survey Explorer, which is a joint project of the University of California, Los Angeles, and the Jet Propulsion Laboratory/California Institute of Technology, funded by the National Aeronautics and Space Administration. This publication also makes use of data products from NEOWISE, which is a project of the Jet Propulsion Laboratory/California Institute of Technology, funded by the Planetary Science Division of the National Aeronautics and Space Administration. This research has made use of data and services provided by the International Astronomical Union’s Minor Planet Center. This publication uses data obtained from the NASA Planetary Data System (PDS). This research has made use of the NASA/IPAC Infrared Science Archive, which is operated by the Jet Propulsion Laboratory, California Institute of Technology, under contract with the National Aeronautics and Space Administration.
References
- Arai et al. (2018) Arai, T., Kobayashi, M., Ishibashi, K., et al., 2018, 49th Lunar and Planetary Science Conference, LPI Contribution No. 2083, 2570.
- Arai et al. (2019) Arai, T., Kobayashi, M., Ishibashi, K., et al., 2019, 50th Lunar and Planetary Science Conference, LPI Contribution No. 2132, 3223.
- Alí-Lagoa et al. (2013) Alí-Lagoa, V., de León, J., Licandro, J., et al., 2013, A&A, 554, A71.
- Barucci et al. (2018) Barucci, M.A., Perna, D., Popescu, M., et al., 2018, MNRAS, 476, 4481.
- Binzel et al. (2015) Binzel, R., Reddy, V., & Dunn, T., 2015, Asteroids IV, (eds. Michel, DeMeo, Bottke), University of Arizona Press, 243.
- Bus & Binzel (2002) Bus, S.J. & Binzel, R.P., 2002, Icarus, 158, 106.
- Busch et al. (2011) Busch, M., Ostro, S., Benner, L., et al., Icarus, 212, 649.
- Cheng (2002) Cheng, A., 2002, Asteroids III, (eds. Bottke, Cellino, Paolicchi, Binzel), University of Arizona Press, 351.
- Cutri et al. (2012) Cutri, R., Wright, E., Conrow, T., et al., 2012, Explanatory Supplement to the WISE All-Sky Data Release Products, http://wise2.ipac.caltech.edu/docs/release/allsky/expsup/index.html
- Cutri et al. (2015) Cutri, R., Mainzer, A., Conrow, T., et al., 2015, Explanatory Supplement to the NEOWISE Data Release Products, http://wise2.ipac.caltech.edu/docs/release/neowise/expsup/
- Delbo et al. (2014) Delbo, M., Libourel, G., Wilkerson, J., et al., 2014, Nature, 508, 233.
- Delbo’ et al. (2015) Delbo’, M., Mueller, M., Emery, J., Rozitis, B., & Capria, M., 2015, Asteroids IV, (eds. Michel, DeMeo, Bottke), University of Arizona Press, 107.
- Fujiwara et al. (2006) Fujiwara, A., Kawaguchi, J., Yeomans, D. K., et al., 2006, Science, 312, 1330.
- Gustafson (1989) Gustafson, B., 1989, A&A, 225, 533.
- Hanus̆ et al. (2016) Hanus̆, J., Delbo’, M., Vokrouhlický, D., et al., 2016, A&A, 592, 34.
- Hanus̆ et al. (2018) Hanus̆, J., Vokrouhlický, D., Delbo’, M., et al., 2018, A&A, 620L, 8.
- Harris (1998) Harris, A.W., 1998, Icarus, 131, 291.
- Harris & Drube (2014) Harris, A.W., & Drube, L., 2014, ApJL, 785, L4.
- Herald et al. (2018) Herald, D., Dunham, D.W., Frappa, E., Hayamizu, T., Kerr, S., & Timerson, B., 2018, Asteroid Occultations V2.0. urn:nasa:pds:smallbodiesoccultations::2.0. NASA Planetary Data System.
- Ishiguro et al. (2014) Ishiguro, M., Kuroda, D., Hasegawa, S., et al., 2014, ApJ, 792, 74.
- Jenniskens et al. (2009) Jenniskens, P., Shaddad, M. H., Numan, D., et al., 2009, Nature, 458, 485.
- Jewitt & Hsieh (2006) Jewitt, D. & Hsieh, H., 2006, AJ, 132, 1624.
- Jewitt & Li (2010) Jewitt, D. & Li, J., 2010, AJ, 140, 1519.
- Kareta et al. (2018) Kareta, T., Reddy, V., Hergenrother, C., et al., 2018, AJ, 156, 287.
- Kim et al. (2018) Kim, M.-J., Lee, H.-J., Lee, S.-M., et al., 2018, A&A, 619, A123.
- Koren et al. (2015) Koren, S., Wright, E.L., & Mainzer, A., 2015, Icarus, 258, 82.
- Lauretta et al. (2017) Lauretta, D., Balram-Knutson, S., Beshore, E., et al., 2017, Space Science Reviews, 212, 925.
- Li & Jewitt (2013) Li, J. & Jewitt, D., 2013, AJ, 145, 154.
- Ohtsuka et al. (2006) Ohtsuka, K., Sekiguchi, T., Kinoshita, D., et al., 2006, A&A, 450L, 25.
- Mainzer et al. (2011a) Mainzer, A., Bauer, J., Grav, T., et al., 2011a, ApJ, 731, 53.
- Mainzer et al. (2011b) Mainzer, A., Grav, T., Masiero, J., et al., 2011b, ApJ, 736, 100.
- Mainzer et al. (2011c) Mainzer, A., Grav, T., Masiero, J., et al., 2011c, ApJ, 741, 90.
- Mainzer et al. (2011d) Mainzer, A., Grav, T., Bauer, J., et al., 2011d, ApJ, 743, 156.
- Mainzer et al. (2014) Mainzer, A., Bauer, J., Cutri, R., et al., 2014, ApJ, 792, 30.
- Mainzer et al. (2015) Mainzer, A., Grav, T., Bauer, J., et al., 2015, AJ, 149, 172.
- Masiero et al. (2018) Masiero, J., Redwing, E., Mainzer A., et al., 2018, AJ, 156, 60.
- Mommert et al. (2018) Mommert, M., Jedicke, R., Trilling, D.E., 2018, AJ, 155, 74.
- Neese (2010) Neese, C., Ed., Asteroid Taxonomy V6.0. EAR-A-5-DDR-TAXONOMY-V6.0. NASA Planetary Data System, 2010.
- Polishook et al. (2017) Polishook, D., Moskovitz, N., Thirouin, A., et al., Icarus, 297, 126.
- Popescu et al. (2018) Popescu, M., Perna, D., Barucci, M.A., et al., 2018, MNRAS, 477, 2786.
- Shepard et al. (2018) Shepard, M., Timerson, B., Scheeres, D., et al., 2018, Icarus, 311, 197.
- Taylor et al. (2019) Taylor, P.A., Rivera-Valentín, E.G., Benner, L.A.M., et al., 2019, P&SS, 167, 1.
- Tedesco et al. (2004) Tedesco, E.F., P.V. Noah, M. Noah, & S.D. Price. IRAS Minor Planet Survey. IRAS-A-FPA-3-RDR-IMPS-V6.0. NASA Planetary Data System, 2004.
- Veverka et al. (2000) Veverka, J., Robinson, M., Thomas, P., et al., 2000, Science, 289, 2088.
- Warner et al. (2018) Warner, B., Pravec, P., & Harris, A. P., Eds., Asteroid Lightcurve Data Base (LCDB) V2.0 urn:nasa:pds:ast-lightcurve-database::2.0. NASA Planetary Data System, 2018.
- Wright (2007) Wright, E.L., 2007, arXiv:astro-ph:0703085
- Wright et al. (2010) Wright, E.L., Eisenhardt, P., Mainzer, A.K., Ressler, M.E., Cutri, R.M., et al., 2010, AJ, 140, 1868.
- Wright (2013) Wright, E.L., 2013, American Astronomical Society, AAS Meeting 221, id.439.05
- Wright et al. (2016) Wright, E.L., Mainzer, A., Masiero, J., Grav, T., & Bauer, J., 2016, AJ, 152, 79.
- Wright et al. (2018) Wright, E.L., Mainzer, A., Masiero, J., Grav, T., Cutri, R. & Bauer, J., 2018, arXiv:1811.01454.
- Yoshikawa et al. (2015) Yoshikawa, M., Kawaguchi, J., Fujiwara, A., & Tsuchiyama, A., 2015, Asteroids IV, (eds. Michel, DeMeo, Bottke), University of Arizona Press, 397.