SDSS-IV MaNGA: Spatial Evolution of Star Formation Triggered by Galaxy Interactions
Abstract
Galaxy interaction is considered a key driver of galaxy evolution and star formation (SF) history. In this paper, we present an empirical picture of the radial extent of interaction-triggered SF along the merger sequence. The samples under study are drawn from the integral field spectroscopy (IFS) survey SDSS-IV MaNGA, including 205 star-forming galaxies in pairs/mergers and 1350 control galaxies. For each galaxy in pairs, the merger stage is identified according to its morphological signatures: incoming phase, at first pericenter passage, at apocenter, in merging phase, and in final coalescence. The effect of interactions is quantified by the global and spatially resolved SF rate relative to the SF rate of a control sample selected for each individual galaxy (SFR and sSFR(), respectively). Analysis of the radial sSFR() distributions shows that galaxy interactions have no significant impact on the sSFR() during the incoming phase. Right after the first pericenter passage, the radial sSFR() profile decreases steeply from enhanced to suppressed activity for increasing galactocentric radius. Later on, SF is enhanced on a broad spatial scale out to the maximum radius we explore ( 6.7 kpc) and the enhancement is in general centrally peaked. The extended SF enhancement is also observed for systems at their apocenters and in the coalescence phase, suggesting that interaction-triggered SF is not restricted to the central region of a galaxy. Further explorations of a wide range in parameter space of merger configurations (e.g., mass ratio) are required to constrain the whole picture of interaction-triggered SF.
1 Introduction
Galaxy interactions significantly alter the star formation history of galaxies. It is well established statistically that the global star formation rate (SFR) increases with decreasing separation between two approaching galaxies (Lambas et al., 2003; Li et al., 2008a, b; Scudder et al., 2012; Patton et al., 2013; Knapen et al., 2015; Pan et al., 2018). The enhanced SFR has been attributed to the formation of non-axisymmetric structures that torque significant amounts of gas into the central regions, initiating enhanced (circumnuclear) star formation (e.g., Barnes & Hernquist, 1991).
Yet there is mounting evidence for a component of extended star formation in interacting galaxies. The most famous example of such systems is the Antennae, which consists of two equal-mass, gas-rich spiral galaxies, NGC 4038 and 4039. In the Antennae, the majority of the star formation is outside the nuclei (Wang et al., 2004). Other examples include Arp 65 (NGC 90/NGC 93; Sengupta et al. 2015), Arp 299 (IC 694/NGC 3690; Alonso-Herrero et al. 2000), the IC 2163 and NGC 2207 system (Elmegreen et al., 1995a, 2017), NGC 5291 (Boquien et al., 2007), IC 1623, NGC 6090, NGC 2623, and the Mice system NGC 4676A/4676B (Wild et al., 2014; Cortijo-Ferrero et al., 2017a, b, c).
Several observations have attempted to measure the spatial extent of star formation (e.g., Knapen & James, 2009; Schmidt et al., 2013; Wild et al., 2014; Barrera-Ballesteros et al., 2015a; Cortijo-Ferrero et al., 2017a, b, c; Thorp et al., 2019). Schmidt et al. (2013) analyzed the spatial extent of star formation in mergers using 60 visually identified galaxy merger candidates drawn from the 3D- survey at 1.5. They found that these systems are often associated with the classic circumnuclear starburst, but their star formation can also be located in tidal tails. Barrera-Ballesteros et al. (2015a) used the information provided by the integral field spectroscopy (IFS) survey CALIFA (The Calar Alto Legacy Integral Field Area Survey; Sánchez et al. 2012) to carry out the first statistical study of the impact of the merger event on the star formation distribution in galaxies. They found moderate enhancement in the global specific star formation rate (sSFR SFR/, where is global stellar mass) in the central region of interacting galaxies; however, in the outer regions, the sSFR is similar to that in the control sample. The extended interaction-triggered star formation is also found in the late stage mergers (e.g., Boquien et al., 2009, 2010; Thorp et al., 2019). In addition to those apparently interacting galaxies and final mergers, McQuinn et al. (2012) and Sacchi et al. (2018) examined the distribution of star formation in starburst dwarf galaxies. They found that these galaxies exhibit both extended and concentrated active star formation. The widespread star formation might be triggered by external mechanisms, such as interactions/mergers between gas-rich dwarfs or cold gas accretion from the intergalactic medium (Noguchi, 1988; Lelli et al., 2014).
Further, evolution of interaction-triggered star formation distribution has attracted increasing amounts of attention. Ellison et al. (2013) constrained the evolution of the extent of interaction-triggered star formation using 11,000 normal interacting galaxies and final mergers, where the merger stage is indicated by the projected separation between two galaxies in a system. They compared the SDSS fiber (3) SFR and SFR outside of the fiber (subtracting the fiber SFR from the total SFR derived by the aperture correction). Their results showed that the pre-coalescence phase of the interaction most strongly affects central star formation, while the final merging process increases the SFR on a broader spatial scale. Using CALIFA and Potsdam Multi-Aperture Spectrometer data for a set of galaxies, Cortijo-Ferrero et al. (2017a, b, c) also showed that the spatial extent and the level of interaction-triggered star formation occur in different time-scales that are connected to the evolutionary stage of the merger.
Despite their relevance, these analyses have several shortcomings. Previous studies often contain too few galaxies or only apparently interacting galaxies. These obstacles limit our ability to establish a more general picture of which phase of the merger process triggers star formation and where the stars form. Moreover, many studies have been focused on high-luminosity major mergers (mass ratio within a factor of 4). It is not clear if the result can be generalized to all types of galaxies in pairs and mergers. Finally, many studies use the projected separation between two galaxies as a merger stage indicator, however, projected separation is not linearly correlated with merger stages as two galaxies experience several pericenter passages before the final merger, as shown in simulations (e.g., Torrey et al., 2012; Moreno et al., 2015; Bustamante et al., 2018).
In this paper, we present an empirical picture of spatially resolved interaction-triggered SFR as a function of merger sequence using the IFS data from the MaNGA survey (Mapping Nearby Galaxies at Apache Point Observatory; Bundy et al. 2015). We improve upon previous work by identifying pairs using both spectroscopic data and galaxy morphology. This allows us to extend the sample to include widely separated galaxies in pairs (incoming systems or systems at their apocenter). The unprecedented number of galaxies with MaNGA data allows for a carefully selected control sample for each individual galaxy and a quantification of interaction-triggered star formation. In addition, we design a scheme for classifying the stage of an interaction based on the morphological appearance of the system and thus, do not rely on the nuclear separation.
This paper is organized as follows. In Section 2, we introduce the scheme for merger stage classification. Data and analysis are presented in Section 3. In Section 4, we show the dependence of both the integrated and spatially-resolved star formation rate on the merger sequence. The results are discussed in Section 5 and summarized in Section 6. Throughout this paper, we assume 0.3, 0.7, 70 km s-1 Mpc-1.
2 Merger Sequence
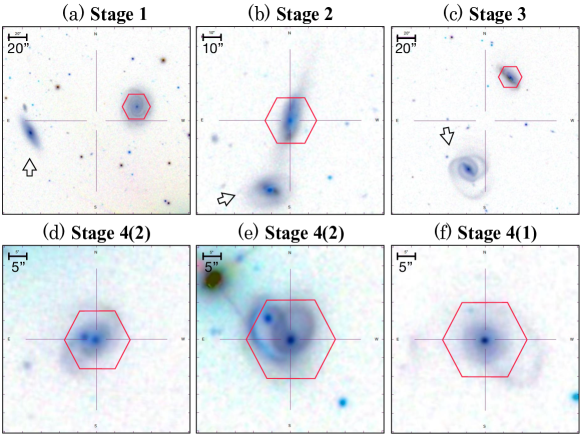
As mentioned earlier, the nuclear separation between two galaxies does not linearly correlate with merger stages, therefore, we determine the merger stages via visual inspections of the composite images observed by the 2.5-m Telescope of the Sloan Digital Sky Survey (SDSS; Gunn et al. 2006). Interactions between galaxies are classified according to the following scheme:
-
•
Stage 1 – well-separated pair which do not show any morphology distortion (i.e., incoming pairs, before the first pericenter passage),
-
•
Stage 2 – close pairs showing strong signs of interaction, such as tails and bridges (i.e., at the first pericenter passage),
-
•
Stage 3 – well-separated pairs, but showing weak morphology distortion (i.e., approaching the apocenter or just passing the apocenter),
-
•
Stage 4 – two components strongly overlapping with each other and show strong morphological distortion (i.e., final coalescence phase), or single galaxies with obvious tidal features such as tails and shells (post-mergers),
Examples of each stage are presented in Figure 1. The scheme is analogous to the Toomre Sequence (Toomre 1977; see also Veilleux et al. 2002 and Barrera-Ballesteros et al. 2015b) and the morphological evolution of simulated mergers (e.g., Figure 8 in Torrey et al. 2012 and Figure 2 in Moreno et al. 2015). Although this stage classification may not reflect the full merging process, it is useful for a demonstration purpose (more discussion, see Section 5.4.2).
3 Data and Analysis
3.1 MaNGA
MaNGA is part of the fourth generation Sloan Digital Sky Survey (SDSS-IV; Blanton et al., 2017), and aims to survey for 10,000 galaxies with a median redshift () of 0.03 by 2020. The observations are carried out with integral field units (IFUs) of different sizes, varying in diameter from 12 (19 fibers) to 32 (127 fibers). The IFU sizes and the number density of galaxies on the sky were designed jointly to allow more efficient use of IFUs (e.g., to minimize the number of IFUs that are unused due to a tile with too few galaxies), and to allow us to observe galaxies in the range to at least 1.5 effective radii (), where is the radius containing 50% of the light of the galaxy measured at -band. The fibers are fed into the dual beam BOSS spectrographs (Smee et al., 2013), covering the wavelength range from 3600Å to 10300 Å. The spectral resolutions vary from R 1400 at 4000 Å to R 2600 around 9000 Å (Drory et al., 2015; Yan et al., 2016a, b). The point spread function (PSF) is 2.5, corresponding to 1.8 kpc at the median redshift of the current MaNGA sample (0.036). For more detail on the MaNGA setup, we refer the reader to Drory et al. (2015) for the IFU fiber feed system, to Wake et al. (2017) for the sample selection, to Law et al. (2015) for the observing strategy, and to Law et al. (2016) and Westfall et al. (2019) for the MaNGA data reduction and data analysis pipelines, respectively. We select galaxies from a sample of 4691 galaxies observed by MaNGA within the first 4 years of operation, corresponding to the SDSS data release 15 (Aguado et al., 2018).
3.2 Local and SFR Measurements
The reduced MaNGA datacubes are analyzed using the Pipe3D pipeline to extract the physical parameters from each of the spaxels of each galaxy (Sánchez et al., 2016a, b, 2018). Each spaxel has an area of 0.5 0.5. Pipe3D fits the continuum with stellar population models and measures the nebular emission lines. Here we briefly describe the procedures.
The stellar continuum is modeled using a simple-stellar-population (SSP) library with 156 SSPs, comprising 39 ages and 4 metallicities (Cid Fernandes et al., 2013). Before the fitting, spatial binning is performed to reach a signal-to-noise ratio (S/N) goal of 50 across the field of view. Then the stellar population fitting was applied to the coadded spectra within each spatial bin. Finally, the stellar population model for spaxels with continuum S/N 3 is derived by re-scaling the best fitted model within each spatial bin to the continuum flux intensity in the corresponding spaxel. The stellar mass is obtained using the stellar populations derived for each spaxel, then normalized to the physical area of a spaxel to get the surface density () in M☉ kpc-2.
Then the stellar-population models are subtracted from the data cube to create an emission line cube. SFR is derived using H. Since H may be powered by various sources (e.g., star formation, evolved stars, and AGNs), we use excitation diagnostic diagrams (Baldwin et al., 1981; Kewley et al., 2001; Kauffmann et al., 2003; Cid Fernandes et al., 2013) and an H equivalent width cut of 6 Å (Sánchez et al., 2014) to pick up star-forming regions (for more discussions on the equivalent width of H and the nature of the line emitting gas, see Lacerda et al. 2018). To this end, we limit the analysis to spaxels with S/N 3 for H, H, [O III] and [N II]. Only star-forming spaxels are used for the analysis of this work. We will restricted our objects to star-forming galaxies (§3.3), whose H emission are dominated by star-forming regions (Pan et al., 2018). Therefore 93% of spaxels in our sample galaxies are star-forming spaxels. The method described in Vogt et al. (2013) is used to compute the reddening using the Balmer decrement at each spaxel. The extinction-corrected H luminosity is converted into SFR surface density ( in M☉ yr-1 kpc-2) using the calibration from Kennicutt (1998). Inclination correction is applied to and of all spaxels of a galaxy equally.
3.3 Global and SFR Measurements
The global stellar mass () is taken from the MPA/JHU catalog111https://wwwmpa.mpa-garching.mpg.de/SDSS/DR7/, where is estimated by fitting stellar population models from Bruzual & Charlot (2003) to the ugriz SDSS photometry, following the method of Kauffmann et al. (2003) (see García-Benito et al. (2019) for more discussions on the radial structure of the mass-to-light ratio). The have been found to agree with other estimates (e.g., Taylor et al., 2011; Mendel et al., 2014; Chang et al., 2015). To be consistent with previous studies of SDSS pairs (e.g., Scudder et al., 2012; Patton et al., 2013; Ellison et al., 2013), this work focuses on the galaxies in systems with ratio less than 10 (from 1:10 to 10:1). In principle, the total can also be computed for the MaNGA sample by integrating across all the spaxels in the IFU (e.g., Cano-Díaz et al., 2016; Sánchez et al., 2018). However, as more than 90% of the companions are not observed in MaNGA, we cannot estimate the ratio from the MaNGA data alone. For this reason, the from the MPA/JHU catalog is adopted. The MPA/JHU catalog assumes a Kroupa IMF (Kroupa, 2001), while Pipe3D adopts a Salpeter IMF. So in order to convert from a Kroupa IMF to a Salpeter IMF, 0.2 dex have to be added to the , which corresponds to a factor of 1.6. After applying the conversion factor, the mean difference between the MPA/JHU and integrated MaNGA is 0.015 dex.
To fairly compare the results of global and local SFR, the star formation per spaxel from MaNGA are coadded to derive the global SFR of the galaxies (Sánchez et al., 2018). The MPA/JHU catalog also provides the global SFR measurements. The mean difference between the MPA/JHU SFR (after IMF conversion) and integrated Pipe3D SFR is somewhat larger, 0.17 dex, consistent with comparisons in other papers (e.g., Ellison et al., 2018; Spindler et al., 2018). The significant difference in the two SFRs is most likely due to the use of the aperture correction to the 3 fibers in SDSS missing star formation which is present in the MaNGA IFUs. To avoid any uncertainties associated with aperture correction (e.g., Richards et al., 2016; Spindler et al., 2018) and to be consistent with the value of local SFR, we use the integrated MaNGA SFR in this work.
Galaxies that are quenching or quenched are removed from this work. A criterion of log(sSFR/yr-1) -11 is applied to select star-forming galaxies, where the specific SFR (sSFR) is defined as SFR/. Varying the criteria between log(sSFR/yr-1) -11.0 and -10.5 will not change our main conclusions, but the number of galaxies in pairs would be reduced by 20%. We emphasize that we do not require our sample galaxies to have star-forming companions. We include star-forming galaxies interacting with an early-type galaxy, for instance. The dependence of interaction-triggered star formation on mass ratio and properties of companion will be discussed in a separate paper.
Finally, it is worth noting that the star formation rate in this work is calculated by H luminosity, tracing the ongoing star formation ( 100 Myr), while the extension and enhancement of star formation can occur in different time-scales. We refer the reader to Pan et al. (2015) and Davies et al. (2015) for the comparisons of interaction-triggered SFRs using observational tracers which probe different star formation time-scales and Cortijo-Ferrero et al. (2017a, b, c) for the constraints onto interaction-triggered star formation history using population synthesis.
3.4 Identifying Galaxies in Pairs and Mergers in MaNGA
3.4.1 Projected Separation and Velocity Difference
The galaxies in pairs or mergers (p/m) are defined as galaxies with a spectroscopic companion222The field of view of MaNGA observations can only cover one galaxy in an interacting system except for some very close pairs of galaxies and galaxies in the coalescence phase. Therefore we refer to the samples as galaxies in pairs or mergers.. The parent sample is made up of 641,409 nearby galaxies from the NSA, primarily based on the SDSS DR7 main galaxy sample (Abazajian et al., 2009) , but incorporating data from additional sources. NSA is also the parent catalog for target selection for MaNGA (Wake et al., 2017).
Galaxies in pairs must have a companion at a projected separation 50 kpc h-1 (or 71.4 kpc) and a line-of-sight velocity difference 500 km s-1 (e.g., Patton et al., 2002; Lin et al., 2004). This results in a sample of 34,478 galaxies in pairs or multiples. If several companions are found for a given galaxy, the companion with the smallest separation is selected. Then we cross match the NSA galaxies in pairs and the 4,691 MaNGA galaxies, yielding a sample of 682 galaxies in pairs. We note that in more than 90% of the cases, only one of the two components of a galaxy pair is observed by MaNGA. Applying the mass ratio and sSFR selections (Section 3.3), the number of galaxies in pairs become 109, including 38 in Stage 1, 10 in Stage 2, 58 in Stage 3, and 3 in Stage 4.
3.4.2 Morphology
One caveat to the identification of galaxies in p/m by the projected separation and velocity difference is that if the two components are too close (i.e., Stage 2 and Stage 4) to be de-blended by SDSS or do not have two separate spectroscopic redshifts, they will be missed in the spectroscopic determination. Another caveat is that post-mergers (i.e., single galaxies) are missed by the selection criteria.
We visually inspect the SDSS gri composite images of all MaNGA galaxies and recover these closest interaction systems. The number of Stage 2 and Stage 4 galaxies then increases to 24 and 85, respectively. It should be noted that the galaxies in Stage 2 may span a narrower mass ratio range compared to other stages because in principle similar- interaction can generate stronger signs of tidal features. However, it is impossible to obtain the mass ratio of galaxies at Stage 4 without modeling the properties of progenitors. Besides, one has to keep in mind that a larger diversity of morphologies is observed for galaxies at Stage 4 compared to other stages, such as double nuclei with tidal features (Figure 1(d) and (e)) and single nuclei with shell structures (1(f)). Of the 85 galaxies in Stage 4, 13 and 72 show double nuclei and single nucleus, respectively.
3.4.3 Summary of the Sample of Galaxies in P/M
The sample for this paper comprises 205 galaxies in p/m. Of these, 53% are selected based on the spectroscopic data (Section 3.4.1) and 47% based on their morphology (Section 3.4.2). For the galaxies with spectroscopic companions, 57% are primary galaxies (the higher one in a pair), while 43% are secondary galaxies. The fraction (and number) of galaxies in Stage 1 – Stage 4 are 19%(38), 12%(24), 28%(58), and 41% (85), respectively. Of the galaxies in Stage 4, 15%(13) of them have visually double nuclei, while 85%(72) have one. Hereafter, we refer to Stage 1 – 4 as S1 – S4, respectively. For S4, we use S4(2) and S4(1) to represent the sub-categories for double nuclei and single nucleus, respectively.
The small numbers of S2 and S4(2) in our sample are presumably due to the short time-scale during which the galaxies exhibit the features to be identified as S2 and S4(2). The two nuclei are separated by a few to several kpc in these galaxies. According to simulations, the duration of such phases are several to tens of times shorter than other stages (e.g., Torrey et al., 2012; Ji et al., 2014).
3.5 Control Sample of Isolated Galaxies
We define a control sample to quantify the effect of interactions. To construct a reliable control sample, in addition to the spectroscopic determination, we also use the “P-merger” parameter from Galaxy Zoo to remove potential interacting galaxies through their morphology (Darg et al., 2010a, b). P-merger quantifies the probability that an object is a merger. The value ranges from 0, an object looks nothing like a merger, to 1, an object looks unmistakably so. The control galaxies should have no spectroscopic companion, and P-merger 0, and log(sSFR/yr-1) 11. A total of 1348 MaNGA star-forming galaxies are selected as control galaxies. This pool of control galaxies will be used to select the control galaxies for a given galaxy (§3.6).
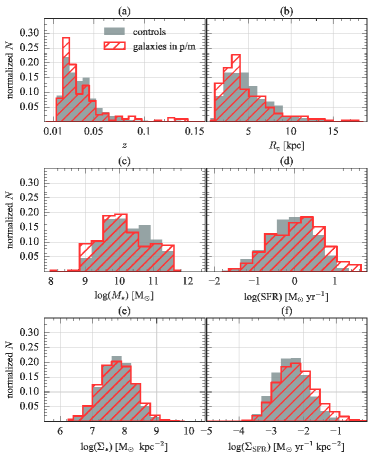
The and distributions (from NSA) of galaxies in p/m and controls are shown in Figure 2(a) and (b), along with , SFR, , and in panel (c) – (f), respectively. The galaxies in p/m and controls are represented by the hatched and solid histograms, respectively. The distributions show good overall similarity between the galaxies in p/m and control galaxies.
3.6 Quantification of Interaction-triggered Star Formation
In order to fairly compare the properties of the galaxies in p/m and controls, we compute “offset” quantities. Our approach follows closely that of Ellison et al. (2018) for the analysis of the spatially-resolved main sequence. The offset values are computed for both control galaxies and galaxies in p/m. The distribution of the offset values of controls is useful to give an idea of the intrinsic scatter of the offset values.
3.6.1 Global SFR Offset: SFR
Each galaxy is matched in , , and with a minimum of three control galaxies from the pool of controls (§3.5). We allow shared control galaxies for different galaxies. The initial tolerance of , , and are 0.005, 0.1 dex and 20%, respectively. The criteria are allowed to grow by 0.005, 0.1 dex, and 5%, respectively, until the minimum required number of control galaxies is reached. In practice, 90% of galaxies are successfully matched to at least three controls without the need to grow the tolerances. Around 9% of galaxies require only one growth step in order to reach the requirement of three matched controls. The remaining galaxies can find sufficient controls in the third or fourth growth steps. In general, the number of matched controls exceeds the minimum requirement of three, with an average of 10 matches per galaxy. The “offset” of global SFR in logarithm scale (SFR) is defined as,
| (1) |
where is the SFR of the galaxy in question and median(SFRcontrols) is the median SFR of its control galaxies in logarithm scale. The SFR is calculated for both the galaxies in p/m and for all controls. We should emphasize that as this is taken in the logarithm form, it really is a ratio of a value of the galaxy in question against the median value of its controls. A positive offset represents an enhancement of global SFR with respect to the controls, and vice versa.
3.6.2 Local sSFR Offset: Radial sSFR() Distribution
For each galaxy, we calculate the “offset” of the radial sSFR distribution with respect to its controls selected in Section 3.6.1 (i.e., according to the global galaxy properties) using the derived and . For each galaxy, we first calculate its own de-projected radial sSFR() distribution with a radial bin of 0.15. Then the radial sSFR() distribution of the galaxy in question is computed by subtracting the median radial sSFR() distribution of its controls from its own sSFR() distribution. Specifically, at each radial bin :
| (2) |
where represents the logarithm of local sSFR of the galaxy in question and is the median local sSFR of control galaxies in logarithm form. We express the galactocentric distance in units of to allow to produce median profiles from the control galaxies. The radial distribution are computed out to 1.5 because the radial coverage of MaNGA fiber bundles is 1.5 . As for the global SFR, the radial sSFR() distribution is calculated for both galaxies in p/m and controls.
4 Results
4.1 Global SFR Properties
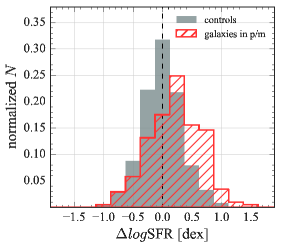
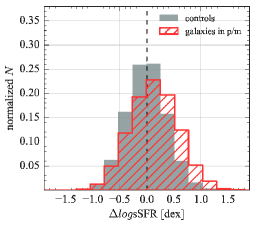
To compare with the literature, we first show the results of global star formation properties in our sample. Figure 3 compares the SFR distribution of the whole sample of galaxies in p/m (hatched histogram) and the galaxies in the control pool (solid histogram). The distribution of the control sample peaks at zero (with a median value of -0.007 dex), confirming that the approach we have taken to calculate the SFR is valid. The width of the distribution of the controls indicates the intrinsic spread of SFR; the standard deviation of the SFR values is 0.34 dex.
The distribution of the controls is symmetric, whereas the distribution of galaxies in p/m is skewed towards larger values of SFR. For the whole data set of galaxies in p/m we obtain a SFR standard deviation of 0.44 dex. While the distributions indicate higher SFR values for galaxies in p/m than for those in the control pool, statistically, the SFR only increases by a limited factor. The median SFR for galaxies in p/m is 0.21 0.03 dex (around 1.6), where the error bar is the standard error of the mean. Various observational studies also find a rather limited increase in the SFR during galaxy interactions (e.g., Lin et al., 2007; Knapen & James, 2009; Scudder et al., 2012; Ellison et al., 2013; Knapen et al., 2015; Pan et al., 2018). The factor of 1.6 increment in the SFR is the average value for galaxies at any instant of the merging process, so it likely indicates that peak SFR values are higher than this. In the next section, we examine the SFR values along the merger sequence.
4.1.1 SFR versus Merger Stage
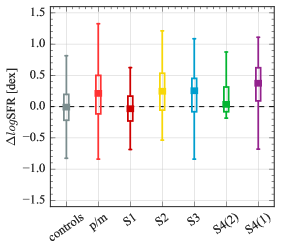
The SFR values as a function of merger stage is illustrated in Figure 3, where the whole sample of control galaxies in the p/m sample is plotted as well for reference. The boxplots represent the distribution of the SFR values for different categories of galaxies. In each boxplot, the median is indicated by the solid squares in the middle. The ends of the box are the upper and lower quartiles (the interquartile range, IQR), 50% of the sample is located inside the box. The two whiskers (vertical lines) outside the box extend to 1.5 IQR. Boxplots from left to right represent the distribution for the galaxies in the control pool, all the galaxies in p/m, and S1 – 4(2), respectively.
Although the individual galaxies span a wide range of SFR, the median SFRs for each of the different stages are still packed in a relatively narrow range of values. The median SFR are -0.04 0.06 dex for S1 ( 0.91), 0.24 0.10 dex for S2 ( 1.73), 0.25 0.07 dex for S3 ( 1.77), 0.04 0.09 dex for S4(2) ( 1.09), and 0.37 0.05 dex for S4(1) ( 2.34). During the incoming phase, the reported SFRs are statistically indistinguishable from those of the control sample. Then the median SFR increases since the first passage (S2 – S3). The median SFR in the merging phase (S4(2)) is not significantly enhanced, which is somewhat surprising. It could be the result of supernova feedback triggered during the enhanced SFR of the previous phases that quench the star formation activity during this period. But, due to low number statistics and the large spread in the values, nothing conclusive can be said in this respect for this specific stage. Finally, the median SFR peaks at the coalescence phase, although it is only by a factor of 2.3. Our results are comparable to those reported by Knapen et al. (2015), who also quantify the global SFR variation as a function of morphologically defined interaction class using the data from the S4G survey (see their Figure 4).
4.1.2 SFR versus the Projected Separation
The projected separation () between two galaxies in a pair is the most accessible and widely used indicator of the stage of an interaction. This indicator has been used to understand the role of galaxy interaction in triggering star formation (Lambas et al., 2003; Li et al., 2008a, b; Scudder et al., 2012; Ellison et al., 2013; Patel et al., 2013; Davies et al., 2015; Pan et al., 2018) and AGNs (Alonso et al., 2007; Li et al., 2008b; Koss et al., 2012; Ellison et al., 2013; Gordon et al., 2017) as well as in altering the cold gas properties (Combes et al., 1994; Gao & Solomon, 1999; Scudder et al., 2015; Ellison et al., 2018; Pan et al., 2018), metallicity (Michel-Dansac et al., 2008; Scudder et al., 2012; Guo et al., 2016), and morphology (Casteels et al., 2013) of galaxies. In this section, we revisit the relation between SFR and by considering the merger stages.
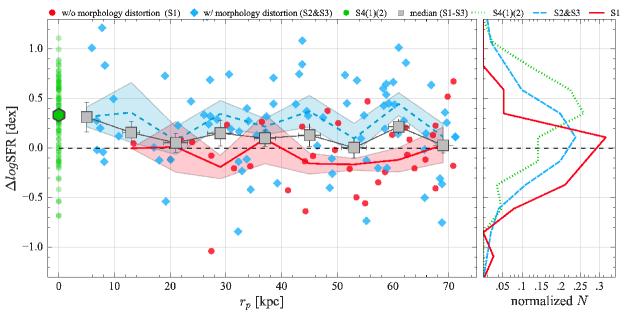
The calculated SFR values are plotted against in the left panel of Figure 4. In this plot, galaxies in pairs are classified as those with (blue diamonds) and without (red circle) morphological distortions; the former category consists of galaxies at S2 and S3, while the latter are S1 objects. Galaxies in the coalescence phase (S4) are plotted at 0 kpc. The blue dashed and red solid lines represent the median SFR of galaxies with and without morphological distortion per bin, respectively. The large squares and hexagon indicate the median SFR per of all of the galaxies in pairs (S1 – S3) and in the coalescence phase (S4), respectively.
The most important result from Figure 4 is that the galaxies with morphological distortion (S2 – S4) tend to be found in the positive regime. This can evidently be seen in the histogram of SFR in the right panel (blue dashed and green dotted histograms). Moreover, both galaxies in pairs with (S2 and S3) and without (S1) morphological distortion clearly span a wide range in . As a result, the median SFR of galaxies with morphological distortion (blue line) lies above the line of galaxies without morphological distortion (blue line) at almost all . Combining these two distinct trends yields a relation very similar (in terms of both profile and values of SFR) to the well-known SFR versus relation seen in larger samples (e.g., Scudder et al., 2012; Ellison et al., 2013), with an increase in SFR at the smallest separations. The figure also suggests that the nuclear separation between two galaxies in a pair should be used with caution as it does not vary linearly along the merger sequence. The statistical results based on may depend on the number of galaxies in each stages.
4.2 Spatially resolved sSFR()
We first compare the local sSFR of galaxies in p/m and the controls by means of their spaxel-by-spaxel distributions. This is shown in Figure 5, where the distribution of the local sSFR of the galaxies in p/m is shown by hatched histogram and that of the galaxies in the control pool by solid histogram. Again, the distribution of controls indicates the intrinsic scatter of sSFR. As is clearly seen in the plot, galaxies in p/m have higher sSFR than the controls. The standard deviation of the sSFR values is 0.37 dex for the galaxies in the control pool and 0.44 dex for the galaxies in p/m. The median sSFR of galaxies in p/m and controls are 0.14 dex and 0.01 dex, respectively.
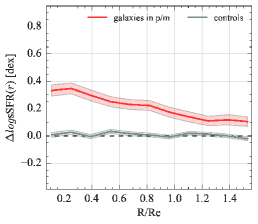
Turning now to the radial distribution of sSFR(), Figure 5 shows the median radial distribution of the sSFR() for the galaxies in p/m (red) and galaxies in the control pool (gray). The shaded regions represent the error on the mean. The horizontal dashed line indicates zero enhancement. As might reasonably be expected, galaxies from the control pool exhibit a flat sSFR() profile around zero, confirming once more that the method we have taken to compute the sSFR() is valid. In contrast, the radial distribution for galaxies in p/m reaches sSFR() of 0.3 dex in the centers, then decreases radially to a value of 0.1 dex at the edge of the radius we explore. The profile suggests that, when considering all the merger populations as a whole, local sSFR is enhanced not only in the central region but also in the disk during galaxy interactions, in agreement with recent simulations (e.g., Teyssier et al., 2010; Perez et al., 2011; Hopkins et al., 2013; Powell et al., 2013; Renaud et al., 2015, 2016; Sillero et al., 2017) and observations (e.g., Barrera-Ballesteros et al., 2015a; Cortijo-Ferrero et al., 2017c).
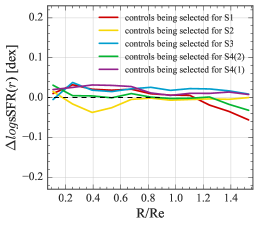
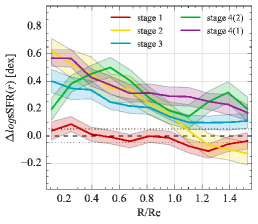
To gain more insight on when the enhanced local sSFR is actually taking place during galaxy interactions, we construct the radial sSFR() distributions for different merger stages. We first estimate the systematic variation of sSFR() for different merger stages in Figure 5 (note that the range of -axis of this figure is narrower than other panels) by computing the median radial sSFR() distributions of the control galaxies that have been used for individual stages. The systematic variations are in the range of 0.05 dex. Figure 5 presents the distributions of radial sSFR() for different merger stages. Although the systematic variations in Figure 5 have been subtracted from this plot, two dotted lines at 0.05 dex are plotted to indicate the impact of intrinsic signatures in the control sample. At S1, the radial sSFR() distribution has a relatively flat profile within 0.1 dex, suggesting that galaxy interactions have almost no impact on star formation during the incoming phase. At the first pericenter passage (S2), the sSFR() distribution presents a relatively steep profile that is not seen in other stages. The sSFR() decreases from 0.6 dex at the innermost region to -0.15 dex at 1.5 . Later on, extended star formation enhancements are observed at all stages after the first pericenter passage (S3, S4(2), and S4(1)), but the magnitudes and the profiles are somewhat different among these stages. At S3 and S4(1), overall, sSFR() values increase radially inward. In spite of the similar trend of variation, the median sSFR() profile of galaxies at S4(1) lies above that of galaxies at S3 at all radii by 0.1 – 0.2 dex. Moving to S4(2) galaxies, we see that the profile shows no obvious radial dependence, fluctuating between 0.2 and 0.6 dex. This fluctuating behavior is presumably related to their chaotic morphologies (Figure 1(d)(e)).
We have checked whether the radial sSFR() distributions depend on redshift; for instance, at higher , because of the resolution, profiles may tend to appear flatter than at lower . This is done by reproducing Figure 5 but now using galaxies with 0.03 (mean of our sample) and 0.03, separately. All of the observed features in Figure 5 are clearly present in the sub-sample plots. Therefore, we stress that redshift (resolution) has negligible effect on our conclusions.
In summary, we find that (1) the highest, interaction-triggered star formation, in both the global and the local sense, occurs in the S4(1), where the nuclei of two galaxies have merged, (2) while the values of global SFR for each of the different stages are not dramatically different (Figure 3), diverse variations in radial sSFR() profile are observed along the merger sequence, and (3) interaction-triggered star formation is not restricted to the central region of a galaxy.
5 Discussion
5.1 Evolutionary Scheme
Our results demonstrate that galaxy interactions trigger centrally peaked star formation since the first pericenter passage (S2) and extended star formation throughout the interaction phase until the final post-coelescence (S3–S4). Our results are in global agreement with recent numerical simulations (Perez et al., 2011; Sillero et al., 2017) and results based on single-fiber SDSS measurements (Ellison et al., 2013). Here we discuss the possible origin of the varying radial sSFR() profiles among the merger stages.
Galaxy interactions can cause gas that has previously settled in the outskirts to be funneled towards the central region, resulting in an enhancement of star formation in this region (Barnes & Hernquist, 1991). Our results imply that such gas inflows become efficient at the first pericenter passage (S2), which is consistent with many simulations. The boost of gas inflow rate can trigger the steep radial distribution of sSFR() and significant enhancement of star formation in the central regions (e.g., Moreno et al., 2015). For equal-mass gas-rich disk-disk interactions, the average gas inflow rate is 2 M☉ yr-1 over 200 Myr (Torrey et al., 2012), and the mass that is expected to be deposited into the inner region between the first passage to the coalescence phase (i.e., S2 and S3) is therefore 4 108 M☉, accounting for 20% of the gas for a Milky Way-like galaxy (note that the adopted time duration of gas inflow is shorter than the time between the first pericenter passage and the coalescence phase because the inflow rate decreases rapidly after the first apocenter passage). Therefore, although galaxy interaction drives gas inwards, the galactic disk still contains a significant amount of gas.
After the first passage, star formation is enhanced within both the inner regions and at larger galactocentric radii. Several possible mechanisms may contribute to the extended star formation. First of all, part of the extended star formation activity could be fed by gas accretion from the companion after the pericenter, but the level of enhancement depends on several factors such as geometry and gas fraction (Perez et al., 2011; Sillero et al., 2017). Secondly, recent simulations show that the outer regions of interacting systems receives a significant fraction of gas coming from the inner regions of the disks as the arms get opened and distorted by tides (Perez et al., 2011). This gas subsequently feeds the star formation in the outer regions.
Furthermore, the extended star formation activity could be attributed to the change of the properties of the existing gas. Galaxy interactions produce convergent flows and shocks throughout the galaxy (Teyssier et al., 2010; Powell et al., 2013). These flows and shocks can alter gas in two manners. One is that the flows and shocks induce phase transitions (e.g., HI H2; Moreno et al. 2019) throughout the galaxy. Indeed, a number of observations have found such an increase in the molecular gas fraction in galaxies in p/m compared to the isolated galaxies (Violino et al. 2018; Pan et al. 2018; Sargent et al. in prep.). The other possibility is that the gas turbulence increases through the flows and shocks, so that gas clouds become more massive and denser than in isolated galaxies, and the free-fall time becomes shorter. In this case, mergers can convert gas into stars faster than isolated galaxies with similar gas surface densities, i.e. higher star formation efficiency. This scenario is consistent with the observational facts that interacting galaxies show higher molecular cloud mass, higher velocity dispersion of gas, and higher star formation efficiency compared to galaxies in isolation (e.g., Elmegreen et al., 1995a, b; Wilson et al., 2003; Elmegreen et al., 2000; Struck et al., 2005; Herrera et al., 2011; Hughes et al., 2013; Michiyama et al., 2016). Finally, the first pericenter passage can trigger the formation of spiral arms and large-scale filament structures, where gas can be efficiently compressed to form stars in the disk regions (e.g., Elmegreen et al., 2006; Pettitt et al., 2017; Espada et al., 2018).
In any case, it is worth pointing out that while most existing simulations and observations of galaxy interactions, in particular those studying the spatial extent of interaction-triggered star formation activity, focus on major mergers, our analysis, which consists of a wide range of mass ratios, also suggests the existence of extended interaction-triggered star formation. Therefore, extended star formation is probably not restricted to equal-mass systems like the Antennae.
While a proposed star formation quenching mechanism is galaxy mergers, the permanent star formation quenching that might be expected to result from mergers has not occurred throughout the four merger phases that we explore (see also Thorp et al., 2019). Sparre, & Springel (2017) investigated how morphological transformations and quenching occur in galaxy mergers using cosmological simulations. They found that star formation of post-mergers (merger remnants) is not necessarily quenched unless the AGN feedback is sufficiently strong (see also Sánchez et al. 2018). Alternatively, both major and minor post-mergers can potentially have star-forming disks if there is enough gas available at the coalescence phase (Kauffmann et al., 1993; Robertson et al., 2006). This is supported by observations of the cold gas (disks) in post-mergers (Ueda et al., 2014; Ellison et al., 2015).
5.2 Comparison with Previous Studies
Barrera-Ballesteros et al. (2015a) carried out the first statistical study of the impact of the merger event on the spatial star formation distribution using 103 galaxies in p/m and 80 controls from the CALIFA IFS survey. They found a moderate enhancement in the sSFR ( 2 – 3) in the central region of galaxies in p/m (see also Scudder et al. 2012 and Ellison et al. 2013 for moderate central SFR triggering). We find a similar value for our sample (Figure 5). In Barrera-Ballesteros et al. (2015a), the sSFR is similar to or moderately suppressed in comparison to the control sample in the outer regions, while we obtain a higher level of 0.1 – 0.2 dex (Figure 5). This discrepancy could originate from a different sample selection, e.g., Barrera-Ballesteros et al. (2015a) adopted a much wider separation criterion than this work (160 kpc versus 71 kpc), and therefore their sample potentially contains more galaxies with lower level of triggered star formation. In spite of the different sample selection criteria, both studies have led to a fairly similar understanding that galaxy interactions have larger impact on central star formation than on disk star formation. This concept was indirectly probed through single-fiber observations by Ellison et al. (2013), and has now been directly established by the IFS surveys.
Our results show that interaction-triggered star formation is more concentrated in the inner part of the systems at the first pericenter passage (S2); but in later stages, the interaction-triggered star formation is more extended (S3 – S4). The scenario is in broad agreement with the results obtained previously by Ellison et al. (2013). However, by analyzing IFS data of three luminous infrared galaxy (LIRG; 1011 ) mergers from the CALIFA survey, an opposite trend was reported by Cortijo-Ferrero et al. (2017c). Nonetheless, it is interesting to note that the non-LIRG system (the Mice), which corresponds to our S2, in Cortijo-Ferrero et al. (2017c) shows suppressed star formation in the disk regions, just like our galaxies at S2. The apparent discrepancy between normal galaxies in p/m (sample in Ellison et al. 2013, the Mice system in Cortijo-Ferrero et al. 2017c, and galaxies in this work) and high-luminosity mergers (the three LIRG mergers in Cortijo-Ferrero et al., 2017c) suggests that in addition to merger stage, other physical mechanisms, such as the gas fraction (gas mass with respect to stellar mass), gas properties (e.g., dense gas fraction; dense gas mass with respect to total gas mass), orbital characteristics, and properties of progenitors (e.g., gas rich or not), also play a role in triggering star formation (e.g., Di Matteo et al., 2007, 2008; Cox et al., 2008; Bustamante et al., 2018).
5.3 Effect of Fiber Coverage on Interaction-triggered Global (s)SFR
MaNGA data allow us to evaluate the potential effect of aperture size on global interaction-triggered star formation. What is clear from our analysis is that the magnitude of interaction-triggered star formation varies with radius, with the largest enhancement in the central regions. As such, the physical coverage of a fixed angular fiber, such as used in the traditional SDSS observations, and how the aperture correction of SFR is being made may affect the derived interaction-triggered star formation rate (see also Ellison et al., 2013; Patton et al., 2013; Barrera-Ballesteros et al., 2015a).
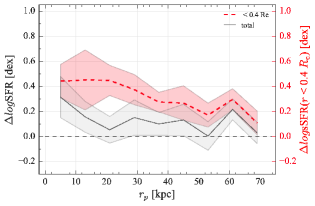
For each galaxy, we generate mock single fiber measurements by summing up spaxel-wise SFR and within 0.4, and then calculate the sSFR( 0.4) in comparison to its control galaxies selected in Section 3.6.1. The median sSFR( 0.4) as a function of is shown in Figure 6 with a dashed line, while the result based on total SFR (Figure 4) is overlaid in the figure with a black solid line. It should be emphasized that the -axis represents the excess in SFR for the global measurements (solid line) and the excess in sSFR for the central measurements (dashed line) due to the different methods of analysis. Despite the difference, the values of the global SFR in Figure 4 is approximately equivalent to their excess in the global sSFR as the stellar mass has been matched between galaxies in p/m and controls (§3.6.1).
As expected, Figure 6 suggests that the central star formation is more elevated than the global star formation because centrally-concentrated star formation enhancement is common (Figure 5). Moreover, sSFR( 0.4) shows a significant excess in the galaxies in p/m relative to their controls out to 70 kpc, while the global SFR is significantly enhanced only when the pairs are at 20 kpc. Thus, caution is needed when quoting the degree of interaction-triggered star formation obtained from single-fiber observations as they tend to probe the regions with the strongest enhancements (see also Lambas et al., 2003; Patton et al., 2013; Ellison et al., 2013; Barrera-Ballesteros et al., 2015a).
5.4 Caveats
5.4.1 Stage Classification
Here we discuss any possible limitations and caveats to our classification scheme. First of all, one could imagine a possible bias against higher for galaxies without morphology distortion/asymmetries due to a sensitivity limit. While the galaxies are far from their companions, the presence of morphology distortion/asymmetries is used to distinguish S1 and S3 (all of them are identified as galaxies in p/m via spectroscopic data), however, the morphology distortions/asymmetries in the outskirts could be faint compared to the detection limits. In other words, the visibility of these features depends on the sensitivity. In order to evaluate the potential bias of the visual inspection, we check the distributions of galaxies in S1 and S3. The median of galaxies in S1 and S3 are almost identical, 0.0281 and 0.0286 respectively. A Kolmogorov-Smirnov test confirms that with a -value of 0.24, the distributions for S1 and S3 are statistically the same. Accordingly, we find no evidence for a strong bias due to sensitivity for S1 and S3. Moreover, the evidences of interaction in the S4 (e.g., shell structures at the outskirts) would be difficult to detect as the redshift increases. Although we find no difference in the median of S4 (0.0296) and that of other stages, we should keep in mind that the depth of images play a critical role in identifying galaxies in p/m (e.g., Ellison et al., 2019).
Secondly, it is possible that some systems would not proceed through the assumed merger scenario, e.g., two galaxies encounter but separate at a later time and do not ever return (i.e., flybys) or two galaxies directly merge during the first encounter (as seen in some simulations). Observationally, it is challenging to account for the effects of flybys and direct mergers directly due to the unknown orbits of two approaching galaxies.
It is interesting to note that galaxy flybys are not rare, the galaxy-pair counts in a large-scale survey (e.g., SDSS) at 3 are contaminated by flybys at least at a 20 – 30% level, as estimated by the simulations of Sinha & Holley-Bockelmann (2012). Galaxy flybys are capable of causing perturbations (Weinzirl et al., 2009; Pawlowski et al., 2011; Kim et al., 2014; Lang et al., 2014; Zana et al., 2018); therefore, effects on star formation are expected. Flyby interactions can be present in S1 – S3 (pre-flybys, ongoing flybys, and post-flybys, respectively). However, even though the flybys can exert effects on galaxy evolution, perhaps not all of them are able to generate the necessary (observable) features to be identified as in S2 and S3 according to our classification scheme.
Direct mergers are observed in cosmological simulations, and even occur in major mergers (Bustamante et al., 2018). Therefore, some S2 systems, but perhaps not many, may in fact be in their final coalescence phase and would not experience extra apocentric passage. On the other hand, some systems at S4 may have experienced a direct merger without extra pericenter passages.
Finally, even though the galactic disks of our controls are rather symmetric, we cannot fully rule out the possibility that they experienced past external perturbations such as flybys or minor mergers, which may or may not have altered their star formation activity.
5.4.2 Merger Configurations
Our observational data include galaxies that could have any merger configuration. There are many factors regarding merger configurations that can affect the magnitude of interaction-triggered star formation, such as the properties of the companion (Hwang et al., 2010; Xu et al., 2012; Cao et al., 2016; Silva et al., 2018), mass ratio (Cox et al., 2008; Bustamante et al., 2018), cold gas reservoir (Scudder et al., 2015; Violino et al., 2018; Pan et al., 2018), and the encounter geometry of the two interacting galaxies (Di Matteo et al., 2007, 2008). Moreover, it has been shown in many observations that while the primary and secondary galaxies in a major merger exhibit symmetry in their response to the tidal interaction, the star formation activity in the less massive member in the minor merger suffers a more dramatic impact than that of its companion during the interactions (e.g., Woods, & Geller, 2007; Silva et al., 2018). The current sample size of MaNGA is not sufficiently large to enable further statistical analysis of the dependence of triggering star formation on merger configurations. The full MaNGA sample – in which the number of galaxies in p/m is expected to be at least doubled (similar for the control sample) – will provide further constraints on the evolutionary scheme of interaction-triggered star formation and their effects on galaxy evolution.
5.4.3 Internal Structures of Disk Galaxies
Our star-forming sample shows a significant diversity in their internal structures, such as the existence of a bar and a varing number of spiral arms and pitch angles. This may introduce systematic uncertainties in the radial sSFR() distribution if the local star formation of galaxies is intrinsically correlated with the internal structures (e.g., González Delgado et al., 2016; Hart et al., 2017a, b). For instance, we may have compared a galaxy with actively star-forming spiral arms with a galaxy with a relatively smooth, moderately star-forming disk. The comparison might be reinforced by matching the control sample in detailed morphology (e.g., T-type morphology; Fischer et al., 2019), but this would require a significant increase in the pool of controls. Besides, the formation of galactic internal structures may be closely tied with galaxy interactions (Elmegreen et al., 2006; Lang et al., 2014; Łokas et al., 2016; Pettitt et al., 2017; Espada et al., 2018).
6 Summary
In this paper, we present an empirical picture of the evolution of the star formation distribution in interacting galaxies and mergers. We analyze the global and local star formation of 205 star-forming (log(sSFR/yr-1) -11) galaxies in pairs/mergers observed by SDSS-IV MaNGA. We consider an interacting galaxy to be one which has a spectroscopic companion or has experienced a significant tidal force, showing morphology distortion or ongoing interaction with a companion galaxy (§3.4).
Merger stage is identified through visual examination of each interacting galaxy selected (§2 and Figure 1), Stage 1 (S1): before the first pericenter passage, without morphology distortion, Stage 2 (S2): at the first pericenter passage, with a close companion and tidal bridges, Stage 3 (S3): after the the first pericenter passage, around the apocenter, and with morphological distortion, and Stage 4 (S4): in the coalescence phase. For S4. We further classify S4 into S4(2) and S4(1) according to the number of visible cores.
To quantify the interaction-triggered star formation activity, we identify a pool of star-forming control galaxies ( 1350) from MaNGA (§3.5). For each galaxy, we select control galaxies from the pool satisfying the matching conditions in global galaxy properties. Then the global SFR and local sSFR with respect to the controls: SFR and radial sSFR() distribution, are computed (§3.6). The main results are summarized as follows.
-
•
Using the computed values of SFR, we confirm previous results that, statistically, global SFR is enhanced by a limited level during galaxy interactions. Moreover, SFR increases with decreasing nuclear separation () between two galaxies in a pair. However, we find that the trend could be sensitive to the fraction of galaxies in different merger stages because does not vary linearly along the merging sequence (§4.1 and Figures 3, 4).
-
•
While the values of global SFR for each of the different stages are not significantly different, there is considerable variation in the radial sSFR() profiles across the merger stages. Statistically, galaxy interactions have no impact on local star formation during the incoming phase (S1). Right after the first pericenter passage (S2), galaxy interactions produce enhanced star formation in the center, and suppressed star formation in the outskirts, resulting in a steep profile in the radial sSFR() distribution. After the first pericenter passage (S3), star formation is enhanced all the way out to the galactocentric radius we explore (1.5 6.7 kpc). The radial sSFR() profile at S4(2) shows no radial dependence due to their chaotic morphologies. Finally, the highest, interaction-triggered star formation, in both the global and the local sense, occurs in the S4(1), where the nuclei of two galaxies have merged (§4.2 and Figure 5).
-
•
Our results suggest that interaction-triggered star formation is not restricted to the central region of a galaxy (although the enhancement is indeed centrally peaked). In addition to the well-known gas inflow, other mechanisms, such as gas accretion from the companions, interaction-triggered gas migration, or interaction-triggered internal structure formation, and an increase in gas turbulence can control the level and distribution of the star formation in galaxies in pairs/mergers (§5.1).
-
•
Our analysis clearly shows that the magnitude of interaction-triggered star formation varies with galactocentric radius. As such, the physical coverage of a fixed angular fiber, such as the traditional SDSS observations, and how the aperture correction of SFR is made may affect the derived interaction-triggered star formation rate. Specifically, the degree of enhancement decreases as physical fiber coverage increases due to dilution of triggered star formation by disk regions (§5.3 and Figure 6).
Our understanding of the mechanisms that trigger star formation during galaxy interactions is far from complete. In future work, we intend to investigate (1) the dependence of the interaction-triggered star formation on merger configurations (mass ratio, wet mergers and dry mergers), (2) the interaction-triggered changes of metallicity of galaxies (Barrera-Ballesteros et al. in prep.), using our MaNGA data, and (3) the evolution of molecular gas (i.e., stellar nurseries) properties along the merger sequence, using ALMA data. The explorations of a wide range in parameter space and interstellar medium (ISM) properties is required to constrain the whole picture of interaction-triggered star formation.
Acknowledgements
We thank the anonymous referee for useful comments which improved this paper. The authors also thank Sara Ellison and Mallory Thorp for many useful and enjoyable discussions regarding galaxy mergers and Gaoxiang Jin for discussions on merger stage classification. The work is supported by the Academia Sinica under the Career Development Award CDA-107-M03 and the Ministry of Science & Technology of Taiwan under the grant MOST 107-2119-M-001-024-. PBT acknowledges partial support from UNAB research grant 2019. MB acknowledges the FONDECYT regular grant 1170618. RR thanks FAPERGS, CNPq and CAPES. J.H.K. acknowledges financial support from the European Union’s Horizon 2020 research and innovation programme under Marie Skłodowska-Curie grant agreement No 721463 to the SUNDIAL ITN network, from the Spanish Ministry of Economy and Competitiveness (MINECO) under grant number AYA2016-76219-P, from the Fundación BBVA under its 2017 programme of assistance to scientific research groups, for the project “Using machine-learning techniques to drag galaxies from the noise in deep imaging”, and from the Leverhulme Trust through the award of a Visiting Professorship at LJMU.
This project makes use of the MaNGA-Pipe3D dataproducts. We thank the IA-UNAM MaNGA team for creating this catalogue, and the ConaCyt-180125 project for supporting them. We also thank the MPA/JHU teams for making their catalogs publicly available.
Funding for the Sloan Digital Sky Survey IV has been provided by the Alfred P. Sloan Foundation, the U.S. Department of Energy Office of Science, and the Participating Institutions. SDSS acknowledges support and resources from the Center for High-Performance Computing at the University of Utah. The SDSS web site is www.sdss.org.
SDSS is managed by the Astrophysical Research Consortium for the Participating Institutions of the SDSS Collaboration including the Brazilian Participation Group, the Carnegie Institution for Science, Carnegie Mellon University, the Chilean Participation Group, the French Participation Group, Harvard-Smithsonian Center for Astrophysics, Instituto de Astrofísica de Canarias, The Johns Hopkins University, Kavli Institute for the Physics and Mathematics of the Universe (IPMU) / University of Tokyo, the Korean Participation Group, Lawrence Berkeley National Laboratory, Leibniz Institut für Astrophysik Potsdam (AIP), Max-Planck-Institut für Astronomie (MPIA Heidelberg), Max-Planck-Institut für Astrophysik (MPA Garching), Max-Planck-Institut für Extraterrestrische Physik (MPE), National Astronomical Observatories of China, New Mexico State University, New York University, University of Notre Dame, Observatório Nacional / MCTI, The Ohio State University, Pennsylvania State University, Shanghai Astronomical Observatory, United Kingdom Participation Group, Universidad Nacional Autónoma de México, University of Arizona, University of Colorado Boulder, University of Oxford, University of Portsmouth, University of Utah, University of Virginia, University of Washington, University of Wisconsin, Vanderbilt University, and Yale University.
References
- Abazajian et al. (2009) Abazajian, K. N., Adelman-McCarthy, J. K., Agüeros, M. A., et al. 2009, ApJS, 182, 543
- Aguado et al. (2018) Aguado, D. S., Ahumada, R., Almeida, A., et al. 2018, arXiv:1812.02759
- Alonso et al. (2007) Alonso, M. S., Lambas, D. G., Tissera, P., & Coldwell, G. 2007, MNRAS, 375, 1017
- Alonso-Herrero et al. (2000) Alonso-Herrero, A., Rieke, G. H., Rieke, M. J., & Scoville, N. Z. 2000, ApJ, 532, 845
- Barnes & Hernquist (1991) Barnes, J. E., & Hernquist, L. E. 1991, ApJ, 370, L65
- Baldwin et al. (1981) Baldwin, J. A., Phillips, M. M., & Terlevich, R. 1981, PASP, 93, 5
- Barrera-Ballesteros et al. (2015a) Barrera-Ballesteros, J. K., Sánchez, S. F., García-Lorenzo, B., et al. 2015, A&A, 579, A45.
- Barrera-Ballesteros et al. (2015b) Barrera-Ballesteros, J. K., García-Lorenzo, B., Falcón-Barroso, J., et al. 2015, A&A, 582, A21
- Blanton et al. (2017) Blanton, M. R., Bershady, M. A., Abolfathi, B., et al. 2017, AJ, 154, 28
- Boquien et al. (2007) Boquien, M., Duc, P.-A., Braine, J., et al. 2007, A&A, 467, 93
- Boquien et al. (2009) Boquien, M., Duc, P.-A., Wu, Y., et al. 2009, AJ, 137, 4561
- Boquien et al. (2010) Boquien, M., Duc, P.-A., Galliano, F., et al. 2010, AJ, 140, 2124
- Bruzual & Charlot (2003) Bruzual, G., & Charlot, S. 2003, MNRAS, 344, 1000
- Bundy et al. (2015) Bundy, K., Bershady, M. A., Law, D. R., et al. 2015, ApJ, 798, 7
- Bustamante et al. (2018) Bustamante, S., Sparre, M., Springel, V., & Grand, R. J. J. 2018, MNRAS, 479, 3381
- Chang et al. (2015) Chang, Y.-Y., van der Wel, A., da Cunha, E., & Rix, H.-W. 2015, ApJS, 219, 8
- Cano-Díaz et al. (2016) Cano-Díaz, M., Sánchez, S. F., Zibetti, S., et al. 2016, The Interplay Between Local and Global Processes in Galaxies,, 60.
- Cao et al. (2016) Cao, C., Xu, C. K., Domingue, D., et al. 2016, ApJS, 222, 16
- Casteels et al. (2013) Casteels, K. R. V., Bamford, S. P., Skibba, R. A., et al. 2013, MNRAS, 429, 1051.
- Cid Fernandes et al. (2013) Cid Fernandes, R., Pérez, E., García Benito, R., et al. 2013, A&A, 557, A86
- Combes et al. (1994) Combes, F., Prugniel, P., Rampazzo, R., & Sulentic, J. W. 1994, A&A, 281, 725
- Cortijo-Ferrero et al. (2017a) Cortijo-Ferrero, C., González Delgado, R. M., Pérez, E., et al. 2017, MNRAS, 467, 3898
- Cortijo-Ferrero et al. (2017b) Cortijo-Ferrero, C., González Delgado, R. M., Pérez, E., et al. 2017, A&A, 606, A95
- Cortijo-Ferrero et al. (2017c) Cortijo-Ferrero, C., González Delgado, R. M., Pérez, E., et al. 2017, A&A, 607, A70
- Cox et al. (2008) Cox, T. J., Jonsson, P., Somerville, R. S., Primack, J. R., & Dekel, A. 2008, MNRAS, 384, 386
- Darg et al. (2010a) Darg, D. W., Kaviraj, S., Lintott, C. J., et al. 2010a, MNRAS, 401, 1043
- Darg et al. (2010b) Darg, D. W., Kaviraj, S., Lintott, C. J., et al. 2010b, MNRAS, 401, 1552
- Davies et al. (2015) Davies, L. J. M., Robotham, A. S. G., Driver, S. P., et al. 2015, MNRAS, 452, 616
- Di Matteo et al. (2007) Di Matteo, P., Combes, F., Melchior, A.-L., & Semelin, B. 2007, A&A, 468, 61
- Di Matteo et al. (2008) Di Matteo, P., Bournaud, F., Martig, M., et al. 2008, A&A, 492, 31
- Drory et al. (2015) Drory, N., MacDonald, N., Bershady, M. A., et al. 2015, AJ, 149, 77
- Duc et al. (1997) Duc, P.-A., Mirabel, I. F., & Maza, J. 1997, A&AS, 124, 533
- Ellison et al. (2013) Ellison, S. L., Mendel, J. T., Patton, D. R., & Scudder, J. M. 2013, MNRAS, 435, 3627
- Ellison et al. (2015) Ellison, S. L., Fertig, D., Rosenberg, J. L., et al. 2015, MNRAS, 448, 221.
- Ellison et al. (2018) Ellison, S. L., Sánchez, S. F., Ibarra-Medel, H., et al. 2018, MNRAS, 474, 2039
- Ellison et al. (2019) Ellison, S. L., Viswanathan, A., Patton, D. R., et al. 2019, MNRAS, 487, 2491
- Elmegreen et al. (1995a) Elmegreen, D. M., Kaufman, M., Brinks, E., Elmegreen, B. G., & Sundin, M. 1995, ApJ, 453, 100
- Elmegreen et al. (1995b) Elmegreen, B. G., Sundin, M., Kaufman, M., Brinks, E., & Elmegreen, D. M. 1995, ApJ, 453, 139
- Elmegreen et al. (2000) Elmegreen, B. G., Kaufman, M., Struck, C., et al. 2000, AJ, 120, 630
- Elmegreen et al. (2017) Elmegreen, D. M., Elmegreen, B. G., Kaufman, M., et al. 2017, ApJ, 841, 43.
- Elmegreen et al. (2006) Elmegreen, D. M., Elmegreen, B. G., Kaufman, M., et al. 2006, ApJ, 642, 158
- Espada et al. (2018) Espada, D., Martin, S., Verley, S., et al. 2018, ApJ, 866, 77
- Fischer et al. (2019) Fischer, J.-L., Domínguez Sánchez, H., & Bernardi, M. 2019, MNRAS, 483, 2057.
- Gunn et al. (2006) Gunn, J. E., Siegmund, W. A., Mannery, E. J., et al. 2006, AJ, 131, 2332
- Gao & Solomon (1999) Gao, Y., & Solomon, P. M. 1999, ApJ, 512, L99
- García-Benito et al. (2019) García-Benito, R., González Delgado, R. M., Pérez, E., et al. 2019, A&A, 621, A120
- González Delgado et al. (2016) González Delgado, R. M., Cid Fernandes, R., Pérez, E., et al. 2016, A&A, 590, A44.
- Gordon et al. (2017) Gordon, Y. A., Owers, M. S., Pimbblet, K. A., et al. 2017, MNRAS, 465, 2671.
- Gunn et al. (2006) Gunn, J. E., Siegmund, W. A., Mannery, E. J., et al. 2006, AJ, 131, 2332.
- Guo et al. (2016) Guo, R., Hao, C.-N., Xia, X.-Y., et al. 2016, Research in Astronomy and Astrophysics, 16, 113
- Hart et al. (2017a) Hart, R. E., Bamford, S. P., Casteels, K. R. V., et al. 2017, MNRAS, 468, 1850
- Hart et al. (2017b) Hart, R. E., Bamford, S. P., Hayes, W. B., et al. 2017, MNRAS, 472, 2263
- Herrera et al. (2011) Herrera, C. N., Boulanger, F., & Nesvadba, N. P. H. 2011, A&A, 534, A138
- Hopkins et al. (2013) Hopkins, P. F., Cox, T. J., Hernquist, L., et al. 2013, MNRAS, 430, 1901
- Hughes et al. (2013) Hughes, A., Meidt, S. E., Colombo, D., et al. 2013, ApJ, 779, 46
- Hwang et al. (2010) Hwang, H. S., Elbaz, D., Lee, J. C., et al. 2010, A&A, 522, A33
- Ji et al. (2014) Ji, I., Peirani, S., & Yi, S. K. 2014, A&A, 566, A97
- Kauffmann et al. (1993) Kauffmann, G., White, S. D. M., & Guiderdoni, B. 1993, MNRAS, 264, 201
- Kauffmann et al. (2003) Kauffmann, G., Heckman, T. M., White, S. D. M., et al. 2003, MNRAS, 341, 33
- Kennicutt (1998) Kennicutt, R. C., Jr. 1998, ARA&A, 36, 189
- Kewley et al. (2001) Kewley, L. J., Dopita, M. A., Sutherland, R. S., Heisler, C. A., & Trevena, J. 2001, ApJ, 556, 121
- Kim et al. (2014) Kim, J. H., Peirani, S., Kim, S., et al. 2014, ApJ, 789, 90
- Knapen & James (2009) Knapen, J. H., & James, P. A. 2009, ApJ, 698, 1437
- Knapen et al. (2015) Knapen, J. H., Cisternas, M., & Querejeta, M. 2015, MNRAS, 454, 1742
- Koss et al. (2012) Koss, M., Mushotzky, R., Treister, E., et al. 2012, ApJ, 746, L22
- Kroupa (2001) Kroupa, P. 2001, MNRAS, 322, 231
- Lacerda et al. (2018) Lacerda, E. A. D., Cid Fernandes, R., Couto, G. S., et al. 2018, MNRAS, 474, 3727
- Lambas et al. (2003) Lambas, D. G., Tissera, P. B., Alonso, M. S., & Coldwell, G. 2003, MNRAS, 346, 1189
- Lang et al. (2014) Lang, M., Holley-Bockelmann, K., & Sinha, M. 2014, ApJ, 790, L33
- Law et al. (2015) Law, D. R., Yan, R., Bershady, M. A., et al. 2015, AJ, 150, 19
- Law et al. (2016) Law, D. R., Cherinka, B., Yan, R., et al. 2016, AJ, 152, 83
- Lelli et al. (2014) Lelli, F., Verheijen, M., & Fraternali, F. 2014, MNRAS, 445, 1694.
- Li et al. (2008a) Li, C., Kauffmann, G., Heckman, T. M., Jing, Y. P., & White, S. D. M. 2008a, MNRAS, 385, 1903
- Li et al. (2008b) Li, C., Kauffmann, G., Heckman, T. M., White, S. D. M., & Jing, Y. P. 2008b, MNRAS, 385, 1915
- Lin et al. (2004) Lin, L., Koo, D. C., Willmer, C. N. A., et al. 2004, ApJ, 617, L9
- Lin et al. (2007) Lin, L., Koo, D. C., Weiner, B. J., et al. 2007, ApJ, 660, L51
- Łokas et al. (2016) Łokas, E. L., Ebrová, I., del Pino, A., et al. 2016, ApJ, 826, 227.
- McQuinn et al. (2012) McQuinn, K. B. W., Skillman, E. D., Dalcanton, J. J., et al. 2012, ApJ, 759, 77.
- Mendel et al. (2014) Mendel, J. T., Simard, L., Palmer, M., Ellison, S. L., & Patton, D. R. 2014, ApJS, 210, 3
- Michel-Dansac et al. (2008) Michel-Dansac, L., Lambas, D. G., Alonso, M. S., & Tissera, P. 2008, MNRAS, 386, L82
- Michiyama et al. (2016) Michiyama, T., Iono, D., Nakanishi, K., et al. 2016, Publications of the Astronomical Society of Japan, 68, 96.
- Moreno et al. (2015) Moreno, J., Torrey, P., Ellison, S. L., et al. 2015, MNRAS, 448, 1107
- Moreno et al. (2019) Moreno, J., Torrey, P., Ellison, S. L., et al. 2019, MNRAS, 485, 1320
- Noguchi (1988) Noguchi, M. 1988, A&A, 201, 37.
- Pan et al. (2015) Pan, H.-A., Kuno, N., Sorai, K., et al. 2015, PASJ, 67, 116
- Pan et al. (2018) Pan, H.-A., Lin, L., Hsieh, B.-C., et al. 2018a, ApJ, 868, 132
- Pan et al. (2018) Pan, H.-A., Lin, L., Hsieh, B.-C., et al. 2018b, ApJ, 854, 159
- Patel et al. (2013) Patel, S. G., van Dokkum, P. G., Franx, M., et al. 2013, ApJ, 766, 15
- Patton et al. (2002) Patton, D. R., Pritchet, C. J., Carlberg, R. G., et al. 2002, ApJ, 565, 208
- Patton et al. (2013) Patton, D. R., Torrey, P., Ellison, S. L., Mendel, J. T., & Scudder, J. M. 2013, MNRAS, 433, L59
- Pawlowski et al. (2011) Pawlowski, M. S., Kroupa, P., & de Boer, K. S. 2011, A&A, 532, A118
- Perez et al. (2011) Perez, J., Michel-Dansac, L., & Tissera, P. B. 2011, MNRAS, 417, 580
- Pettitt et al. (2017) Pettitt, A. R., Tasker, E. J., Wadsley, J. W., Keller, B. W., & Benincasa, S. M. 2017, MNRAS, 468, 4189
- Powell et al. (2013) Powell, L. C., Bournaud, F., Chapon, D., & Teyssier, R. 2013, MNRAS, 434, 1028
- Renaud et al. (2015) Renaud, F., Bournaud, F., & Duc, P.-A. 2015, MNRAS, 446, 2038
- Renaud et al. (2016) Renaud, F., Famaey, B., & Kroupa, P. 2016, MNRAS, 463, 3637
- Richards et al. (2016) Richards, S. N., Bryant, J. J., Croom, S. M., et al. 2016, MNRAS, 455, 2826.
- Robertson et al. (2006) Robertson, B., Bullock, J. S., Cox, T. J., et al. 2006, ApJ, 645, 986
- Sacchi et al. (2018) Sacchi, E., Cignoni, M., Aloisi, A., et al. 2018, ApJ, 857, 63.
- Salpeter (1955) Salpeter, E. E. 1955, ApJ, 121, 161
- Sánchez et al. (2012) Sánchez, S. F., Kennicutt, R. C., Gil de Paz, A., et al. 2012, A&A, 538, A8
- Sánchez et al. (2014) Sánchez, S. F., Rosales-Ortega, F. F., Iglesias-Páramo, J., et al. 2014, A&A, 563, A49
- Sánchez et al. (2016a) Sánchez, S. F., Pérez, E., Sánchez-Blázquez, P., et al. 2016, Rev. Mexicana Astron. Astrofis., 52, 21
- Sánchez et al. (2016b) Sánchez, S. F., Pérez, E., Sánchez-Blázquez, P., et al. 2016, Rev. Mexicana Astron. Astrofis., 52, 171
- Sánchez et al. (2018) Sánchez, S. F., Avila-Reese, V., Hernandez-Toledo, H., et al. 2018, Rev. Mexicana Astron. Astrofis., 54, 217
- Schmidt et al. (2013) Schmidt, K. B., Rix, H.-W., da Cunha, E., et al. 2013, MNRAS, 432, 285
- Scudder et al. (2012) Scudder, J. M., Ellison, S. L., Torrey, P., Patton, D. R., & Mendel, J. T. 2012, MNRAS, 426, 549
- Scudder et al. (2015) Scudder, J. M., Ellison, S. L., Momjian, E., et al. 2015, MNRAS, 449, 3719
- Sengupta et al. (2015) Sengupta, C., Scott, T. C., Paudel, S., et al. 2015, A&A, 584, A114
- Silva et al. (2018) Silva, A., Marchesini, D., Silverman, J. D., et al. 2018, ApJ, 868, 46
- Sinha & Holley-Bockelmann (2012) Sinha, M., & Holley-Bockelmann, K. 2012, ApJ, 751, 17
- Sillero et al. (2017) Sillero, E., Tissera, P. B., Lambas, D. G., & Michel-Dansac, L. 2017, MNRAS, 472, 4404
- Silva et al. (2018) Silva, A., Marchesini, D., Silverman, J. D., et al. 2018, ApJ, 868, 46
- Smee et al. (2013) Smee, S. A., Gunn, J. E., Uomoto, A., et al. 2013, AJ, 146, 32
- Smith et al. (2016) Smith, B. J., Zaragoza-Cardiel, J., Struck, C., Olmsted, S., & Jones, K. 2016, AJ, 151, 63
- Struck et al. (2005) Struck, C., Kaufman, M., Brinks, E., et al. 2005, MNRAS, 364, 69.
- Sparre, & Springel (2017) Sparre, M., & Springel, V. 2017, MNRAS, 470, 3946
- Spindler et al. (2018) Spindler, A., Wake, D., Belfiore, F., et al. 2018, MNRAS, 476, 580
- Taylor et al. (2011) Taylor, E. N., Hopkins, A. M., Baldry, I. K., et al. 2011, MNRAS, 418, 1587
- Teyssier et al. (2010) Teyssier, R., Chapon, D., & Bournaud, F. 2010, ApJ, 720, L149
- Thorp et al. (2019) Thorp, M. D., Ellison, S. L., Simard, L., Sánchez, S. F., & Antonio, B. 2019, MNRAS, 482, L55
- Toomre (1977) Toomre, A. 1977, in The Evolution of Galaxies and Stellar Populations, ed. B. M. Tinsley & R. B. Larson (New Haven: Yale Univ. Press), 401
- Torrey et al. (2012) Torrey, P., Cox, T. J., Kewley, L., & Hernquist, L. 2012, ApJ, 746, 108
- Ueda et al. (2014) Ueda, J., Iono, D., Yun, M. S., et al. 2014, ApJS, 214, 1
- Veilleux et al. (2002) Veilleux, S., Kim, D.-C., & Sanders, D. B. 2002, ApJS, 143, 315
- Violino et al. (2018) Violino, G., Ellison, S. L., Sargent, M., et al. 2018, MNRAS, 476, 2591
- Vogt et al. (2013) Vogt, F. P. A., Dopita, M. A., & Kewley, L. J. 2013, ApJ, 768, 151
- Wake et al. (2017) Wake, D. A., Bundy, K., Diamond-Stanic, A. M., et al. 2017, AJ, 154, 86
- Wang et al. (2004) Wang, Z., Fazio, G. G., Ashby, M. L. N., et al. 2004, ApJS, 154, 193
- Weinzirl et al. (2009) Weinzirl, T., Jogee, S., Khochfar, S., et al. 2009, ApJ, 696, 411
- Westfall et al. (2019) Westfall, K. B., Cappellari, M., Bershady, M. A., et al. 2019, arXiv:1901.00856
- Wild et al. (2014) Wild, V., Rosales-Ortega, F., Falcón-Barroso, J., et al. 2014, A&A, 567, A132
- Wilson et al. (2003) Wilson, C. D., Scoville, N., Madden, S. C., & Charmandaris, V. 2003, ApJ, 599, 1049
- Woods, & Geller (2007) Woods, D. F., & Geller, M. J. 2007, AJ, 134, 527.
- Yan et al. (2016a) Yan, R., Tremonti, C., Bershady, M. A., et al. 2016, AJ, 151, 8
- Yan et al. (2016b) Yan, R., Bundy, K., Law, D. R., et al. 2016, AJ, 152, 197.
- Xu et al. (2012) Xu, C. K., Shupe, D. L., Béthermin, M., et al. 2012, ApJ, 760, 72
- Zana et al. (2018) Zana, T., Dotti, M., Capelo, P. R., et al. 2018, MNRAS, 479, 5214