Design rules for liquid crystalline electrolytes for enabling dendrite-free lithium metal batteries
Abstract
Dendrite free electrodeposition of lithium metal is necessary for the adoption of high energy density rechargeable lithium metal batteries. Here, we demonstrate a new mechanism of using a liquid crystalline electrolyte to suppress dendrite growth with a lithium metal anode. A nematic liquid crystalline electrolyte modifies the kinetics of electrodeposition by introducing additional overpotential due to its bulk distortion and anchoring free energy. By extending the phase-field model, we simulate the morphological evolution of the metal anode and explore the role of bulk distortion and anchoring strengths on the electrodeposition process. We find that adsorption energy of liquid crystalline molecules on lithium surface can be a good descriptor for the anchoring energy and obtain it using first-principles density functional theory calculations. Unlike other extrinsic mechanisms, we find that liquid crystals with high anchoring strengths can ensure smooth electrodeposition of lithium metal, thus paving the way for practical applications in rechargeable batteries based on metal anodes.
keywords:
liquid crystal, batteries, dendrites[chem]Department of Chemical Engineering, Carnegie Mellon University, Pittsburgh, Pennsylvania 15213, USA
![[Uncaptioned image]](/html/1907.04441/assets/x1.png)
Synopsis: We propose liquid crystals with high anchoring energies can suppress dendrite growth in Li-ion batteries with a Li metal anode.
1 Introduction
The development of high energy density rechargeable batteries is essential to meet the goals of decarbonization through electrification of transportation 1, 2 and storage of renewable technologies. The ideal anode material for lithium (Li) ion batteries is Li metal with a specific capacity over ten times that of the currently commercialized graphite anode 3, 4. It has, however, been plagued by issues related to uneven electrodeposition during charging leading to growth of dendrites and loss of Coulombic efficiency. This problem is more prominent during fast charging which is a necessity for practical applications of Li-ion batteries in electric vehicles and flights 5. Numerous approaches for suppressing dendritic growth have been proposed. These include the use of artificial solid electrolyte interphase (SEI) 6, 7, 8, additives in liquid electrolytes 9, 10, 11, 12, 13, 14, 15, surface nanostructuring 16, 17, solid polymer or inorganic electrolytes 18, 19, 20, 21, 22, 23, 24. Among the many approaches, mechanical suppression of dendrite growth through stresses at solid-solid interfaces provides design principles for the desired mechanical properties for polymer 25 and inorganic solid electrolytes 26, 27. These analyses suggest that polymers with high shear modulus and ceramics with low shear modulus can lead to stable electrodeposition. Generally, most polymers tend to be soft while ceramics tend to be hard and hence finding ceramic or polymer materials that satisfy the stability criterion has proved challenging 28.
Liquid crystalline materials offer an interesting new avenue to suppress dendritic growth through additional energetic contributions that emerge due to distortion and anchoring. These energies originate from the tendency of the anisotropic molecules to reorient and align resulting in an ordered arrangement 29. As compared to the other dendrite suppression methods, liquid crystals are easy to synthesize, manufacture and integrate into batteries, while offering the potential to spontaneously suppress dendrites without external forces (e.g. stack pressure). Liquid crystal surface properties like anchoring strengths are of importance in opto-electronic applications like liquid crystal displays, lithography and molecular electronics 30. Solid substrates in contact with liquid crystals tend to uniformly align their molecules 29 which led to the advent of liquid crystal displays, promoting research on elaborate characterization of molecular orientation with different substrates and the effects of surface treatment methods like rubbing, coating and surface active agents on surface alignment 31, 32, 33, 34. Recently, Li-containing liquid crystalline materials have been developed as electrolytes possessing high ionic conductivity 35. Engineered liquid crystalline materials are attractive candidates as electrolytes due to the presence of organized 1D, 2D or 3D pathways for ion conduction 36, 37, 35, 38. Further, high transference number, low-cost bulk manufacturing, low-flammability and wider temperature window may be achieved in conjunction with fast ionic transport in the crystalline phase compared to amorphous phase 38, 39, 40, 41. Kerr et al. 42 and Sakuda et al. 43 obtained ionic conductivities in the range S/cm at room temperature. Sakuda et al. 43 further demonstrated reversible charge-discharge cycling with \ceLiFePO4 and \ceLi4Ti5O2 cathodes and Li metal anode. While ionic conductivity and voltage stability of liquid crystalline electrolytes are promising, natural questions that emerge are 1) whether liquid crystalline electrolytes in contact with a metal anode can suppress dendrites and 2) what liquid crystal properties affect the suppression. In this work, we combine phase-field simulations and density functional theory (DFT) calculations to study electrodeposition with a liquid crystalline electrolyte. We simulate the electrodeposition of a metal anode in the presence of the liquid crystalline electrolyte using a phase-field model by including the effects of bulk distortion and anchoring energies on the kinetics. We find that liquid crystalline electrolytes with sufficient anchoring strengths at the interface with the metal anode can ensure smooth electrodeposition and greatly suppress dendrite growth. We quantify dendrite suppression using three metrics based on the shape and location of the interface and its growth with time. Based on the analysis of these metrics, we provide design rules for material architectures that can suppress dendritic growth. Having identified the design rules, using DFT calculations, we identify descriptors for the anchoring energy and stability at the cathode-liquid crystalline electrolyte interface. We find that adsorption strength of liquid crystalline molecules at the lithium metal surface is a good descriptor to describe anchoring strength. We also screen for the highest occupied molecular orbital (HOMO) level for the liquid crystalline molecules to get an estimate of their oxidative stability. Given the very large design space of possible liquid crystalline electrolytes, we believe that these descriptors are stepping stones towards a larger high-throughput search over the design space.
2 Liquid Crystalline Electrolyte Design Considerations
Liquid crystalline phases are commonly found in materials composed of anisotropic molecules which interact with one another 29. In the simplest liquid crystalline phase called the nematic phase, molecules tend to orient parallel to each other giving rise to orientational order but no long range positional order. Liquid crystalline electrolytes typically consist of liquid crystalline phase mixed with a conventional organic solvent and lithium containing electrolyte salt. Examples include a rod-like molecule having a mesogenic unit and an alkyl chain terminating in a carbonate moiety and lithium bis(trifluoromethylsulfonyl)imide (LiTFSI) used by Sakuda et al. 43 and amphiphilic -cyclodextrins with LiTFSI proposed by Champagne et al. 44
For use of these liquid crystalline in a battery, an electrolyte must satisfy numerous properties simultaneously. It must possess sufficient electrochemical stability at the anode and cathode chosen, high ionic conductivity, low electronic conductivity, thermal stability and good adhesion (wetting) at the interface 45.
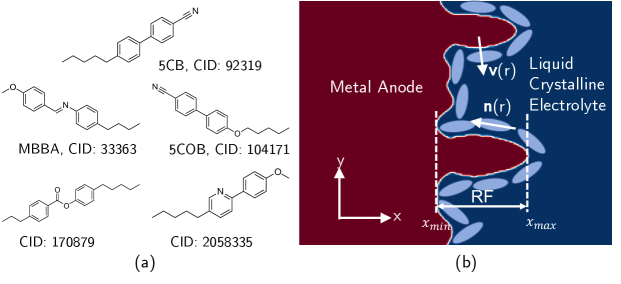
The possible design space of liquid crystalline electrolytes is large 35. For the liquid crystalline molecule chosen, properties can be be tuned through the length of the backbone chain, functional end groups and salt molarity 46, 47. The ionic conductivity could be tuned by modifying the fraction of Li salt used 43. Common liquid crystals include -cyanobiphenyls (CB, being the length of alkyl chain), N-(4-Methoxybenzylidene)-4-butylaniline (MBBA) & 4-(4-pentoxyphenyl)benzonitrile (5COB) and are shown in Fig. 1a. MBBA and 5CB are most commonly used for physical and electrooptical investigations of nematic liquid crystals.
Most liquid crystals are electronically insulating but conductive ones have been designed with 1D or 2D conductivity through doping 48, 49. The conductivity of disc-shaped solid-like 2,3,6,7,10,11-hexakis- (hexyloxy)triphenylene (HAT6) has been shown to increase from below S m-1 to S m-1 on doping with the Lewis acid \ceAlCl3 with p-type conduction 49. In general, liquid crystals with low oxidation (reduction) potentials can be doped with electron acceptors (donors) to increase electronic conductivity 50. Rod-like molecules like the ones mentioned above are generally electronically insulating and only show electronic conduction only under very high purity 51.
Nematic liquid crystals undergo a first order nematic to isotropic transition as the temperature is increased to the transition temperature with a sudden decrease in the order parameter. The transition temperature can be increased, for example, by increasing the length of the alkyl chain in CB while also exhibiting the odd-even effect 46, 52. The transition is reversible which ensures that the properties can be recovered in case the temperature increases during device operation. Liquid crystalline macromolecular structures or polymers exhibit better chemical stability and low flammability 53, 40.
All of this points to the promise of using liquid crystalline electrolyte in battery systems. In our design space analysis, we focus on electrochemical stability and desired properties required for suppressing dendrites at the lithium metal-liquid crystalline electrolyte interface. We use phase-field simulations combined with density functional theory (DFT) to calculate these properties. In the next section, we formulate electrochemical kinetics in the presence of a liquid crystalline electrolyte.
3 Electrodeposition Kinetics
We discuss below the reformulation of electrochemical kinetics in the presence of liquid crystalline electrolytes, in the context of a phase-field model. Fig. 1b shows a schematic of a metal anode in contact with a nematic liquid crystalline electrolyte. The average orientation of the molecules is given by a unit vector which is called the director. In a distorted liquid crystal, the director will vary with space . The bulk distortion free energy of the liquid crystal can be written in terms of the director field using three elastic constants corresponding to splay, twist and bend deformations 29.
In this work, we use the one-constant approximation 29 with elastic constant which gives a simple form of the distortion free energy:
| (1) |
This equation is widely used for simulating liquid crystal behavior due to its simple form and gives valuable insights on distortions in nematics. Berreman used a similar form of the distortion free energy to explain the orientation of nematics in contact with a solid surface and grooved surface 54, 55. In addition to bulk distortion free energy, existence of an interface with the Li metal will result in certain preferred directions for the director of the molecules in contact 47, called the easy axes. The easy axes can be, for example, crystallographic directions for an interface with a single crystal or at a certain angle to the surface in the case of MBBA free surface 29, 56. This results in the so called strong anchoring of the nematic phase at an interface. Here we use the form of anchoring energy derived from the expression proposed by Rapini and Papoular 57, 58
| (2) |
In this equation, is the normal to the interface between the electrode and the electrolyte, is the anchoring strength and the integration is performed over the interface area (See Supporting Information for derivation). This energy favors alignment of the liquid crystal molecules along the tangent to the interface as shown in Fig. 1b.
Since the morphological evolution of the metal anode under electrodeposition involves moving interfaces, phase-field models are ideal to treat this problem without having to track the actual position of the interface 59, 60. A phase-field model is an efficient simulation tool to obtain mesoscale insights on phase transitions, transformations and microstructure evolution 60, 61, 62, 63. Previously, several phase-field simulation models have been developed for obtaining a quantitative understanding of dendrite growth in Li-ion batteries 64, 65, 66, 67, 68, 69. Here we use the fully open source MOOSE (Multiphysics Object-Oriented Simulation Environment) framework 70 to solve the phase-field equations 71.
Our phase-field model uses the grand potential functional to generate the phase-field equations 72, 68. This formulation permits the use of a larger interface thickness for computational convenience, much greater than the physical width of the interface while eliminating non-physical effects. The phase-field variable is a nonconserved order parameter whose value is 1 for the metal anode (solid) and 0 for the electrolyte (liquid). We use the Butler Volmer - Allen Cahn reaction (BV-ACR) equation for the evolution of the phase-field variable with time 67, 64, 68:
| (3) |
where and are the interfacial mobility and electrochemical reaction kinetics coefficient respectively. is a double-well function where is related to the switching barrier and is the gradient energy coefficient. The surface energy and interface thickness can be used to obtain the values of and 65, 73. is the interpolation function for . A Langevin noise term is added to the equation to account for thermal and structural fluctuations. is related to the kinetics of electrodeposition in terms of the total overpotential at the interface. The overpotential and hence the kinetics is modified by the liquid crystal due to a change in equilibrium potential difference between the electrode and the electrolyte. Let be the overpotential without the liquid crystal and be the additional overpotential due to the liquid crystal i.e. . The charge transfer coefficient for the liquid crystal overpotential will in general be different from that for 74, 75, 26, 76, 77. Assuming a Butler Volmer equation with charge transfer coefficients , for the cathode and anode, and a cathodic charge transfer coefficient for the liquid crystal overpotential, we obtain:
| (4) |
Parameters , , and are the number of electrons transferred, Faraday’s constant, gas constant and temperature respectively. The overpotential can be written in terms of the actual and equilibrium potential at the anode () and the electrolyte as . is the mole fraction of Li and is its standard mole fraction. The charge transfer coefficient can be associated with mechanical deformation and heterogeneity at the interface. It is related to the parameter introduced by Monroe and Newman 75 as and the parameters and used by McMeeking et al. 76. Diggle et al. 74 found the value of to be 1, giving . In this work, we have used and . Simulations performed using did not show any noticeable difference in the morphological evolution as evident from Fig. S3. The calculation of requires a model for the free energy of the liquid crystal. A liquid crystalline material in the electrolyte introduces an additional grand free energy given by
| (5) |
Here is the anchoring energy factor accounting for the strong anchoring for the liquid crystal against the surface of the anode. The factor ensures that the liquid crystal free energy is non-zero only in the electrolyte phase. The second term is active only at the interface due to the presence of . Using the fact that at the interface and comparing the integral of the second term in Eq. (5) with Eq. (2), we obtain . This can be used to obtain estimates of since measured values for for different liquid crystals are available in literature 78. The additional overpotential due to the liquid crystal can be calculated from its grand free energy contribution using (details in Supporting Information)
| (6) |
where is the molar volume of the metal ion in the liquid crystalline electrolyte. From this equation, we note that the molar volume accounts for the mole fraction share of energy of metal ion out of the total liquid crystal energy. Since liquid crystal relaxation is expected to occur at a time scale much lower than the time scale of diffusion and electrodeposition, we assume equilibrium of the liquid crystal director field in the electrolyte i.e. . The constraint on the director field is enforced by the hard constraint method utilizing the Lagrange multiplier technique 71. Together with evolution equation for the phase-field variable Eq. (3), the equations for the evolution of the chemical potential of Li and spatial distribution of the electric potential are also solved and are given in the Supporting Information.
4 Results and discussion
4.1 Electrodeposition morphology
A m thick Li electrode with perfectly flat interface is used as the initial configuration for the anode upon which Li is electrodeposited. The low initial thickness ensures that the cell has a high energy density due to the high fraction of Li passed per cycle 79, 80. The simulation parameters and the details of the initial and boundary conditions are provided in the Supporting Information. We use three metrics to quantify the dendrite growth or suppression during the morphological evolution of the electrode. The first metric, roughness factor is a measure of the unevenness of the Li electrode surface during electrodeposition. A perfectly smooth surface will have a value of zero whereas a surface with dendritic growth will have a high value of roughness factor. The roughness factor RF measures the range of the coordinate profile of the interface. For Fig. 1, the roughness factor is . This is one of the definitions of arithmetic average roughness of a surface 81. The second metric is the time required to cause short circuit 82 at a given x-coordinate in the 2D mesh. For a given x-coordinate, the short circuit time is defined as the time when the metal electrode surface reaches that x-coordinate. This gives an indication of the time to short circuit the battery if the counter-electrode was located at that coordinate. The third metric used is related to the arc length of the electrode/electrolyte interface. When the deposition is uneven, the arc length of the interface treated as a curve in two dimensions increases. We measure this deviation using the arc length ratio parameter where is the length of the interface at a given time calculated by using the arc length formula for a curve and is the initial length of the interface ( m in our simulations). Besides quantifying the deviation from an ideal interface, the arc length ratio is also related to the amount of Li consumed at the non-ideal interface resulting in lowering of Coulombic efficiency. In the calculation of these metrics, we used the contour line as the interface between the two phases.
We simulated electrodeposition on Li metal anode for the two cases of a conventional liquid electrolyte using the properties of 1 M \ceLiPF6 in EC:DMC (1:1 volume ratio) solution (hereafter referred to as the standard electrolyte) and a liquid crystalline electrolyte (hereafter referred to as the LC electrolyte). The properties of the electrolytes are given in Supporting Information. For comparison, we assume the dimensionless values of the elastic constant and the anchoring strength to be and . Although LC electrolytes may be engineered to have anisotropic diffusivity 83, we use isotropic diffusivity here for the sake of simplicity and comparison with a standard electrolyte. Fig. 2a shows the variation of maximum x-coordinate of the metal electrode surface and the roughness factor as a function of time (black and blue lines respectively). With a standard electrolyte, the metal electrode surface initially grows at a constant velocity with zero roughness factor. The surface starts to roughen at s or when 20 m Li has been deposited ( m at the interface), and the growth rate of the metal starts increasing due to high electric field and \ceLi+ concentration at the tip of the dendrites 68. In contrast, for the case of LC electrolyte, the surface remains uniform even till s or when 90 m of Li has been deposited.
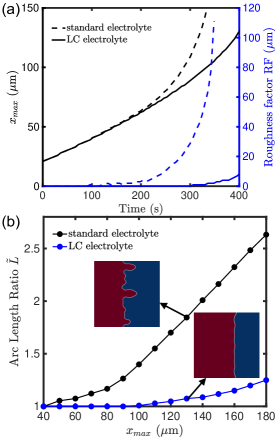
We observe that once the metal surface begins to roughen and the dendrites start to grow (Fig. 2a), the growth rate increases rapidly since the deposition gets focused at the dendrite tips. Therefore, after the onset of dendritic growth, the maximum x-coordinate of the metal electrode surface at a given time is different in the case of a standard electrolyte and an LC electrolyte. To compare the other two metrics, we used their values when the metal electrode surface attains the same maximum x-coordinate rather than at the same time since this is directly related to the total current passing through the cell. Fig. 2b shows the variation of the arc length ratio as a function of the maximum x-coordinate of the interface. With a standard electrolyte, the interface arc length ratio quickly becomes greater than one as the metal electrode surface reaches m due to growth of surface perturbations. For m m, several perturbations are generated at the metal electrode surface leading to a positive slope of the vs plot. As the metal electrode surface reaches m (60 m of Li deposition), these perturbations lead to the growth of three dendrites (movie S1). This leads to an increased slope of the vs curve. For the case of a LC electrolyte, the interface arc length remains close to the initial value till m or for 80 m of electrodeposition. After this point, there is a small increase in the arc length ratio due to generation of small surface perturbations, however, none of the perturbations are observed to grow into large dendrites (movie S2).
The discussion above clearly provides a compelling demonstration of the dendrite suppressing nature of LC electrolytes. The liquid crystal is able to suppress the perturbations at the surface through a delicate interplay between bulk and interfacial distortion free energy, oxidation and reduction processes. In contrast to the standard electrolyte, the high current density hotspots during electrodeposition are rarely observed with an LC electrolyte at the interface. The existence of sharp peaks or valleys on the surface will result in sudden change in the orientation of the director field due to the strong anchoring boundary condition at the interface. This will result in an unfavorable high energy configuration of the director field. Our results demonstrate that it is possible to suppress dendrite growth and enhance the fraction of Li passed during cycling using an LC electrolyte.
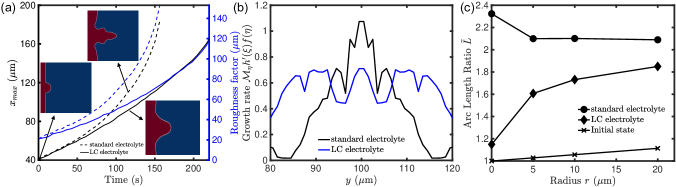
Nucleation- To understand the rearrangement of the director field at a rough surface and its effects on electrodeposition, we generate an initial perturbation on the the metal electrode surface and simulate electrodeposition under an applied overpotential. The perturbation is a hemispherical nucleus with three different radii: m, m and 20 m generated by setting the initial condition for the phase-field variable inside the hemisphere. The director field of the liquid crystal reorients in response to the perturbation of the metal electrode surface (Fig. S2). Due to anchoring energy of the LC electrolyte, the director field becomes tangent to the metal electrode surface at the interface. The director field in the vicinity of the interface also changes to minimize the distortion free energy which is proportional to the bulk elastic constant. Fig. 3a shows the maximum x-coordinate and roughness of the metal surface with time for the standard and LC electrolyte. The insets show the initial condition and the metal surface after 120 s of electrodeposition. Electrodeposition with the standard electrolyte leads to the development of sharp peaks from the initial nucleus. These peaks originate from the high current density hotspots and encourage faster electrodeposition by attracting metal ions due to the high electric fields generated, as explained in Ref. 68. In contrast, the LC electrolyte prevents the formation of sharp peaks at the interface due to the anchoring energy, leading to an approximately constant growth velocity and a spatially homogeneous growth at the metal surface. The function , which is the growth rate of the metal surface due to the overpotential, is plotted for the standard and LC electrolyte in Fig. S4 at s. The standard electrolyte case has a more localized brown region at the tip of the hemisphere, showing a high current density hotspot as compared to the LC electrolyte case. This point is elucidated in Fig. 3b showing the maximum of the metal surface growth rate due to overpotential, at each y-coordinate in the 2D domain. The maximum in the growth rate for a given y-coordinate occurs at the interface where the electrodeposition reaction occurs. The growth rate for the standard electrolyte is much more localized at the tip of the nucleus (m) compared to that for an LC electrolyte. The arc length ratio plotted as a function of the maximum x-coordinate of the metal surface for different initial nucleus radii also increases faster for the standard electrolyte compared to the LC electrolyte (Fig. S7). Fig. 3c shows the variation of the arc length ratio at m with the radius of the nucleus. The arc length ratio obtained using an LC electrolyte decreases as the size of the initial perturbation decreases while it remains almost constant with a standard electrolyte. This variation can be used to determine the initial roughness of the metal anode sample to design for a given thickness of electrodeposited metal and final roughness/arc length ratio that can be tolerated.
4.2 Liquid crystalline electrolyte selection metrics
As outlined earlier, for use in a battery, the liquid crystalline electrolyte must satisfy several properties in addition to the metrics we identified in the previous section. We begin by exploring the oxidative stability of liquid crystalline molecules and then explore the metrics related to electrodeposition.
Oxidative Stability: One necessary but not sufficient condition 84 is that the highest occupied molecular orbital (HOMO) level of the electrolyte should lie below the electrochemical potential of the cathode . A large negative HOMO level (referenced to vacuum level) would ensure sufficient stability of the electrolyte and prevent decomposition. We obtained the HOMO level of the electrolyte using DFT calculations of neutral and positively charged liquid crystal molecules which have been well benchmarked against experimental data 85. As shown in Table 1, we find that liquid crystalline electrolyte molecules considered have moderate cathode stability (HOMO level eV) relative to conventional small organic molecules used (ethylene carbonate, dimethyl ether) in traditional liquid electrolytes, that have HOMO levels between and eV. Among the liquid crystal molecules considered, 5CB is the most stable due to the cyano-group, while the addition of an ether functionalization reduces the HOMO level a bit in 5COB. We find the other ether and ester-based liquid crystalline molecules (CID: 170879 and 2058335) have similar stability while among the molecules considered, MBBA is the least stable due to the presence of the imine functional group. As shown here, the HOMO levels of these molecules can be manipulated by lowering the acceptor number of the end functional groups 85, such as those demonstrated by carbonate-based (stable upto 2 V vs. Li/\ceLi+) 43 or cyano-based liquid crystals (stable upto 3 V vs. Li/\ceLi+) 44. Engineering the cathode stability will be an important challenge to realize these liquid crystalline electrolytes in a practical system.
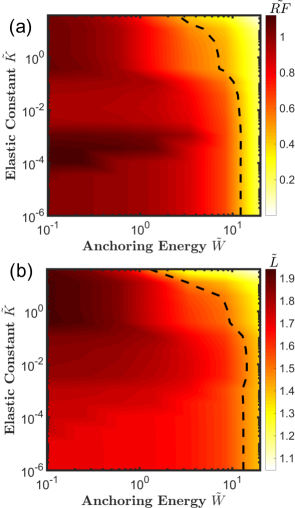
Dendrite Suppression: Having explored the oxidative stability, we will now understand the effect of the properties of liquid crystal on the metrics for dendrite suppression. We performed phase-field simulations using a range of values of these parameters, i.e. elastic constant and anchoring strength to construct a two dimensional phase-diagram. Fig. 4 shows the variation of two metrics, roughness factor and interface arc length ratio with the values of these parameters. The variation of short circuit time is presented in Fig. S8. The roughness factor, arc length ratio and short circuit time are calculated when the metal electrode surface reaches and m respectively. The roughness factor is represented in non-dimensional form as a ratio of its value obtained using LC electrolyte to the that obtained with a standard electrolyte. For all metrics, we observe that the capability to suppress dendrites is improved as the elastic constant and the anchoring strength of the LC electrolyte is increased. From the plots, we observe that the anchoring strength is more influential for dendrite suppression than the bulk elastic constant. The arc length ratio value of 1.5 is plotted as a contour line in Fig. 4b. The region to the right of the line has better dendrite suppression capability. A higher elastic constant further increases the region of stability.
The anchoring energy with lithium metal presents a new opportunity for the development of dendrite-suppressing LC electrolytes. There are two possible directions: development of new high anchoring liquid crystal materials and engineering surfaces using, for example, coupling agents to obtain a higher degree of coupling between the metal anode and the liquid crystal resulting in high anchoring energy 86. There is limited experimental data on the anchoring energy and the influence of interfaces on detailed positional order of liquid crystals since it requires a technique sensitive to the position of molecules 47. Further, anchoring of a liquid crystal with a surface involves a variety of intermolecular interactions and is hard to model using first-principles directly without simulating thousands of atoms 34.
To obtain a theoretical estimate for the anchoring strengths of liquid crystals with Li metal, we performed DFT calculations of different liquid crystal molecules on Li (100) surface using adsorption energy as the descriptor. This is motivated by scanning tunneling microscopy experiments showing the presence of a liquid crystal surface monolayer which is immobilized in contact with a solid whose strength is controlled by physisorption 87, 88. The anchoring of liquid crystal is determined by the minimization of the interfacial energy in the presence of the liquid crystal molecules 47
| (7) |
where gives the interfacial energy without adsorption and accounts for the adsorption energy of the molecule dependent on the molecular orientation . The molecules studied contain different functional groups representing the diversity of commonly studied liquid crystals. We also performed the same calculation for 5CB and MBBA liquid crystal on silicon surface to calibrate our results with those obtained from molecular dynamics simulations 89. Our calculations substantiate the role of adsorption in controlling the molecular alignment close to the interface (Fig. 5).
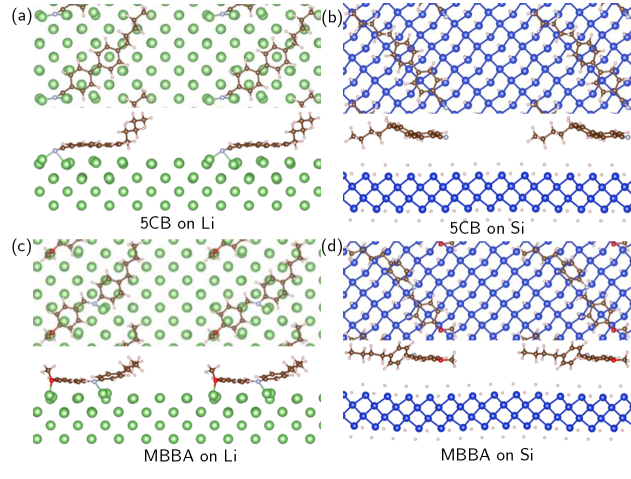
We find four liquid crystal molecules that have adsorption energies on Li surface much higher than that on Si surface (Table 1). Therefore, we expect the director field of the liquid crystal at the interface to be more strongly anchored by the Li surface compared to the Si surface due to a higher . Our simulations assume a planar anchoring of the liquid crystals but a tilted anchoring may also be used to suppress dendrites. A homeotropic anchoring, however, cannot alter the kinetics of electrodeposition since it can accommodate uneven morphology of the metal anode without an increase in bulk distortion or anchoring free energy 54.
It is also worth noting that liquid crystalline properties can be changed by temperature 29 and engineering the density of packing or particle shapes 90. These can lead to the emergence of directional entropic forces that align neighboring particles. Weng et al. 91 reported an increase in anchoring energy by using vertical alignment and polymerized surfaces generated by ultraviolet irradiation-induced phase separation. Further, nanopatterning of the surfaces using surface lithography can lead to generation of nanogrooves which can be used to tune the anchoring strength 92, 93. The dendrite suppression metrics can be further improved by increasing the molar volume of Li in the LC electrolyte (Fig. S9). This can be achieved, in practice, by tuning the ion-solvent interactions 94.
| PubChem CID | Common name | (∘C) | Adsorption Energy (J/m2) | HOMO level (eV) | |||
|---|---|---|---|---|---|---|---|
| 92319 | 5CB | 35.3 |
|
-7.69 | |||
| 33363 | MBBA | 48.0 |
|
-6.79 | |||
| 104171 | 5COB | 68.0 | -0.007 (Li) | -7.36 | |||
| 170879 | - | 15.0 | -0.040 (Li) | -7.38 | |||
| 2058335 | - | - | -0.045 (Li) | -7.47 |
5 Concluding Remarks
We have suggested a new material class, liquid crystals, as candidate electrolytes for Li metal anodes. Additional energetic contributions due to anchoring and distortion provide a new approach to suppress the onset of dendrite formation. We implemented a phase-field model which accounts for the overpotential due to the anchoring and bulk distortion of the liquid crystal, and combine them with DFT calculations to explore the design space for candidate liquid crystalline electrolytes. Using the phase-field model, we demonstrate smooth electrodeposition and spontaneous dendrite suppression with liquid crystalline electrolytes. To our knowledge, this work presents the first demonstration of dendrite suppressing character of liquid crystalline electrolytes. We identify the anchoring strength as an important tuning property that determines the degree of dendrite suppression as suggested by the values of the metrics. Having identified the design rules, we develop descriptors to propose material formulations that can satisfy these criteria. We establish a set of descriptors to screen for candidate liquid crystalline electrolytes: surface adsorption energy to analyze anchoring strength and other metrics for use in a battery such as order-disorder transition temperature, HOMO level for oxidative stability. Given the very large design space of liquid electrolytes, it is undoubtedly possible to break these design trade-offs through electrolyte engineering.
The authors thank Y.-M. Chiang, B.A. Helms, P.D. Frischmann, V. Pande and D. Krishnamurthy for helpful discussions. Z.A., Z.H. and V.V. acknowledge support from the Advanced Research Projects Agency Energy (ARPA-E) under Grant DE-AR0000774.
Details of MOOSE simulation parameters, initial and boundary conditions, derivation of overpotential and other phase-field equations, evolution of metal surface, dendrite suppression metrics and movies for Li surface evolution. The code is made freely available from https://github.com/ahzeeshan/electrodep.
References
- Sripad and Viswanathan 2017 Sripad, S.; Viswanathan, V. J. Electrochem. Soc. 2017, 164, E3635–E3646
- Moore 2014 Moore, M. D. Misconceptions of Electric Aircraft and their Emerging Aviation Markets; AIAA SciTech Forum; American Institute of Aeronautics and Astronautics, 2014
- Xu et al. 2014 Xu, W.; Wang, J.; Ding, F.; Chen, X.; Nasybulin, E.; Zhang, Y.; Zhang, J.-G. Energy Environ. Sci. 2014, 7, 513–537
- Cheng et al. 2017 Cheng, X.-B.; Zhang, R.; Zhao, C.-Z.; Zhang, Q. Chem. Rev. 2017, 117, 10403–10473
- Ahmed et al. 2017 Ahmed, S. et al. J. Power Sources 2017, 367, 250–262
- Liu et al. 2015 Liu, Q.; Xu, J.; Yuan, S.; Chang, Z.; Xu, D.; Yin, Y.; Li, L.; Zhong, H.; Jiang, Y.; Yan, J.; Zhang, X. Adv. Mater. 2015, 27, 5241–5247
- Yan et al. 2014 Yan, K.; Lee, H.-W.; Gao, T.; Zheng, G.; Yao, H.; Wang, H.; Lu, Z.; Zhou, Y.; Liang, Z.; Liu, Z.; Chu, S.; Cui, Y. Nano Lett. 2014, 14, 6016–6022
- Liu et al. 2017 Liu, Y.; Lin, D.; Yuen, P. Y.; Liu, K.; Xie, J.; Dauskardt, R. H.; Cui, Y. Adv. Mater. 2017, 29, 1605531
- Aurbach et al. 1996 Aurbach, D.; Markovsky, B.; Shechter, A.; Ein-Eli, Y.; Cohen, H. J. Electrochem. Soc. 1996, 143, 3809–3820
- Hirai et al. 1994 Hirai, T.; Yoshimatsu, I.; Yamaki, J. J. Electrochem. Soc. 1994, 141, 2300–2305
- Ding et al. 2013 Ding, F.; Xu, W.; Graff, G. L.; Zhang, J.; Sushko, M. L.; Chen, X.; Shao, Y.; Engelhard, M. H.; Nie, Z.; Xiao, J.; Liu, X.; Sushko, P. V.; Liu, J.; Zhang, J.-G. J. Am. Chem. Soc. 2013, 135, 4450–4456
- Qian et al. 2015 Qian, J.; Henderson, W. A.; Xu, W.; Bhattacharya, P.; Engelhard, M.; Borodin, O.; Zhang, J.-G. Nat. Commun. 2015, 6, 6362
- Suo et al. 2013 Suo, L.; Hu, Y.-S.; Li, H.; Armand, M.; Chen, L. Nat. Commun. 2013, 4, 1481
- Lu et al. 2014 Lu, Y.; Tu, Z.; Archer, L. A. Nat. Mater. 2014, 13, 961
- Zhang et al. 2017 Zhang, X.; Cheng, X.; Chen, X.; Yan, C.; Zhang, Q. Adv. Funct. Mater. 2017, 27, 1605989
- Wang et al. 2017 Wang, D.; Zhang, W.; Zheng, W.; Cui, X.; Rojo, T.; Zhang, Q. Adv. Sci. 2017, 4, 1600168
- Zhang et al. 2014 Zhang, Y.; Qian, J.; Xu, W.; Russell, S. M.; Chen, X.; Nasybulin, E.; Bhattacharya, P.; Engelhard, M. H.; Mei, D.; Cao, R.; Ding, F.; Cresce, A. V.; Xu, K.; Zhang, J.-G. Nano Lett. 2014, 14, 6889–6896
- Khurana et al. 2014 Khurana, R.; Schaefer, J. L.; Archer, L. A.; Coates, G. W. J. Am. Chem. Soc. 2014, 136, 7395–7402
- Li et al. 2018 Li, N.; Wei, W.; Xie, K.; Tan, J.; Zhang, L.; Luo, X.; Yuan, K.; Song, Q.; Li, H.; Shen, C.; Ryan, E. M.; Liu, L.; Wei, B. Nano Lett. 2018, 18, 2067–2073
- Stone et al. 2012 Stone, G. M.; Mullin, S. A.; Teran, A. A.; Hallinan, D. T.; Minor, A. M.; Hexemer, A.; Balsara, N. P. J. Electrochem. Soc. 2012, 159, A222–A227
- Barai et al. 2017 Barai, P.; Higa, K.; Srinivasan, V. Phys. Chem. Chem. Phys. 2017, 19, 20493–20505
- Li et al. 2015 Li, J.; Ma, C.; Chi, M.; Liang, C.; Dudney, N. J. Adv. Energy Mater. 2015, 5, 1401408
- Li et al. 2019 Li, G.; Archer, L. A.; Koch, D. L. Phys. Rev. Lett. 2019, 122, 124501
- Fu et al. 2019 Fu, C.; Venturi, V.; Kim, J.; Ahmad, Z.; Ells, A. W.; Viswanathan, V.; Helms, B. A. Nat. Mater., in press, arXiv 1901.04910 2019,
- Monroe and Newman 2005 Monroe, C.; Newman, J. J. Electrochem. Soc. 2005, 152, A396–A404
- Ahmad and Viswanathan 2017 Ahmad, Z.; Viswanathan, V. Phys. Rev. Lett. 2017, 119, 056003
- Ahmad and Viswanathan 2017 Ahmad, Z.; Viswanathan, V. Phys. Rev. Materials 2017, 1, 055403
- Ahmad et al. 2018 Ahmad, Z.; Xie, T.; Maheshwari, C.; Grossman, J. C.; Viswanathan, V. ACS Cent. Sci. 2018, 4, 996–1006
- de Gennes 1974 de Gennes, P. G. The physics of liquid crystals; Clarendon Press: Oxford, 1974
- Meier et al. 1975 Meier, G.; Sackmann, E.; Grabmaier, J. G. Applications of Liquid Crystals; Springer Berlin Heidelberg, 1975
- Castellano 1983 Castellano, J. A. Mol. Cryst. Liq. Cryst. 1983, 94, 33–41
- Kahn et al. 1973 Kahn, F.; Taylor, G.; Schonhorn, H. Proc. IEEE 1973, 61, 823–828
- Zocher and Coper 1928 Zocher, H.; Coper, K. Z. Phys. Chem. 1928, 132U
- Yokoyama 1988 Yokoyama, H. Mol. Cryst. Liq. Cryst. 1988, 165, 265–316
- Kato 2010 Kato, T. Angew. Chem. Int. Ed. 2010, 49, 7847–7848
- Shimura et al. 2009 Shimura, H.; Yoshio, M.; Hamasaki, A.; Mukai, T.; Ohno, H.; Kato, T. Adv. Mater. 2009, 21, 1591–1594
- Kishimoto et al. 2005 Kishimoto, K.; Suzawa, T.; Yokota, T.; Mukai, T.; Ohno, H.; Kato, T. J. Am. Chem. Soc. 2005, 127, 15618–15623
- Gadjourova et al. 2001 Gadjourova, Z.; Andreev, Y. G.; Tunstall, D. P.; Bruce, P. G. Nature 2001, 412, 520–523
- Imrie et al. 1999 Imrie, C. T.; Ingram, M. D.; McHattie, G. S. Adv. Mater. 1999, 11, 832–834
- Zimmerman 2017 Zimmerman, M. A. Solid electrolyte high energy battery. 2017; US Patent 9,819,053
- Zimmerman and Gavrilov 2017 Zimmerman, M. A.; Gavrilov, A. B. Solid, ionically conducting polymer material, and methods and applications for same. 2017; US Patent 9,742,008
- Kerr et al. 2009 Kerr, R. L.; Miller, S. A.; Shoemaker, R. K.; Elliott, B. J.; Gin, D. L. J. Am. Chem. Soc. 2009, 131, 15972–15973
- Sakuda et al. 2015 Sakuda, J.; Hosono, E.; Yoshio, M.; Ichikawa, T.; Matsumoto, T.; Ohno, H.; Zhou, H.; Kato, T. Adv. Funct. Mater. 2015, 25, 1206–1212
- Champagne et al. 2019 Champagne, P.-L.; Ester, D.; Bhattacharya, A.; Hofstetter, K.; Zellman, C.; Bag, S.; Yu, H.; Trudel, S.; Michaelis, V. K.; Williams, V. E.; Thangadurai, V.; Ling, C.-C. J. Mater. Chem. A 2019, 7, 12201–12213
- Xu 2004 Xu, K. Chem. Rev. 2004, 104, 4303–4418
- Gray and Harrison 1971 Gray, G. W.; Harrison, K. J. Symp. Faraday Soc. 1971, 5, 54
- Jerome 1991 Jerome, B. Rep. Prog. Phys. 1991, 54, 391–451
- Zhang et al. 2015 Zhang, Y.; Li, D.; Li, Y.; Zhang, S.; Wang, M.; Li, Y. Soft Matter 2015, 11, 1762–1766
- Boden et al. 1988 Boden, N.; Bushby, R.; Clements, J.; Jesudason, M.; Knowles, P.; Williams, G. Chem. Phys. Lett. 1988, 152, 94–99
- Boden et al. 1994 Boden, N.; Borner, R. C.; Bushby, R. J.; Clements, J. J. Am. Chem. Soc. 1994, 116, 10807–10808
- Hanna 2012 Hanna, J.-I. Liquid Crystalline Semiconductors; Springer Netherlands, 2012; pp 39–64
- Tiberio et al. 2009 Tiberio, G.; Muccioli, L.; Berardi, R.; Zannoni, C. ChemPhysChem 2009, 10, 125–136
- Poletto et al. 2016 Poletto, F. S.; Montoro, S. R.; Tebaldi, M. L. In Design and Applications of Nanostructured Polymer Blends and Nanocomposite Systems; Thomas, S., Shanks, R., Chandrasekharakurup, S., Eds.; Elsevier, 2016; Chapter 3, pp 39–54
- Berreman 1972 Berreman, D. W. Phys. Rev. Lett. 1972, 28, 1683–1686
- Berreman 1973 Berreman, D. W. Mol. Cryst. Liq. Cryst. 1973, 23, 215–231
- Bouchiat and Langevin-Cruchon 1971 Bouchiat, M.; Langevin-Cruchon, D. Phys. Lett. A 1971, 34, 331–332
- Stelzer et al. 1997 Stelzer, J.; Longa, L.; Trebin, H.-R. Mol. Cryst. Liq. Cryst. Sci. Technol., Sect. A 1997, 304, 259–263
- Rapini and Papoular 1969 Rapini, A.; Papoular, M. J. Physique Coll. 1969, 30, C4–54–C4–56
- Karma and Rappel 1998 Karma, A.; Rappel, W.-J. Phys. Rev. E 1998, 57, 4323–4349
- Chen 2002 Chen, L.-Q. Annu. Rev. Mater. Res. 2002, 32, 113–140
- Boettinger et al. 2002 Boettinger, W. J.; Warren, J. A.; Beckermann, C.; Karma, A. Annu. Rev. Mater. Res. 2002, 32, 163–194
- Warren et al. 2003 Warren, J. A.; Kobayashi, R.; Lobkovsky, A. E.; Carter, W. C. Acta Mater. 2003, 51, 6035 – 6058
- Karma 2001 Karma, A. Phys. Rev. Lett. 2001, 87, 115701
- Chen et al. 2015 Chen, L.; Zhang, H. W.; Liang, L. Y.; Liu, Z.; Qi, Y.; Lu, P.; Chen, J.; Chen, L.-Q. J. Power Sources 2015, 300, 376 – 385
- Cogswell 2015 Cogswell, D. A. Phys. Rev. E 2015, 92, 011301
- Ely et al. 2014 Ely, D. R.; Jana, A.; García, R. E. J. Power Sources 2014, 272, 581 – 594
- Bazant 2013 Bazant, M. Z. Acc. Chem. Res. 2013, 46, 1144–1160
- Hong and Viswanathan 2018 Hong, Z.; Viswanathan, V. ACS Energy Lett. 2018, 3, 1737–1743
- Hong and Viswanathan 2019 Hong, Z.; Viswanathan, V. ACS Energy Lett. 2019, 4, 1012–1019
- Gaston et al. 2009 Gaston, D.; Newman, C.; Hansen, G.; Lebrun-Grandié, D. Nucl. Eng. Des. 2009, 239, 1768 – 1778
- Schwen et al. 2017 Schwen, D.; Aagesen, L.; Peterson, J.; Tonks, M. Comput. Mater. Sci. 2017, 132, 36 – 45
- Plapp 2011 Plapp, M. Phys. Rev. E 2011, 84, 031601
- Cahn and Hilliard 1959 Cahn, J. W.; Hilliard, J. E. J. Chem. Phys. 1959, 31, 688–699
- Diggle et al. 1969 Diggle, J. W.; Despic, A. R.; Bockris, J. O. J. Electrochem. Soc. 1969, 116, 1503–1514
- Monroe and Newman 2004 Monroe, C.; Newman, J. J. Electrochem. Soc. 2004, 151, A880–A886
- McMeeking et al. 2019 McMeeking, R. M.; Ganser, M.; Klinsmann, M.; Hildebrand, F. E. J. Electrochem. Soc. 2019, 166, A984–A995
- Jana and García 2017 Jana, A.; García, R. E. Nano Energy 2017, 41, 552–565
- Demus et al. 1998 Demus, D.; Goodby, J.; Gray, G. W.; Spiess, H.-W.; Vill, V. Handbook of Liquid Crystals Set; Wiley, 1998
- Zhu et al. 2019 Zhu, Y.; Pande, V.; Li, L.; Pan, S.; Wen, B.; Wang, D.; Viswanathan, V.; Chiang, Y.-M. arXiv:1903.09593 2019,
- Albertus et al. 2018 Albertus, P.; Babinec, S.; Litzelman, S.; Newman, A. Nat. Energy 2018, 3, 16–21
- Huo and Schwarzacher 2001 Huo, S.; Schwarzacher, W. Phys. Rev. Lett. 2001, 86, 256–259
- Rosso et al. 2001 Rosso, M.; Gobron, T.; Brissot, C.; Chazalviel, J.-N.; Lascaud, S. J. Power Sources 2001, 97-98, 804–806
- Tan and Ryan 2016 Tan, J.; Ryan, E. M. Int. J. Energy Res. 2016, 40, 1800–1810
- Peljo and Girault 2018 Peljo, P.; Girault, H. H. Energy Environ. Sci. 2018, 11, 2306–2309
- Pande and Viswanathan 2019 Pande, V.; Viswanathan, V. J Phys. Chem. Lett. 2019, 7031–7036
- Kahn 1973 Kahn, F. J. Appl. Phys. Lett. 1973, 22, 386–388
- Foster and Frommer 1988 Foster, J. S.; Frommer, J. E. Nature 1988, 333, 542–545
- Spong et al. 1989 Spong, J.; LaComb, L.; Dovek, M. M.; Frommer, J.; Foster, J. J. Physique 1989, 50, 2139–2146
- Pizzirusso et al. 2012 Pizzirusso, A.; Berardi, R.; Muccioli, L.; Ricci, M.; Zannoni, C. Chem. Sci. 2012, 3, 573–579
- van Anders et al. 2014 van Anders, G.; Klotsa, D.; Ahmed, N. K.; Engel, M.; Glotzer, S. C. Proc. Natl. Acad. Sci. U.S.A. 2014, 111, E4812–E4821
- Weng et al. 2015 Weng, L.; Liao, P.-C.; Lin, C.-C.; Ting, T.-L.; Hsu, W.-H.; Su, J.-J.; Chien, L.-C. AIP Adv. 2015, 5, 097218
- Lee and Clark 2001 Lee, B.-w.; Clark, N. A. Science 2001, 291, 2576–2580
- Gear et al. 2015 Gear, C.; Diest, K.; Liberman, V.; Rothschild, M. Opt. Express 2015, 23, 807
- Marcus et al. 2002 Marcus, Y.; Donald Brooke Jenkins, H.; Glasser, L. J. Chem. Soc., Dalton Trans. 2002, 2002, 3795–3798
- Pestov 2003 Pestov, S. Subvolume A · 1.03:40 - 2759: Datasheet from Landolt-Börnstein - Group VIII Advanced Materials and Technologies · Volume 5A: “Subvolume A” in Springer Materials; Springer Berlin Heidelberg, 2003; accessed 2020-04-23
- thi 1992 Thiem, J., Ed. Liquid Crystals: Transition Temperatures and Related Properties of Two-Ring Systems with Bridging Group; Springer-Verlag, 1992
See pages 1-18 of suppinfo.pdf