11email: dominic.bowman@kuleuven.be 22institutetext: Jeremiah Horrocks Institute, University of Central Lancashire, Preston PR1 2HE, UK 33institutetext: Center for Space Research, North-West University, Mafikeng Campus, Private Bag X2046, Mmabatho 2745, South Africa
Adaptive elliptical aperture photometry: a software package for high-cadence ground-based photometry††thanks: The TEA-Phot software can be downloaded from: https://bitbucket.org/DominicBowman/tea-phot/
Abstract
Context. Modern space telescopes are currently providing high-precision light curves for a large fraction of the sky, such that many new variable stars are being discovered. However, some stars have periodic variability with periods of order minutes and require high-cadence photometry to probe the physical mechanisms responsible. A cadence of less than a minute is often required to remove Nyquist ambiguities and confirm rapid variability which forces observers to obtain high-cadence ground-based photometry.
Aims. We aim to provide a modern software package to reduce ground-based photometric time series data and deliver optimised (differential) light curves. To produce high-quality light curves, which maximise the amplitude signal-to-noise ratio of short-period variability in a Fourier spectrum, we require adaptive elliptical aperture photometry as this represents a significant advantage compared to aperture photometry using circular apertures of fixed radii.
Methods. The methodology of our code and its advantages are demonstrated using high-cadence ground-based photometry from the South African Astronomical Observatory (SAAO) of a confirmed rapidly oscillating Ap (roAp) star. Furthermore, we employ our software package to search for rapid oscillations in three candidate roAp stars.
Results. We demonstrate that our pipeline represents a significant improvement in the quality of light curves, and we make it available to the community for use with different instruments and observatories. We search for and demonstrate the lack of high-frequency roAp pulsations to a limit of mmag using data in the three Ap stars HD 158596, HD 166542 and HD 181810.
Conclusions. We demonstrate the significant improvement in the extraction of short-period variability caused by high-frequency pulsation modes, and discuss the implication of null detections in three Ap stars.
Key Words.:
techniques: photometric– stars: chemically peculiar – stars: oscillations – stars: early-type – stars: individual: HD 158596; HD 166542; HD 181810; J16401 Introduction
In the study of variable stars using time series photometry, it is always the goal to strive for high-precision in both time and stellar flux. Modern telescopes and CCDs have allowed a vast array of stellar variability to be probed, and this is especially true for space telescopes such as CoRoT (Auvergne et al., 2009), Kepler (Borucki et al., 2010), and K2 (Howell et al., 2014). These missions have provided high-quality light curves with unprecedented photometric precision for hundreds of thousands of stars. However, despite the drastic increase in the number of stars with space photometry, short-period phenomena, such as rapidly oscillating stars with periods of order minutes, require a high cadence of order tens of seconds to accurately probe the variability.
Specific astrophysical examples for which high-cadence photometry is typically required include the rapidly oscillating Ap stars (roAp; Kurtz 1978, 1982; Holdsworth et al. 2018a), pulsating white dwarfs (e.g. Fontaine & Brassard 2008; Winget & Kepler 2008; Hermes et al. 2017), and pulsating sub-dwarfs (e.g. Charpinet et al. 2006; Østensen et al. 2010; Holdsworth et al. 2017). We refer the reader to Aerts et al. (2010) for a review of pulsational variability across Hertzsprung–Russell (HR) diagram and the associated time scales. Inevitably, a high cadence of order 1 min is expensive for space telescopes in terms of onboard data storage and/or downlink speeds. Therefore, this has resulted in a dearth of high-cadence photometric data available for short-period variable stars, which is particularly pertinent for the roAp stars.
To secure the necessary time series photometry of pulsating stars with a cadence of order tens of seconds, astronomers typically obtain ground-based photometry to search for, confirm and characterise short-period variability in stars caused by pulsations. However, obtaining high-quality ground-based time-series photometry remains a particularly challenging task when studying variable stars because of the various seeing timescales present in the Earth’s atmosphere. In variable star studies it is typically the amplitude signal-to-noise ratio (S/N) of a peak in a Fourier transform that should be maximised, since the pulsation frequencies and corresponding amplitudes represent the fundamental data for any subsequent analysis (Aerts et al., 2010). However, even under photometric conditions, the noise level in a Fourier spectrum and the S/N of pulsation mode frequencies depend on the data reduction and photometry pipeline. We refer the reader to Howell (2006) for a detailed discussion of CCDs and Kurtz & Martinez (2000) for the problems that can occur that affect any resultant S/N-based criterion for detecting pulsations in a light curve.
A prime example for which high-cadence ground-based photometry is often needed is for the roAp stars — see Kurtz (1982) for a review of roAp stars. In the region of the HR diagram where roAp stars are located, i.e. where the main sequence and classical instability strip intersect, there is a complex relationship amongst the physics of rotation, pulsation, binarity and magnetic fields. Approximately 10 % of these stars are classified as Ap (or Bp; CP 2) stars (Wolff, 1968; Preston, 1974; Power et al., 2007; Sikora et al., 2018), which have long rotation periods of order days, but can be as short as 0.5 d (e.g. see Adelman 2002; Mathys 2004, 2015) or longer than a century (e.g. Mathys 2015). The Ap stars host a strong large-scale magnetic field of order 1 kG (e.g. Babcock 1960; Aurière et al. 2004; Buysschaert et al. 2018), which is thought to be fossil in origin and be efficient to brake Ap stars on the pre-main sequence (Abt & Morrell, 1995; Stȩpień, 2000). The slow rotation and strong magnetic field allow atomic diffusion and gravitational settling to separate chemical elements in the outer layers of the stellar envelope, and produce surface abundance inhomogeneities which modulate the light curve as the star rotates with respect to an observer (Stibbs, 1950).
The roAp stars pulsate in high-overtone pressure (p) modes with periods that range from 4.6 to 24 min (Kurtz, 1982, 1990; Martinez et al., 1994; Alentiev et al., 2012; Smalley et al., 2015; Joshi et al., 2016; Cunha et al., 2019), and have photometric peak-to-peak light curve amplitudes as large as 34 mmag in Johnson data (Kurtz, 1990; Holdsworth et al., 2018b). Fewer than 80 roAp stars are known, so more are needed to accurately probe the observational instability region of these rare stars and understand the interior properties by means of their pulsations (see e.g., Cunha 2002; Cunha et al. 2013, 2019; Holdsworth et al. 2018c). Recently, Bowman et al. (2018) performed a systematic search for pulsations in 56 ApBp stars observed by the K2 space mission (Howell et al., 2014), and identified three of these stars, HD 158596, HD 166542 and HD 181810, as candidate roAp stars. Since the 29.5-min cadence of the K2 mission defines a Nyquist frequency of 24.47 d-1 and because low-overtone p-mode pulsations are not predicted to be excited in chemically peculiar stars with magnetic field strengths of order 1 kG (Saio, 2005, 2014), it was suggested that these isolated peaks may be Nyquist alias frequencies of high-frequency roAp pulsation modes (Bowman et al., 2018).
To definitively confirm an Ap star as a roAp, high-cadence photometry is needed, which is normally obtained using ground-based telescopes. To analyse such a data set, there have been a selection of image reduction and aperture photometry software packages made available to the astronomy community in recent decades, including DoPHOT (Schechter et al., 1993) and daophot (Stetson, 1987) and Image Reduction and Analysis Facility (IRAF) apphot package (Tody, 1986, 1993). In this paper, we describe our PYTHON adaptive elliptical aperture photometry (TEA-Phot) pipeline and demonstrate its flexibility and advantages for South African Astronomical Observatory (SAAO) photometry over other commonly used routines using fixed circular apertures in section 2. Specifically, we demonstrate the marked advantages of this approach using a known roAp star studied by Holdsworth et al. (2018c) using high-cadence ground-based photometric observations from the SAAO. In section 3, we apply our pipeline to SAAO photometry of the three candidate roAp stars HD 158596, HD 166542 and HD 181810 discussed by Bowman et al. (2018) to investigate if they exhibit high-frequency pulsation modes. Finally we conclude in section 4.
2 The TEA-Phot pipeline: adaptive elliptical aperture photometry
The current pipeline to reduce and analyse SAAO photometric time series available to observers is based on the DoPHOT software (Schechter et al., 1993), and employs IRAF (Tody, 1986, 1993) to perform image reduction and aperture photometry using circular apertures of fixed radii. Although IRAF was a pioneering software package and has been very successful within astronomy, its flexibility, suitability and accuracy in light of today’s high-precision observations is limited. For example, stellar magnitudes are not output to a high-enough precision for studying stars with pulsation mode amplitudes of order 1 mmag. Later updated options for image reduction, including for example PyRAF are available, but even this is no longer supported on the latest computer hardware at Space Telescope Science Institute (STScI; Lucas et al. 2018).
In this work, it is our goal to provide a high-quality differential photometry pipeline to the community, which in its current form is optimised for high-cadence ground-based observations of roAp stars observed at SAAO. However, it can be easily re-purposed for other scientific goals and/or modified for use with other instruments and observatories. To maximise our prospects, we have developed a customised pipeline in PYTHON for the reduction and processing of SAAO photometry utilising the functionality of the SEP111SEP: https://sep.readthedocs.io/en/v1.0.x/ module (Barbary, 2016). The SEP module makes the algorithms of the Source Extractor library (Bertin & Arnouts, 1996) available as stand-alone functions within a PYTHON environment, thus offering a great range of flexible options for performing aperture photometry. An important advantage when using SEP, whose functionality is based on the original Source Extractor software, is its ability to perform elliptical aperture photometry — see e.g., Mallonn et al. (2018) and references therein. For high-cadence ground-based photometry of pulsating stars, this is significant improvement over the standard approach to use circular apertures of fixed radii, as it takes into account the possible asymmetric affects of seeing in the atmosphere. Furthermore, SEP allows adaptive aperture photometry using ellipses, such that the optimum aperture’s dimensions can be determined for each individual CCD frame.
The flexibility of the PYTHON SEP module allowed us to incorporate it into a standalone PYTHON pipeline for reducing and extracting (differential) light curves from SAAO photometry. In subsection 2.1 we briefly outline the functionality and flexibility of our adaptive elliptical aperture photometry (TEA-Phot) pipeline, and demonstrate its advantages by comparing it to the DoPHOT pipeline (Schechter et al., 1993) using the previously-known roAp star J1640 studied by Holdsworth et al. (2018c) in subsection 2.2.
2.1 TEA-Phot pipeline overview
In its released format, our TEA-Phot pipeline is optimised for photometry using either of the two available Sutherland High Speed Optical Camera (SHOC; Coppejans et al. 2013) instruments (SHA or SHD)222SHOC documentation: http://www.saao.ac.za/science/facilities/instruments/shoc/, which output single FITS cubes for each observing block. However, other instruments that output an individual FITS file per exposure can also be used, with functionality for the STE3 CCD camera available at SAAO already included as an option when using TEA-Phot. For the following discussion, we describe the use of TEA-Phot with SHOC photometry, but the methodology is the same if used with other instruments.
For basic use, one simply has to specify the name of the FITS cube of the images from the command line:
> python TEA-Phot.py <obs> <inst> <imagecube>
where <obs>, <inst> and <imagecube> are the names of the observatory and instrument, and the filename of the image FITS cube to be analysed, respectively. The TEA-Phot code can be used with different instruments at different observatory locations, but it is currently optimised for use with the SHOC instrument at SAAO. Other optional command-line arguments are available, such as flags to perform image reduction (bias subtraction and flat fielding), sigma clipping of outliers and atmospheric extinction correction to the resultant individual star light curves. The full list of optional command line arguments and their descriptions can be found using:
> python TEA-Phot.py ––help
The TEA-Phot pipeline is user friendly and interactive as it allows the user to simply click on the MATPLOTLIB image to select the star(s) of interest. When used to also perform image reduction, individual bias and flat-field frames are extracted and combined into master bias and flat frames, respectively. Each image frame is corrected using using the standard procedure of subtracting the master bias frame and normalising by the master flat field frame. Image reduction is not necessary to run TEA-Phot, but is strongly advised for creating light curves.
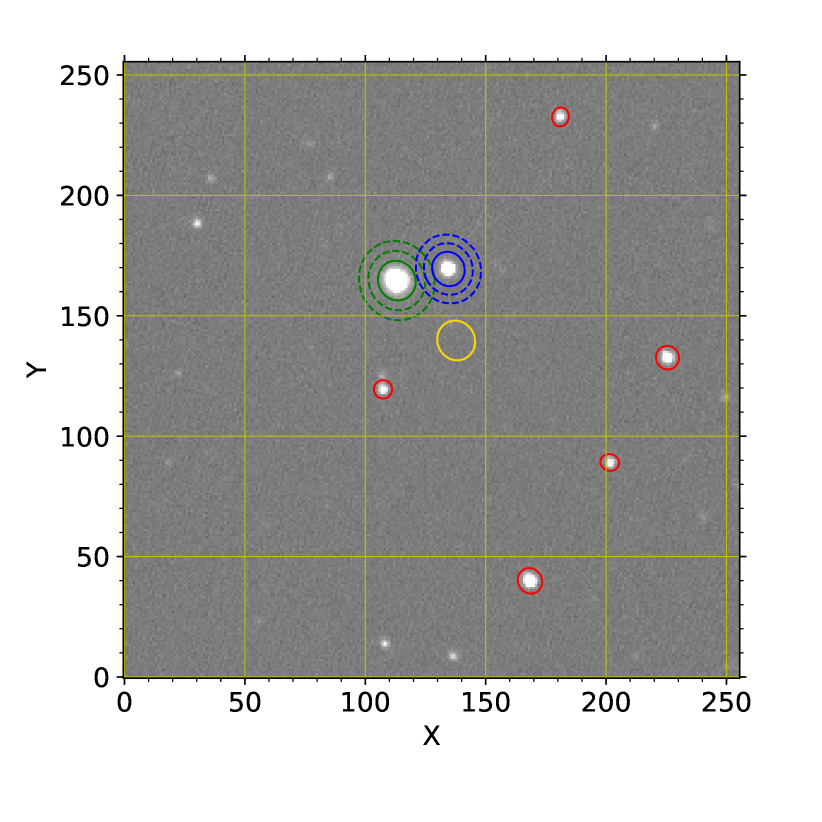
Source extraction is performed for each image using SEP with a default S/N criterion of 10, but can be defined by the user as a command-line argument. The interactive nature of the TEA-Phot pipeline allows the user to select the target and comparison stars using the first image frame in an observed FITS cube. In Fig. 1, an example of a reduced image in a given cube is provided, in which all extracted sources using S/N are indicated using red circles, and the user-selected target and comparison stars shown in green and blue circles, respectively.
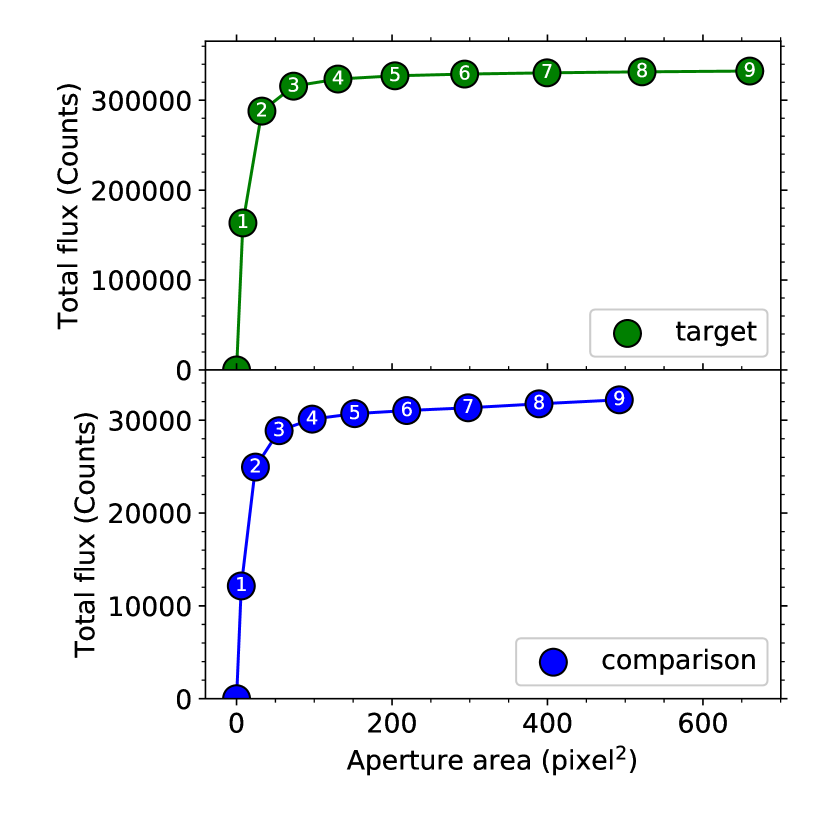
Inspired by Overcast (2010), we use the curve of growth method within TEA-Phot to determine the optimum major- and minor-axis dimensions of the elliptical apertures to be used to extract light curves. The user is able to directly visualise the appropriate aperture size using the curve of growth for the target and comparison stars, as demonstrated in Fig. 2. For example, selecting an aperture larger than the ‘fifth’ option does not significantly increase the target flux, yet does increase the sky background contribution. Of course, the choice of optimum aperture depends on the observing conditions, such as seeing, hence the need for flexibility in aperture size from frame-to-frame and from night-to-night. The user’s choice of optimum aperture size is then used as an initial input within SEP for determination of the optimum aperture in each frame and the subsequent extraction of target and comparison star light curves.
For the determination and subtraction of the sky background, two options are available for the user to choose from. The first option is to use an annulus around each star’s location, which is defined as having minimum and maximum dimensions of 1.5 and 2 times larger than a star’s optimum aperture, respectively. The second option available is to choose the location of a ‘sky star’, such that the sky background is calculated using the optimum aperture of each star but at a location on the CCD image frame in which there are no sources as chosen by the user. The latter of these two options is especially useful for crowded fields in which the annuli option may include other nearby sources. An example of the two options is shown in Fig. 1, in which the dashed-line ellipses around the target and comparison stars show the inner and outer edges of the annuli sky background option, whereas the yellow ellipse shows the user-defined location of a ‘sky-star’ to be used for the sky background measure.
Aperture photometry is performed for all image frames with the final time series results output as an ascii file. The output includes the midpoint of each exposure, which are the Coordinated Universal Time (UTC) time stamps provided in the FITS header converted into Heliocentric Julian Date (HJD), and also to Barycentric Dynamical Time (TDB) expressed in Barycentric Julian Date (BJD). The conversion into HJD (UTC) and BJD (TDB) is done using the PYTHON ASTROPY libraries (Astropy Collaboration et al., 2013) using the date, time, stellar co-ordinates and the observatory’s latitude, longitude and altitude, which are also provided in the FITS header. The differential (target comparison), and individual target and comparison star light curves are also provided. It is possible to include an atmospheric extinction and airmass correction to the individual target and comparison stars’ light curves if desired by the user, but this requires the extinction coefficient for the filter and observatory site to be known a priori and included as a command-line input.
2.2 Application to the roAp star J1640
Here we use the published case study of the roAp star J1640 (2MASS 16400299-0737293) to demonstrate the significant advantages of our TEA-Phot pipeline over the current DoPHOT pipeline available to the community to reduce SAAO photometry. The roAp star J1640 has a spectral type of A7 Vp SrEu(Cr) and its high-amplitude dominant pulsation mode has a frequency of d-1 (i.e. period of 9.5 min). This star was previously studied by Holdsworth et al. (2018c), to which we refer the reader for a more detailed analysis of the complete SAAO light curve.
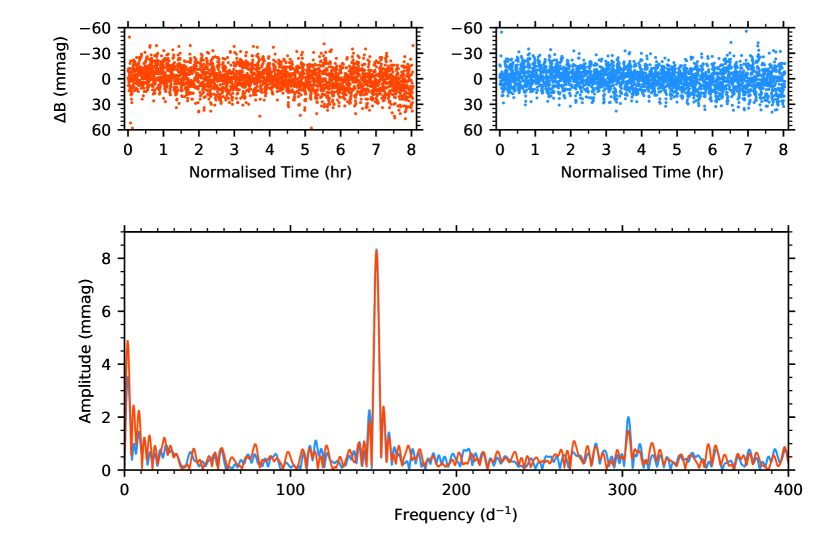
In our comparison, we compare the light curves extracted by the DoPHOT and our TEA-Phot pipelines using 8-hr of data obtained on 12 June 2017, which consists of 2859 individual frames with an exposure time of 10 sec that were obtained using the SHA SHOC instrument mounted on the SAAO 1.0-m telescope. The extracted DoPHOT and TEA-Phot light curves are shown in red and blue in the top-left and top-right panels of Fig. 3, respectively. We calculated Discrete Fourier transforms (DFT; Deeming 1975; Kurtz 1985) and show the amplitude spectra of the light curves obtained from the DoPHOT and TEA-Phot pipelines in the bottom panel of Fig. 3, in which the amplitude and therefore S/N of the dominant pulsation mode frequency (and its harmonic at 303.86 d-1) is significantly higher when using our TEA-Phot pipeline. The noise level at high-frequency is also lower in the amplitude spectrum obtained using TEA-Phot because of the smaller variance in the light curve. We provide the S/N values of the pulsation mode and its harmonic in both data sets in Table 1 as well as the root mean square (RMS) of the extracted light curves, demonstrating the improved values obtained using the TEA-Phot pipeline compared to DoPHOT.
We obtain similarly improved results for all available SAAO photometry of the roAp star J1640 when using TEA-Phot, especially when observing in non-photometric conditions. The improvement in the ability to extract high-frequency pulsation modes in the light curves of variable stars extracted using our pipeline is clear, with adaptive elliptical apertures better suited to compensate for non-negligible atmospheric seeing that varies on time scales similar to the short integration times of order 10 sec needed to study high-frequency pulsators.
| Pipeline | Amplitude S/N | RMS | |
|---|---|---|---|
| pulsation | harmonic | (mmag) | |
| DoPHOT | 7.09 | 2.54 | 20.85 |
| TEA-Phot | 7.38 | 3.81 | 12.77 |
2.3 Source code
We are committed to open science, and have made our PYTHON TEA-Phot pipeline publicly available via https://bitbucket.org/DominicBowman/TEA-Phot/. The code is fully documented and is provided under a GPL v3 license. Its dependencies are ASTROPY (Astropy Collaboration et al., 2013), MATPLOTLIB (Hunter, 2007), and SEP (Barbary, 2016), all of which are freely available and installable using the conda and pip package managers.
We encourage those who are interested for scientific (and outreach) purposes to use our code for extracting light curves obtained by a SHOC instrument at SAAO. Furthermore, our code can be used a starting point for extracting light curves from other instruments, but a word of caution is that each instrument, telescope and observatory have different keywords and file formats, therefore it is necessary to modify the code where appropriate to overcome this. In a future release, the TEA-Phot code will be expanded to include other instruments, such as the MAIA three-channel imager mounted on the 1.2-m Flemish Mercator telescope on La Palma (Raskin et al., 2013).
3 Results: ground-based photometry of three candidate roAp stars discovered by K2
In this section, we investigate the hypothesis made by Bowman et al. (2018) that the three ApBp stars, HD 158596, HD 166542 and HD 181810, are candidate roAp stars. The known properties of these stars are given in Table 2, which includes their and magnitudes from SIMBAD, spectral type from Renson & Manfroid (2009), rotation period from Bowman et al. (2018) and polar magnetic field strength (if available) from Buysschaert et al. (2018). The claim that each of HD 158596, HD 166542 and HD 181810 was a candidate roAp star was made based on the detection of a significant isolated peak in the amplitude spectra of K2 data of these stars, which was interpreted to be a possible Nyquist alias frequency of a high-frequency roAp pulsation mode. However, the Nyquist frequency of these K2 data was only 24.47 d-1, which was insufficient to confirm the origin of these frequencies in these stars.
To confirm if HD 158596, HD 166542 and HD 181810 are roAp stars, we obtained high-cadence ground-based data using the SHOC instrument (Coppejans et al., 2013) mounted on the 1.0-m telescope at the Sutherland site of the SAAO in May and June of 2018. A Johnson filter was used for all observations as the S/N ratio of roAp pulsations is largest within this wavelength range (Medupe & Kurtz, 1998). A summary of the observations used in our analysis is given in Table 3. Each star was observed for a minimum of 2 hr with an exposure time of either 5 or 10 sec, such that the resultant Nyquist frequency is much higher than the frequency range of roAp pulsation modes — i.e. d-1.
We applied our TEA-Phot pipeline, binned all the data of the same star to have the same exposure time and calculated amplitude spectra of the extracted light curve to search for high-frequency roAp pulsation modes. Since ground-based photometry obtained over more than a single night suffers from significant aliasing effects and since a time series from only a single night has a poor frequency resolution, we are unable to probe low-frequency variability (defined here as d-1) in the data of our stars. Owing to the oblique pulsator model associated with roAp stars (Kurtz, 1982), amplitude modulation of pulsations occurs during the rotation period. This is because the pulsation axis is typically inclined to the rotation axis in the strongly-magnetic roAp stars, such that as the star rotates the pulsations are viewed from different orientations. Therefore, multi-night observations of candidate roAp stars are useful to ensure a confident (non)detection of high-frequency pulsation modes.
| Star name | mag | mag | Spectral Type | Rotation Period (d) | (kG) |
|---|---|---|---|---|---|
| HD 158596 | 9.17 | 8.94 | B9 Si | 1.8 | |
| HD 166542 | 9.92 | 9.94 | A0 Si | ||
| HD 181810 | 10.65 | 10.66 | A0 EuCrSr |
| Star name | UTC | BJD – 2450000 | Length | Data points | Exp time | Observer |
|---|---|---|---|---|---|---|
| (min) | (sec) | |||||
| HD 158596 | 2018-05-09 | 8248.4139 | 120.8 | 1421 | 5 | SBP |
| 2018-05-15 | 8254.4405 | 120.7 | 1430 | 5 | SBP | |
| 2018-06-13 | 8283.3179 | 146.9 | 862 | 10 | DLH | |
| 2018-06-16 | 8286.4243 | 220.4 | 1178 | 10 | DLH | |
| 2018-06-19 | 8289.5888 | 23.0 | 136 | 10 | DLH | |
| HD 166542 | 2018-05-09 | 8248.5008 | 120.8 | 1428 | 5 | SBP |
| 2018-06-13 | 8283.5881 | 112.3 | 433 | 15 | DLH | |
| HD 181810 | 2018-05-13 | 8252.4765 | 310.1 | 3624 | 5 | SBP |
| 2018-05-15 | 8254.5273 | 59.8 | 718 | 5 | SBP | |
| 2018-06-13 | 8283.4242 | 167.1 | 635 | 15 | DLH |
3.1 HD 158596
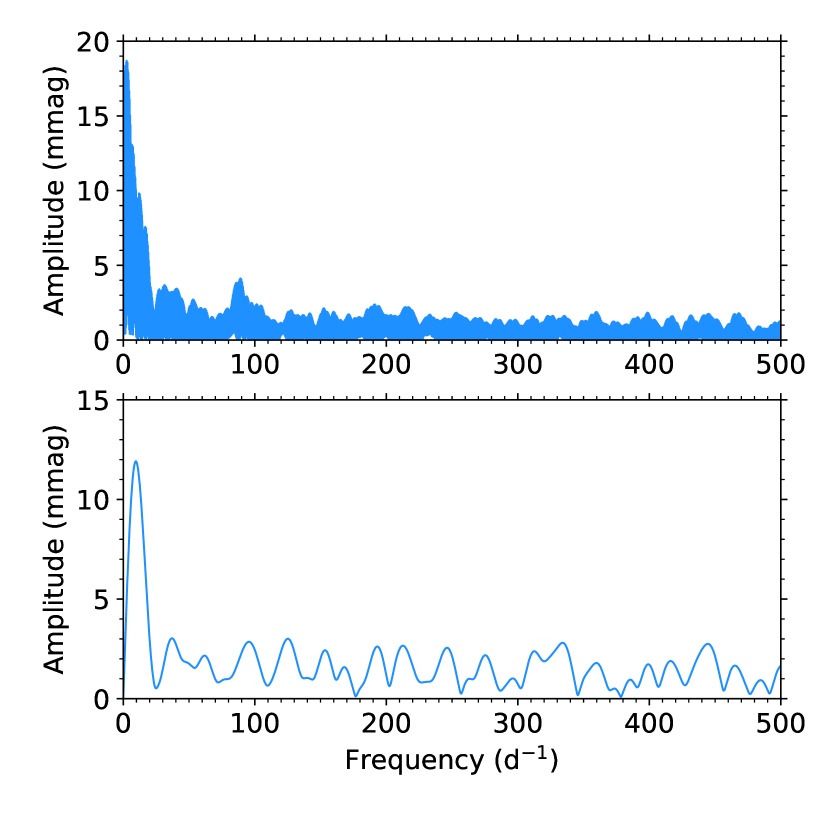
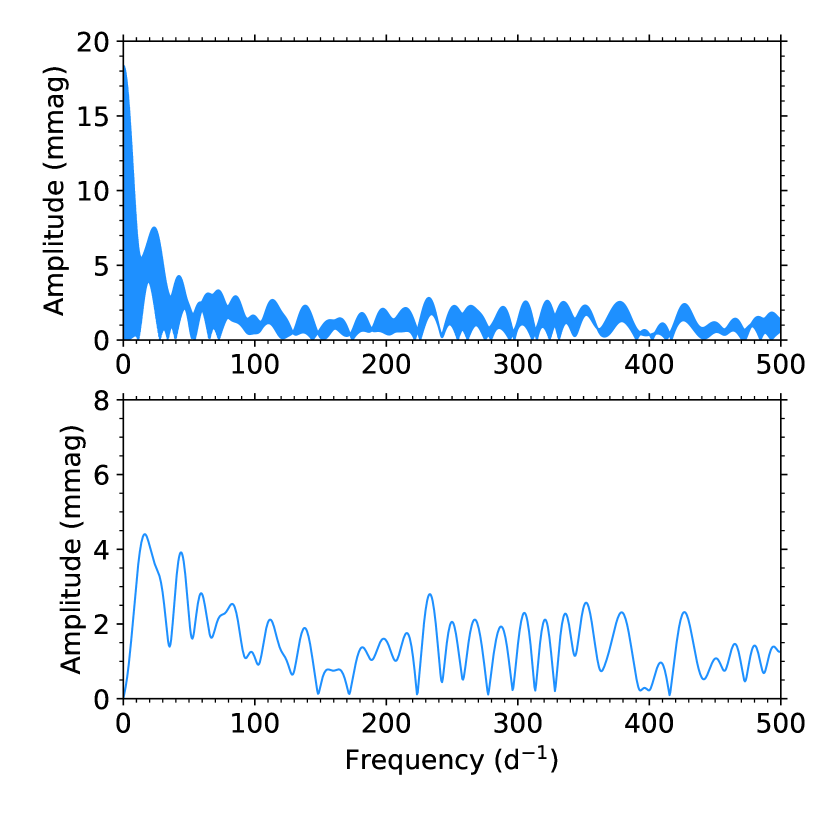
Using K2 mission data from campaigns 9 and 11, Bowman et al. (2018) determined a rotation period of d for HD 158596, and detected a significant isolated peak with a frequency of d-1 in the amplitude spectrum. HD 158596 is also known to be a magnetic star with a large-scale magnetic field strength of 1.8 kG (Buysschaert et al., 2018). The amplitude spectrum of the follow-up data obtained with SHOC/SAAO of HD 158596 is shown in Fig. 4. Our data allow us to rule out high-amplitude high-frequency roAp pulsation modes in this star to a limit of 1 mmag. It is known that there is a nearby star at a separation of 0.3 arcsec to HD 158596 (ESA, 1997; Fabricius et al., 2002), but Buysschaert et al. (2018) found no evidence of a secondary star in high-resolution and high-S/N spectroscopy.
The follow-up high-cadence SHOC/SAAO data of HD 158596 span several days and cover a reasonable fraction of the rotation phase. From the lack of significant high-frequency variability above the noise level of 1 mmag, we conclude a null detection of high-frequency roAp pulsation modes in HD 158596. This implies that the frequency of d-1 found by Bowman et al. (2018) in K2 photometry is unlikely to be a Nyquist alias frequency of a high-frequency roAp pulsation mode frequency, and is possibly an intrinsic pulsation mode frequency or caused by a contaminating background object.
3.2 HD 166542
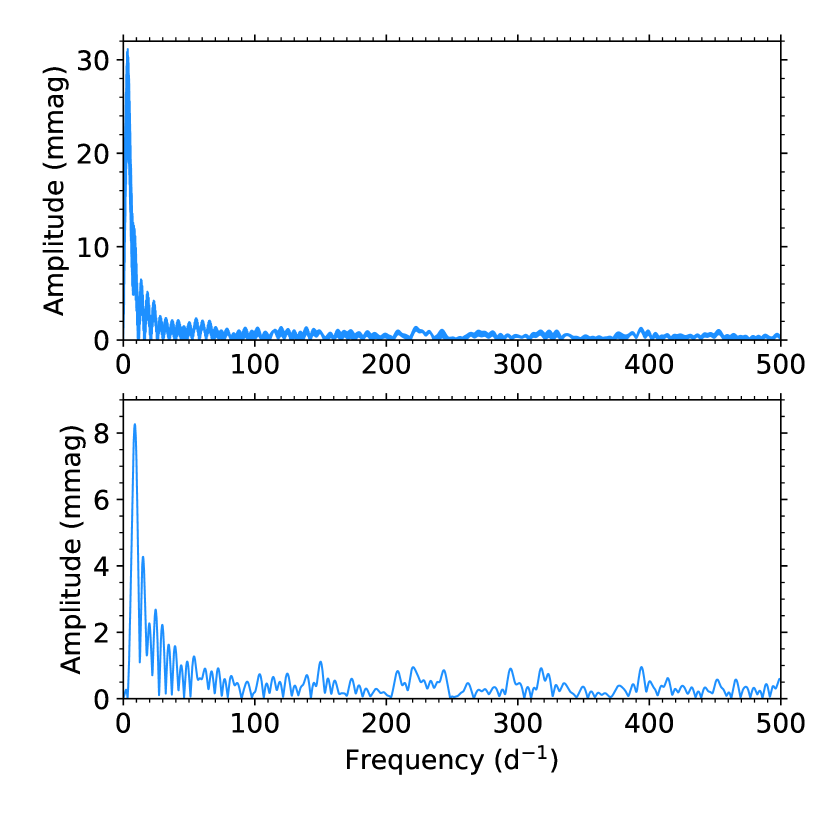
For HD 166542, Bowman et al. (2018) reported the first measurement of the rotation period of this star to be d using 70 d of K2 mission data from campaign 9, and found a significant isolated frequency peak at d-1 in its amplitude spectrum. The amplitude spectrum of the follow-up data obtained with SHOC/SAAO of HD 166542 is shown in Fig. 5. These data allow us to rule out high-frequency roAp pulsation modes in this star to a limit of mmag. Thus, the frequency of d-1 found by Bowman et al. (2018) in K2 photometry is unlikely to be a Nyquist alias frequency, and may be caused by contamination from a background object or represent an intrinsic pulsation mode frequency.
3.3 HD 181810
HD 181810 was observed during campaign 7 of the K2 space mission, which Bowman et al. (2018) used to measure the rotation period of this star to be d, but also detected a significant isolated frequency peak at d-1 in its amplitude spectrum. The amplitude spectrum of the follow-up data obtained with SHOC/SAAO of HD 181810 is shown in Fig. 6. These data allow us to rule out high-frequency roAp pulsation modes in this star to a limit of mmag. Since our observations cover a reasonable fraction of the rotation phase, we can exclude the detection of high-amplitude roAp pulsation modes in HD 181810. This null detection of suggests that the frequency of d-1 found by Bowman et al. (2018) is not a Nyquist alias frequency and might be caused by a contaminating background object or represent an intrinsic pulsation mode frequency.
4 Discussion
In this paper, we have presented our interactive adaptive aperture photometry pipeline, TEA-Phot, which is written in PYTHON and employs the functionality of the SEP package (Barbary, 2016) to create customised light curves for the detection of pulsation modes in high-cadence ground-based photometry obtained with the SHOC instruments at SAAO. We have demonstrated that the use of adaptive elliptical apertures is preferable to circular apertures of fixed radii using the case study of the roAp star J1640, and the significant impact on the extraction of pulsation mode frequencies and amplitudes in variable stars. This is particularly true for observations obtained in non-photometric conditions. A significant advantage of the consequential lower average noise levels in the amplitude spectra of pulsating stars is that fewer observations are needed to detect high-amplitude pulsation modes.
The application of our TEA-Phot pipeline to three candidate roAp stars, HD 158596, HD 166542 and HD 181810, using high-cadence ground-based data from the SHOC instrument mounted on 1.0-m telescope at SAAO yielded no detectable roAp pulsation modes in these stars at the noise level of order 1 mmag. Therefore, our results indicate that the low-frequency peaks discovered in the K2 mission data of these Ap stars are not Nyquist alias frequencies of roAp pulsation modes. On the other hand, if the frequencies detected by Bowman et al. (2018) represent intrinsic pulsation modes then these ApBp stars pose an interesting challenge to pulsation theory since low overtone p modes are not expected to be excited in the presence of a strong large-scale magnetic field (Saio, 2005, 2014).
Currently the TESS mission (Ricker et al., 2015) is obtaining high-precision and high-cadence (i.e. 2-min) light curves of a subset of all known ApBp stars. TESS is observing almost the entire sky (i.e. deg) and is providing light curves that range in length from 27 d up to 1 yr in its two continuous ecliptic viewing zones. Therefore, TESS is providing a rich and unique data set for finding new roAp stars and probing the largely unknown physics of how pulsation, rotation and strong magnetic fields interact within ApBp stars. We refer the reader to David-Uraz et al. (2019) and Cunha et al. (2019) for recent TESS results of rotation and pulsation detected in ApBp stars in the southern ecliptic hemisphere using TESS mission data. For stars located in the ecliptic plane, however, the K2 mission data will remain an important legacy sample of variable stars for the foreseeable future. With the increased chance of finding more candidate roAp stars at an increasing rate, it is more important than ever before to have an efficient pipeline such as TEA-Phot available to analyse follow-up observations of these stars, particularly for stars that are not observed by the nominal TESS mission at a high cadence.
Acknowledgements.
The authors are grateful to Stephen B. Potter for obtaining some of the observations used in this work, and DMB would like to thank Jels Boulangier for useful discussions. The research leading to these results has received funding from the European Research Council (ERC) under the European Union’s Horizon 2020 research and innovation programme (grant agreement No. 670519: MAMSIE). DLH acknowledges the Science and Technology Facilities Council (STFC) via grant ST/M000877/1 and the National Research Foundation (NRF) of South Africa. This research has made use of the SIMBAD database, operated at CDS, Strasbourg, France; the SAO/NASA Astrophysics Data System; and the VizieR catalogue access tool, CDS, Strasbourg, France. This research has made use of ASTROPY, a community-developed core PYTHON package for Astronomy (Astropy Collaboration et al., 2013); and MATPLOTLIB, a PYTHON library for publication quality graphics (Hunter, 2007); and SEP, a source extraction and aperture photometry package (Barbary, 2016) based on the Source Extractor package (Bertin & Arnouts, 1996).References
- Abt & Morrell (1995) Abt, H. A. & Morrell, N. I. 1995, ApJS, 99, 135
- Adelman (2002) Adelman, S. J. 2002, Baltic Astronomy, 11, 475
- Aerts et al. (2010) Aerts, C., Christensen-Dalsgaard, J., & Kurtz, D. W. 2010, Asteroseismology (Springer)
- Alentiev et al. (2012) Alentiev, D., Kochukhov, O., Ryabchikova, T., et al. 2012, MNRAS, 421, L82
- Astropy Collaboration et al. (2013) Astropy Collaboration, Robitaille, T. P., Tollerud, E. J., et al. 2013, A&A, 558, A33
- Aurière et al. (2004) Aurière, M., Silvester, J., Wade, G. A., et al. 2004, in IAU Symposium, Vol. 224, The A-Star Puzzle, ed. J. Zverko, J. Ziznovsky, S. J. Adelman, & W. W. Weiss, 633–636
- Auvergne et al. (2009) Auvergne, M., Bodin, P., Boisnard, L., et al. 2009, A&A, 506, 411
- Babcock (1960) Babcock, H. W. 1960, ApJ, 132, 521
- Barbary (2016) Barbary, K. 2016, Journal of Open Source Software, 1, 58
- Bertin & Arnouts (1996) Bertin, E. & Arnouts, S. 1996, A&AS, 117, 393
- Borucki et al. (2010) Borucki, W. J., Koch, D., Basri, G., et al. 2010, Science, 327, 977
- Bowman et al. (2018) Bowman, D. M., Buysschaert, B., Neiner, C., et al. 2018, A&A, 616, A77
- Buysschaert et al. (2018) Buysschaert, B., Neiner, C., Martin, A. J., et al. 2018, MNRAS, 478, 2777
- Charpinet et al. (2006) Charpinet, S., Silvotti, R., Bonanno, A., et al. 2006, A&A, 459, 565
- Coppejans et al. (2013) Coppejans, R., Gulbis, A. A. S., Kotze, M. M., et al. 2013, PASP, 125, 976
- Cunha (2002) Cunha, M. S. 2002, MNRAS, 333, 47
- Cunha et al. (2013) Cunha, M. S., Alentiev, D., Brandão, I. M., & Perraut, K. 2013, MNRAS, 436, 1639
- Cunha et al. (2019) Cunha, M. S., Antoci, V., Holdsworth, D. L., et al. 2019, MNRAS, 487, 3523
- David-Uraz et al. (2019) David-Uraz, A., Neiner, C., Sikora, J., et al. 2019, MNRAS, 487, 304
- Deeming (1975) Deeming, T. J. 1975, Ap&SS, 36, 137
- ESA (1997) ESA, ed. 1997, ESA Special Publication, Vol. 1200, The HIPPARCOS and TYCHO catalogues. Astrometric and photometric star catalogues derived from the ESA HIPPARCOS Space Astrometry Mission
- Fabricius et al. (2002) Fabricius, C., Høg, E., Makarov, V. V., et al. 2002, A&A, 384, 180
- Fontaine & Brassard (2008) Fontaine, G. & Brassard, P. 2008, PASP, 120, 1043
- Hermes et al. (2017) Hermes, J. J., Gänsicke, B. T., Kawaler, S. D., et al. 2017, ApJS, 232, 23
- Holdsworth et al. (2018a) Holdsworth, D. L., Cunha, M. S., Shibahashi, H., Kurtz, D. W., & Bowman, D. M. 2018a, MNRAS, 480, 2976
- Holdsworth et al. (2018b) Holdsworth, D. L., Kurtz, D. W., Saio, H., et al. 2018b, MNRAS, 473, 91
- Holdsworth et al. (2017) Holdsworth, D. L., Østensen, R. H., Smalley, B., & Telting, J. H. 2017, MNRAS, 466, 5020
- Holdsworth et al. (2018c) Holdsworth, D. L., Saio, H., Bowman, D. M., et al. 2018c, MNRAS, 476, 601
- Howell (2006) Howell, S. B. 2006, Handbook of CCD Astronomy (Cambridge University Press)
- Howell et al. (2014) Howell, S. B., Sobeck, C., Haas, M., et al. 2014, PASP, 126, 398
- Hunter (2007) Hunter, J. D. 2007, Computing in Science and Engineering, 9, 90
- Joshi et al. (2016) Joshi, S., Martinez, P., Chowdhury, S., et al. 2016, A&A, 590, A116
- Kurtz (1978) Kurtz, D. W. 1978, ApJ, 221, 869
- Kurtz (1982) Kurtz, D. W. 1982, MNRAS, 200, 807
- Kurtz (1985) Kurtz, D. W. 1985, MNRAS, 213, 773
- Kurtz (1990) Kurtz, D. W. 1990, ARA&A, 28, 607
- Kurtz & Martinez (2000) Kurtz, D. W. & Martinez, P. 2000, Baltic Astronomy, 9, 253
- Lucas et al. (2018) Lucas, R. A., Desjardins, T. D., & STScI ACS (Advanced Camera for Surveys) Team. 2018, in American Astronomical Society Meeting Abstracts, Vol. 232, American Astronomical Society Meeting Abstracts #232, 119.03
- Mallonn et al. (2018) Mallonn, M., Herrero, E., Juvan, I. G., et al. 2018, A&A, 614, A35
- Martinez et al. (1994) Martinez, P., Kurtz, D. W., & van Wyk, F. 1994, MNRAS, 271, 305
- Mathys (2004) Mathys, G. 2004, in IAU Symposium, Vol. 215, Stellar Rotation, ed. A. Maeder & P. Eenens, 270
- Mathys (2015) Mathys, G. 2015, in Astronomical Society of the Pacific Conference Series, Vol. 494, Physics and Evolution of Magnetic and Related Stars, ed. Y. Y. Balega, I. I. Romanyuk, & D. O. Kudryavtsev, 3
- Medupe & Kurtz (1998) Medupe, R. & Kurtz, D. W. 1998, MNRAS, 299, 371
- Østensen et al. (2010) Østensen, R. H., Silvotti, R., Charpinet, S., et al. 2010, MNRAS, 409, 1470
- Overcast (2010) Overcast, W. C. 2010, Master’s thesis, University of Tennessee
- Power et al. (2007) Power, J., Wade, G. A., Hanes, D. A., Aurier, M., & Silvester, J. 2007, in Physics of Magnetic Stars, ed. I. I. Romanyuk, D. O. Kudryavtsev, O. M. Neizvestnaya, & V. M. Shapoval, 89–97
- Preston (1974) Preston, G. W. 1974, ARA&A, 12, 257
- Raskin et al. (2013) Raskin, G., Bloemen, S., Morren, J., et al. 2013, A&A, 559, A26
- Renson & Manfroid (2009) Renson, P. & Manfroid, J. 2009, A&A, 498, 961
- Ricker et al. (2015) Ricker, G. R., Winn, J. N., Vanderspek, R., et al. 2015, Journal of Astronomical Telescopes, Instruments, and Systems, 1, 014003
- Saio (2005) Saio, H. 2005, MNRAS, 360, 1022
- Saio (2014) Saio, H. 2014, in IAU Symposium, Vol. 301, IAU Symposium, ed. J. A. Guzik, W. J. Chaplin, G. Handler, & A. Pigulski, 197–204
- Schechter et al. (1993) Schechter, P. L., Mateo, M., & Saha, A. 1993, PASP, 105, 1342
- Sikora et al. (2018) Sikora, J., Wade, G. A., & Power, J. 2018, Contributions of the Astronomical Observatory Skalnate Pleso, 48, 87
- Smalley et al. (2015) Smalley, B., Niemczura, E., Murphy, S. J., et al. 2015, MNRAS, 452, 3334
- Stȩpień (2000) Stȩpień, K. 2000, A&A, 353, 227
- Stetson (1987) Stetson, P. B. 1987, PASP, 99, 191
- Stibbs (1950) Stibbs, D. W. N. 1950, MNRAS, 110, 395
- Tody (1986) Tody, D. 1986, in Proc. SPIE, Vol. 627, Instrumentation in astronomy VI, ed. D. L. Crawford, 733
- Tody (1993) Tody, D. 1993, in Astronomical Society of the Pacific Conference Series, Vol. 52, Astronomical Data Analysis Software and Systems II, ed. R. J. Hanisch, R. J. V. Brissenden, & J. Barnes, 173
- Winget & Kepler (2008) Winget, D. E. & Kepler, S. O. 2008, ARA&A, 46, 157
- Wolff (1968) Wolff, S. C. 1968, PASP, 80, 281