Nonlinear Electrophoresis of Highly Charged Nonpolarizable Particles
Abstract
Nonlinear field dependence of electrophoresis in high fields has been investigated theoretically, yet experimental studies have failed to reach consensus on the effect. In this work, we present a systematic study on the nonlinear electrophoresis of highly charged submicron particles in applied electric fields of up to several . First, the particles are characterized in the low-field regime at different salt concentrations and the surface charge density is estimated. Subsequently, we use microfluidic channels and video tracking to systematically characterize the nonlinear response over a range of field strengths. Using velocity measurements on the single particle level, we prove that nonlinear effects are present at electric fields and surface charge densities that are accessible in practical conditions. Finally, we show that nonlinear behavior leads to unexpected particle trapping in channels.
Electrophoresis has been widely used for sensing, filtration, manipulation, and the separation of molecules and particles, particularly recently using micro- and nanofluidic devices Yukimoto et al. (2013); Liu et al. (2014); Wu et al. (2014); Angeli et al. (2015). On these length scales, the applied electric field may reach kV/cm because the confinement focuses the electric field, even with a moderate applied voltage to the system. The electrophoretic velocity of a rigid nonpolarizable sphere in the limit of low zeta potential and low applied electric field is
| (1) |
where and are the permittivity and viscosity of the fluid, respectively Masliyah and Bhattacharjee (2006). is Henry’s function, where and are the Debye length and particle radius, respectively Henry (1931); Dukhin (1993). Within a canonical model (homogeneous and , no specific ion-surface interactions, no hydrodynamic slip) and using a low zeta potential (), calculated using Eq. (1) corresponds to the homogeneous electrostatic potential at the particle surface. In real systems, however, the zeta potentials of particles may exceed , in which case the direct action of the electric field on the double layer as well as the advection of ions by the flow result in an asymmetric shape of both coion and counterion clouds, as schematically shown in Fig. 1(a) O’Brien and White (1978); Grosse (2015). For intermediate values of , the double-layer distortion, known as relaxation effect, leads to a nonlinear dependence of on O’Brien and White (1978); Dukhin (1993); Squires (2016). Therefore, in case , the model including relaxation effect O’Brien (1983); Chen and Keh (1992) needs to be used instead of Eq. (1) to extract the surface potential that reproduces within the canonical model.
In addition, the relaxation effect is field dependent, complicating the interpretation of experimental results even further (see Supplemental Material SM ). This nonlinear effect, which is different from the nonlinear electrokinetics found for polarizable particles Bazant and Squires (2004), is not well understood for intermediate to large in contrast to the case of small in nonpolar electrolytes Stotz (1978); Thomas et al. (2008); Gacek and Berg (2012); Guo et al. (2013); Strubbe et al. (2013); Khair (2018). Theoretical analyses have predicted that the electrophoretic velocity becomes nonlinear to the applied field at a moderate to high field Shilov et al. (2003); Schnitzer et al. (2013); Schnitzer and Yariv (2014); Sherwood and Ghosal (2018). However, a well-controlled experiment in this regime has been lacking. Indeed, there are experimental reports showing that particle electrophoretic velocity is linear Kumar et al. (2006) and nonlinear Shilov et al. (2003) under similar conditions. Even for the nonlinear case, the properties of particles were not clearly characterized. Moreover, the zeta potential was reported to be severalfold lower than the value used for fitting one of the models, and the difference was then attributed to the divergence of the slip plane from the actual particle surface Mishchuk (2010); Mishchuk and Barinova (2011). Here, we resolve the conflicting results found in the literature by systematic experiments in combination with detailed simulations.
We used high-speed video tracking to study the nonlinear electrophoresis of highly charged particles in microfluidic channels. We characterized particle mobility with different salt concentration, and subsequently measured the nonlinear electrophoretic velocity under high field up to . The experimental data were compared with the values obtained with coupled Stokes-Poisson-Nernst-Planck (SPNP) simulations, showing that high field particle electrophoresis experiments can be quantitatively explained with our SPNP model. We also demonstrate that particles can be trapped in the channel at high fields due to this nonlinear effect in combination with the electro-osmotic flow resulting from the channel wall.
Microfluidic channels were made out of polydimethylsiloxane (PDMS) cast onto microfabricated molds Pagliara et al. (2011). The mold for the “wide” channel (, , ) was fabricated with SU-8 photoresist. The “narrow” channels (, , ) were made by depositing platinum onto silicon substrates with focused ion beam. The access channels for wide and narrow channels were made out of SU-8 () and AZ 9260 (), respectively. The bottom glass slides were coated with a thin layer of PDMS, then plasma bonded to the PDMS channels Deshpande et al. (2016). The overview of our experimental system is shown in Fig. 1(b). The channels were connected to the two reservoirs through access channels and tubes. The reservoir height was adjusted to eliminate the pressure difference between both sides before each experiment. Voltage ( ) was applied through Ag/AgCl electrodes connected to a source measure unit (Keithley 2450). The particle motion was recorded at maximum and tracked by custom-written software after experiments. Conversion coefficients from voltage to field inside a channel, , were calibrated for each microfluidic chip design by measuring the current through the system, as , where and are the conductivity of the electrolyte and total channel cross sectional area, respectively.
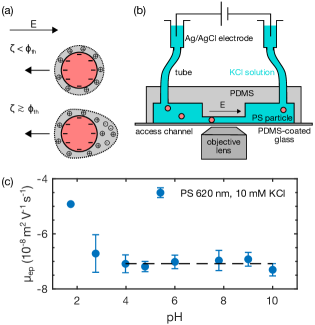
The particles used in our experiments were polystyrene (PS, from Polysciences and Bangs Labs) and poly(methyl methacrylate) (PMMA, from Microparticles GmbH). Bulk electrophoretic mobilities were measured with Laser Doppler Microelectrophoresis (Zetasizer Nano ZSP, Malvern). All particles were diluted in KCl solution to the final concentration (volume fraction) of approximately , , and – for narrow and wide microchannel experiments and Laser Doppler Microelectrophoresis measurement, respectively. In Fig. 1(c), the electrophoretic mobility of PS particles in KCl is plotted as a function of pH. The pH was adjusted by adding small quantities of KOH or HCl. The observed negative mobility of is due the negative surface charge associated with the sulfate end groups on PS, originating from the decomposition of the initiator used during particle synthesis (initiator: K2S2O8, end group: -OSOK+). The reported values vary but typically are in the range of several tens of mC/m2. As the dissociation constant of sulfate end groups is below 2 Elimelech and Omelia (1990); Midmore et al. (1996); Behrens and Grier (2001), no significant change in electrophoretic mobility was observed for pH 4. We decided that no buffer was necessary in the following experiments, and pH values were all kept in the range of 6–9.
Coupled SPNP simulations were performed using a finite element method (COMSOL Multiphysics ver. 4.4). The particle was fixed in a large enough space () with open boundary conditions. The surface charge density was set at a constant value on the particle surface. The electro-osmotic flow generated far away from the particle was used to calculate the electrophoretic mobility of the particle Masliyah and Bhattacharjee (2006). More details on the simulations can be found in Supplemental Material SM .
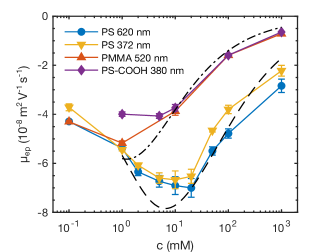
In Fig. 2, the electrophoretic mobilities of various particles measured with Laser Doppler Micro-electrophoresis are plotted as a function of KCl concentration . The field used in the measurement was below (); thus nonlinear effects were negligible. The electrophoretic mobility curves of PS particles display negative peaks at about , in a good agreement to previous literature values for other highly charged particles Elimelech and Omelia (1990); Antonietti and Vorwerg (1997); Borkovec et al. (2000); Kobayashi and Sasaki (2014). The negative peak of PMMA particles, which had lower charge density, was found at around .
In order to estimate the surface charge density from these data, we fitted the approximate model including the relaxation effect by Chen and Keh Chen and Keh (1992) (valid for ) to the experimental data with a surface charge density as the only fitting parameter (see Supplemental Material for more details SM ). The extracted surface charge densities of PS , PS , PMMA , and PS-COOH are , , , and , respectively. Note that these surface charge densities are not necessarily the bare surface charge densities because we do not take into account the details of the surface, such as local viscosity and permittivity. However, since these values are employed in the numerical SPNP simulations to predict the magnitude of the nonlinearity using the canonical model of electrophoresis, this treatment is fully consistent.
Having established an estimate for the surface charge density, the particle velocity in high fields was characterized using a microfluidic channel. Hydrodynamic and electric wall effects were negligible in this wide channel since the channel height and width were large enough Chiu and Keh (2016). The two types of particles (PS and PMMA ) were suspended in KCl. Previously, two methods have been proposed to extract particle mobility in a high field: using asymmetric oscillating fields Shilov et al. (2003); Barany (2009); Mishchuk (2010); Mishchuk and Barinova (2011) and measuring bulk flow rate from the hydraulic height in a reservoir Kumar et al. (2006); Youssefi and Diez (2016). Here we used microfluidic channels and dc voltage to directly monitor particle motions, which allowed us to acquire nonlinear electrophoretic velocity on the single particle level precisely, without transient behavior, bubble generation, and pressure flow.
In Fig. 3(a), the measured particle velocity (, the sum of the electrophoretic and electro-osmotic velocities) is plotted as a function of an applied field with the maximum field strength , which is equivalent to (for ). The solid and dashed lines are the linear fits to the first two points of each data set. Clearly, the particle velocities increased superlinearly with the applied field for both types of particles. Figure 3(b) shows the nonlinear components of the particle velocity , which was extracted by subtracting the linear components obtained from linear fits shown in Fig. 3a. This process is important because it is difficult to measure precisely in situ. The solid lines are the nonlinear component of the SPNP simulation results with the actual size of the particle and the surface charge densities of nd , respectively. The simulations showed a good agreement with the experiments. This implies that we can predict the magnitude of nonlinearity well with the estimated surface charge density.
Our results contradict the earlier report by Kumar et al. Kumar et al. (2006), where they concluded that the electrophoretic velocity was always linear. Our results are qualitatively in line with the measurements performed by Shilov et al. Shilov et al. (2003) and Barany Barany (2009) using oscillating fields. However, a direct comparison is difficult because neither the zeta potential nor surface charge density of their particles were reported. Instead, the model in Shilov et al. (2003) was fitted to the experimental data with zeta potential as a fitting parameter. Mishchuk et al. used the same approach and reported that their measured particle zeta potential () was significantly lower than the zeta potential estimated using Shilov’s model () Shilov et al. (2003), and attributed this difference to the divergence of the slip plane and particle surface Mishchuk (2010); Mishchuk and Barinova (2011). However, the zeta potential was estimated using Eq. (1) even at low salt concentrations ( ). Thus, it is likely that this value was underestimated compared to the actual zeta potential. In contrast, our results suggest that nonlinear effects can be accurately predicted by taking into account the relaxation effect with extracted surface charge densities.
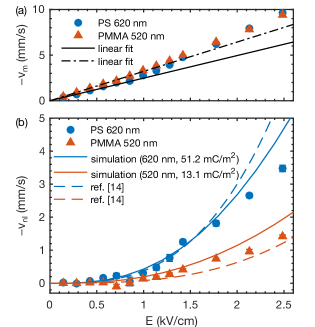
For the analytical approach in the thin double layer limit and small Péclet number, the first two allowed terms by symmetry are described as , where both coefficients and are independent of Schnitzer et al. (2013); Schnitzer and Yariv (2014). The coefficients obtained from our results (PS and PMMA ) in Fig. 3(b) were approximately and , respectively. Based on the model proposed by Schnitzer et al. Schnitzer and Yariv (2014); SM for small Dukhin and Péclet numbers, the nonlinear coefficients for these parameters are and , as also shown in Fig. 3(b). Interestingly, although the model is based on the assumption of small Dukhin and Péclet numbers, it still shows a reasonable agreement to our experimental data . These results imply that the two particles with similar can be still separated by the difference of .
Last, we discovered that this nonlinear electric field dependence allows for voltage-controlled particle trapping in confinement. Here, slightly lower charged particles (PS-COOH ) in KCl were introduced into PDMS-glass-bonded narrow channels. The electro-osmotic flow was stronger than the electrophoresis of the particles; thus the particles were always transported by the electro-osmotic flow at low fields. The mobility of particle inside the channel () was at (). Interestingly, at a sufficiently high field ( or ), the particles were trapped at the inside or entrance of the channel, as shown in Fig. 4(a). The number of trapped particles increased with the applied field from 3, 5, 7 for 2.6, 3.5, and ( 1.9, 2.6, and 3.3), respectively. No particle entered the channel at . When trapping occurred inside the channel, trap-and-release cascade motion was observed: when one additional particle was entering, the initially trapped particle was released. The spatiotemporal diagram of this cascade motion is shown in Fig. 4b.
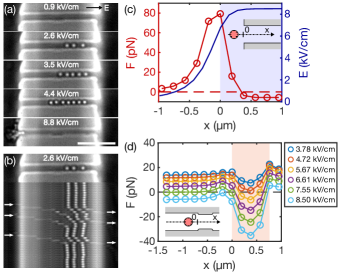
In order to understand this trapping mechanism, we numerically simulated the force landscape near the entrance of the channel, as shown in Fig. 4(c). Force was calculated as the sum of electrostatic and hydrodynamic forces on the fixed particle (). The surface charge density of the channel wall was estimated to be from the particle velocity inside the channel at low fields. The confinement ratio was set . The force landscape turns from positive to negative near the entrance because of the sharp increase of the field. We further investigated the effect of small inhomogeneity on force landscapes by adding a small constriction in the channel ( in height, in length) in Fig. 4(d). At intermediate fields (, , and ), force reversal was observed near the constriction inside the channel, indicating that particles can be trapped inside the channel. The force landscapes decrease with increasing fields, resulting in larger trapping forces. The larger trapping forces allow for a larger number of trapped particles, before the outermost particle is pushed out of the trapping site by steric or hydrodynamic interaction with an incoming particle. At a sufficiently high field (), no particle can be trapped inside the channel since the force landscape is negative at the entrance, preventing particles from entering the channel. Clearly, the trapping strength is dependent on the characteristics of the constrictions, such as height and length, yet our numerical results capture the trapping and cascade motions observed in experiments. This trapping effect due to nonlinear field dependence of electrophoresis is intriguing, as it is clearly different in origin from well characterized dielectrophoretic trapping Kang et al. (2006).
We experimentally proved that highly charged nonconducting particles exhibit nonlinear electrophoretic velocity at high fields. Our results include measurements ranging from the low field to the high field limit spanning several orders of magnitude in salt concentration. Our high-speed video tracking results allowed for extracting the particle mobility in channels and comparing the results with the numerical models. We found a near quantitative agreement with numerical simulations using finite element methods. Finally we showed that the nonlinear mobility can give rise to unexpected particle trapping that is controlled by the applied field. Our results are relevant for various fluidic systems and processes, including filtration, separation, and manipulation.
Acknowledgements.
We thank Dr. Ory Schnitzer for his suggestion and Dr. Alice Thorneywork for her comments on the manuscript. We also thank Bangs Lab and microParticles GmbH for providing us the information on the formation of microparticles. S.T. is supported by Nakajima Foundation Scholarship and John Lawrence Cambridge Trust International Scholarship. K.M. and U.F.K. acknowledge funding from an ERC consolidator grant (DesignerPores 647144).References
- Yukimoto et al. (2013) N. Yukimoto, M. Tsutsui, Y. H. He, H. Shintaku, S. Tanaka, S. Kawano, T. Kawai, and M. Taniguchi, “Tracking single-particle dynamics via combined optical and electrical sensing,” Sci. Rep. 3, 1855 (2013).
- Liu et al. (2014) S. Liu, Y. Zhao, J. W. Parks, D. W. Deamer, A. R. Hawkins, and H. Schmidt, “Correlated electrical and optical analysis of single nanoparticles and biomolecules on a nanopore-gated optofluidic chip,” Nano Lett. 14, 4816–4820 (2014).
- Wu et al. (2014) H. Wu, H. Liu, S. Tan, J. Yu, W. Zhao, L. Wang, and Q. Liu, “The estimation of field-dependent conductance change of nanopore by field-induced charge in the translocations of aunps-dna conjugates,” J. Phys. Chem. C 118, 26825–26835 (2014).
- Angeli et al. (2015) E. Angeli, A. Volpe, P. Fanzio, L. Repetto, G. Firpo, P. Guida, R. Lo Savio, M. Wanunu, and U. Valbusa, “Simultaneous electro-optical tracking for nanoparticle recognition and counting,” Nano Lett. 15, 5696–5701 (2015).
- Masliyah and Bhattacharjee (2006) J. H. Masliyah and S. Bhattacharjee, Electrokinetic and Colloid Transport Phenomena (Wiley-Interscience, Hoboken, 2006).
- Henry (1931) D. C. Henry, “The cataphoresis of suspended particles part i - the equation of cataphoresis,” Proc. R. Soc. Lond. A 133, 106–129 (1931).
- Dukhin (1993) S. S. Dukhin, “Non-equilibrium electric surface phenomena,” Adv. Colloid Interface Sci. 44, 1–134 (1993).
- O’Brien and White (1978) R. W. O’Brien and L. R. White, “Electrophoretic mobility of a spherical colloidal particle,” J. Chem. Soc., Faraday Trans. 2 74, 1607–1626 (1978).
- Grosse (2015) C. Grosse, “Out of equilibrium ion distribution around a suspended particle undergoing electrophoretic motion,” Colloids Surf. A 467, 207–210 (2015).
- Squires (2016) T. M. Squires, “Particles in electric fields,” in Fluids, Colloids and Soft Materials: An Introduction to Soft Matter Physics, edited by A. Fernandez‐Nieves and A. M. Puertas (John Wiley & Sons, Inc., New York, 2016) pp. 59–79.
- O’Brien (1983) R. W. O’Brien, “The solution of the electrokinetic equations for colloidal particles with thin double layers,” J. Colloid Interface Sci. 92, 204–216 (1983).
- Chen and Keh (1992) S. B. Chen and H. J. Keh, “Axisymmetric electrophoresis of multiple colloidal spheres,” J. Fluid. Mech. 238, 251–276 (1992).
- (13) See Supplemental Material at [url] for [the explanation on nonlinearity in electrophoresis, the detail of numerical simulation, the analytical models of the electrophoretic mobility and the nonlinear term in high fields], which includes Refs. Wiersema et al. (1966); Dukhin (1993); Bonthuis and Netz (2012); O’Brien and White (1978); Chen and Keh (1992); Dukhin (1991); Schnitzer and Yariv (2012); Chiu and Keh (2016); Schnitzer and Yariv (2014).
- Schnitzer and Yariv (2014) O. Schnitzer and E. Yariv, “Nonlinear electrophoresis at arbitrary field strengths: small-dukhin-number analysis,” Phys. Fluids 26, 122002 (2014).
- Chiu and Keh (2016) H. C. Chiu and H. J. Keh, “Electrophoresis of a colloidal sphere with double-layer polarization in a microtube,” Microfluid. Nanofluid. 20, 64 (2016).
- Wiersema et al. (1966) P. H. Wiersema, A. L. Loeb, and J. Th. G. Overbeek, “Calculation of the electrophoretic mobility of a spherical colloid particle,” J. Colloid Interface Sci. 22, 78–99 (1966).
- Bonthuis and Netz (2012) D. J. Bonthuis and R. R. Netz, “Unraveling the combined effects of dielectric and viscosity profiles on surface capacitance, electro-osmotic mobility, and electric surface conductivity,” Langmuir 28, 16049–59 (2012).
- Dukhin (1991) S. S. Dukhin, “Electrophoresis at large peclet numbers,” Adv. Colloid Interface Sci. 36, 219–248 (1991).
- Schnitzer and Yariv (2012) O. Schnitzer and E. Yariv, “Macroscale description of electrokinetic flows at large zeta potentials: nonlinear surface conduction,” Phys. Rev. E 86, 021503 (2012).
- Bazant and Squires (2004) M. Z. Bazant and T. M. Squires, “Induced-charge electrokinetic phenomena: theory and microfluidic applications,” Phys. Rev. Lett. 92, 066101 (2004).
- Stotz (1978) S. Stotz, “Field dependence of the electrophoretic mobility of particles suspended in low-conductivity liquids,” J. Colloid Interface Sci. 65, 118–130 (1978).
- Thomas et al. (2008) J. C. Thomas, K. L. Hanton, and B. J. Crosby, “Measurement of the field dependent electrophoretic mobility of surface modified silica/aot suspensions,” Langmuir 24, 10698–701 (2008).
- Gacek and Berg (2012) M. M. Gacek and J. C. Berg, “Investigation of surfactant mediated acid-base charging of mineral oxide particles dispersed in apolar systems,” Langmuir 28, 17841–5 (2012).
- Guo et al. (2013) Q. Guo, J. Lee, V. Singh, and S. H. Behrens, “Surfactant mediated charging of polymer particles in a nonpolar liquid,” J. Colloid Interface Sci. 392, 83–89 (2013).
- Strubbe et al. (2013) F. Strubbe, F. Beunis, T. Brans, M. Karvar, W. Woestenborghs, and K. Neyts, “Electrophoretic retardation of colloidal particles in nonpolar liquids,” Phys. Rev. X 3, 021001 (2013).
- Khair (2018) A. S. Khair, “Strong deformation of the thick electric double layer around a charged particle during sedimentation or electrophoresis,” Langmuir 34, 876–885 (2018).
- Shilov et al. (2003) V. Shilov, S. Barany, C. Grosse, and O. Shramko, “Field-induced disturbance of the double layer electro-neutrality and non-linear electrophoresis,” Adv. Colloid Interface Sci. 104, 159–173 (2003).
- Schnitzer et al. (2013) O. Schnitzer, R. Zeyde, I. Yavneh, and E. Yariv, “Weakly nonlinear electrophoresis of a highly charged colloidal particle,” Phys. Fluids 25, 052004 (2013).
- Sherwood and Ghosal (2018) J. D. Sherwood and S. Ghosal, “Nonlinear electrophoresis of a tightly fitting sphere in a cylindrical tube,” J. Fluid. Mech. 843, 847–871 (2018).
- Kumar et al. (2006) A. Kumar, E. Elele, M. Yeksel, B. Khusid, Z. Y. Qiu, and A. Acrivos, “Measurements of the fluid and particle mobilities in strong electric fields,” Phys. Fluids 18, 123301 (2006).
- Mishchuk (2010) N. A. Mishchuk, “Concentration polarization of interface and non-linear electrokinetic phenomena,” Adv. Colloid Interface Sci. 160, 16–39 (2010).
- Mishchuk and Barinova (2011) N. A. Mishchuk and N. O. Barinova, “Theoretical and experimental study of nonlinear electrophoresis,” Colloid J. 73, 88–96 (2011).
- Pagliara et al. (2011) S. Pagliara, C. Chimerel, R. Langford, D. G. Aarts, and U. F. Keyser, “Parallel sub-micrometre channels with different dimensions for laser scattering detection,” Lab Chip 11, 3365–8 (2011).
- Deshpande et al. (2016) S. Deshpande, Y. Caspi, A. E. C. Meijering, and C. Dekker, “Octanol-assisted liposome assembly on chip,” Nat. Commun. 7, 10447 (2016).
- Elimelech and Omelia (1990) M. Elimelech and C. R. Omelia, “Effect of electrolyte type on the electrophoretic mobility of polystyrene latex colloids,” Colloid Surface 44, 165–178 (1990).
- Midmore et al. (1996) B. R. Midmore, G. V. Pratt, and T. M. Herrington, “Evidence for the validity of electrokinetic theory in the thin double layer region,” J. Colloid Interface Sci. 184, 170–4 (1996).
- Behrens and Grier (2001) S. H. Behrens and D. G. Grier, “The charge of glass and silica surfaces,” J. Chem. Phys. 115, 6716–6721 (2001).
- Antonietti and Vorwerg (1997) M. Antonietti and L. Vorwerg, “Examination of the atypical electrophoretic mobility behavior of charged colloids in the low salt region using the o’brian-white theory,” Colloid. Polym. Sci. 275, 883–887 (1997).
- Borkovec et al. (2000) M. Borkovec, S. H. Behrens, and M. Semmler, “Observation of the mobility maximum predicted by the standard electrokinetic model for highly charged amidine latex particles,” Langmuir 16, 5209–5212 (2000).
- Kobayashi and Sasaki (2014) M. Kobayashi and A. Sasaki, “Electrophoretic mobility of latex spheres in mixture solutions containing mono and divalent counter ions,” Colloids Surf. A 440, 74–78 (2014).
- Barany (2009) S. Barany, “Electrophoresis in strong electric fields,” Adv. Colloid. Interfac. 147–148, 36–43 (2009).
- Youssefi and Diez (2016) M. R. Youssefi and F. J. Diez, “Ultrafast electrokinetics,” Electrophoresis 37, 692–698 (2016).
- Kang et al. (2006) K. H. Kang, X. C. Xuan, Y. J. Kang, and D. Q. Li, “Effects of dc-dielectrophoretic force on particle trajectories in microchannels,” J. Appl. Phys. 99, 064702 (2006).