Evolution of ONeMg Core in Super-AGB Stars towards Electron-Capture Supernovae: Effects of Updated Electron-Capture Rate
Abstract
Stars with evolve to form a strongly degenerate ONeMg core. When the core mass becomes close to the Chandrasekhar mass, the core undergoes electron captures on 24Mg and 20Ne, which induce the electron-capture supernova (ECSN). In order to clarify whether the ECSN leads to a collapse or thermonuclear explosion, we calculate the evolution of an star from the main sequence until the oxygen ignition in the ONeMg core. We apply the latest electron-capture rate on 20Ne including the second forbidden transition, and investigate how the location of the oxygen ignition (center or off-center) and the distribution depend on the input physics and the treatment of the semiconvection and convection. The central density when the oxygen deflagration is initiated, , can be significantly higher than that of the oxygen ignition thanks to the convection, and we estimate . We perform two-dimensional simulations of the flame propagation to examine how the final fate of the ONeMg core depends on the distribution and . We find that the deflagration starting from leads to a collapse (thermonuclear explosion). Since our estimate of exceeds this critical value, the ONeMg core is likely to collapse, although further studies of the convection and semiconvection before the deflagration are important.
1 Introduction
A non-rotating solar-metallicity star with the zero-age-main-sequence mass () in the range of forms a strongly degenerate oxygen-neon-magnesium (ONeMg) core after the 2nd dredge up of the He layer (Nomoto, 1984). Subsequently, the ONeMg core grows its mass through the H-He double shell burning and the star evolves along the super-asymptotic giant branch (SAGB) in the HR diagram. During the SAGB evolution, the H-rich envelope is losing its mass by various mechanisms such as a dust-driven wind, Mira-like pulsation, etc. (see a review by Höfner & Olofsson, 2018). The fate of these stars is either the formation of an ONeMg white dwarf (WD) if almost all H-rich envelope is lost for , or the electron-capture supernova (ECSN) if the ONeMg core mass reaches near the Chandrasekhar limit () for (Nomoto et al., 1979; Miyaji et al., 1980; Nomoto, 1984; Jones et al., 2013; Takahashi et al., 2013; Nomoto et al., 2013; Doherty et al., 2015). In the latter case, the ONeMg core undergoes various electron-capture and URCA processes.
Initiated by heating due to electron capture on , the oxygen ignition takes place in the central region . Here the ignition is defined as the stage where the nuclear energy generation rate exceeds the thermal neutrino losses. We denote the central density at the oxygen ignition as . Subsequently, oxygen burning grows into the thermonuclear runaway (when the timescale of temperature rise gets shorter than the dynamical timescale), and forms an oxygen deflagration wave behind which nuclear statistical equilibrium (NSE) is realized at temperature K. We denote the central density when the oxygen deflagration starts as , which may be larger than if the convective energy transport after the oxygen ignition is efficient.
Further evolution of the ONeMg core depends on the competition between the nuclear energy release by the propagating oxygen deflagration wave and the reduction of the degeneracy pressure due to electron capture in the NSE ash behind the deflagration wave (Nomoto & Kondo, 1991; Timmes & Woosley, 1992; Jones et al., 2016; Leung & Nomoto, 2019a).
Recent multi-dimensional simulations of the oxygen-deflagration have shown that the result of the above competition depends sensitively on the parameterized . If is higher than a certain critical density , the core collapses to form a neutron star (NS) because of the electron capture (Fryer et al., 1999; Kitaura et al., 2006; Radice et al., 2017). If , on the other hand, thermonuclear energy release dominates to induce the partial explosion of the ONeMg core (Jones et al., 2016).
For the critical density, and have been obtained by two-dimensional (2D) (Nomoto & Leung, 2017a; Leung & Nomoto, 2019a; Leung et al., 2019) and three-dimensional (3D) (Jones et al., 2016) hydrodynamical simulations, respectively. We should note that there still exists a big uncertainty in the treatment of the propagation of the oxygen deflagration (Timmes & Woosley, 1992), as well as the electron-capture rates of the NSE composition (Seitenzahl et al., 2009) to obtain .
We should also note that is subject to uncertainties involved in the calculation of the final stages of the ONeMg core evolution (see below). is currently evaluated in the range of (Schwab et al., 2015, 2017a; Takahashi et al., 2019).
The uncertainties in the core evolution include: (1) the growth rate of the degenerate ONeMg core mass, which gives the rate of core contraction and compressional heating rate. This is determined by thermal pulses of He shell burning and the 3rd dredge-up, which require quite a lot of computational efforts. (2) Rates of URCA processes of and , which cool down the core. (3) Electron-capture rates on and (Iben, 1978; Jones et al., 2013; Schwab et al., 2015, 2017a). (4) The initial abundances of (Gutiérrez et al., 2005) and residual (Schwab & Rocha, 2019) in the ONeMg core. (5) Treatment of the criterion for the convective stability (Paxton et al., 2018).
Most of the weak rates for these processes are theoretically calculated with the reliable -shell model until recently (Toki et al., 2013; Martínez-Pinedo et al., 2014) and provided with either analytic formulae or tables. However, there is still an uncertainty in the strength of the second-forbidden transition of and , which affects substantially (Schwab et al., 2015).
Electron-capture processes not only reduce the electron number fraction () but also heat the core through the energy deposition from -rays as well as distort the electron distribution function (e.g., Miyaji et al., 1980). Such heating makes the electron-capture front over-stable according to the Ledoux criterion and in the region of semiconvection (Miyaji & Nomoto, 1987). Including semiconvection prescription proposed in Spruit (1992), Takahashi et al. (2019) found , while without any convection Schwab et al. (2017a) obtained . Apart from altering , convection may enlarge the initial size of oxygen flame and change inside it, which can greatly affect the subsequent hydrodynamical behavior (Leung et al., 2019).
The newest electron-capture rate of 20Ne including the second-forbidden transition (Kirsebom et al., 2018; Suzuki et al., 2019) can strongly affect how fast 20Ne is converted to 20F and the corresponding energy deposition. Such a heat source can alter the temperature profile and the convective structure of the core prior to the oxygen deflagration. So far there has not been much discussion on how this updated nuclear physics input affects the final fate of SAGB stars. Therefore, we calculated the detailed late-phase evolution of SAGB stars and modeled the subsequent propagation of the oxygen deflagration wave.
The structure of this paper is as follows. In Section 2, we present the evolutionary path of SAGB stars until the onset of the oxygen ignition, with the new weak rates and different convection criteria. In Section 3, we use 2D hydrodynamical simulations to model the oxygen deflagration phase through the collapse or explosion. We also discuss the dependence of the outcomes on the stellar evolution and other physical inputs. We summarize our results in Section 4.
2 Evolution of SAGB Stars
2.1 Methods
We evolve a non-rotating solar-metallicity star with starting from the main-sequence phase, and follow the formation and growth of the degenerate ONeMg core until the ignition of oxygen burning, using Modules for Experiments in Stellar Astrophysics (MESA; Paxton et al., 2011, 2013, 2015, 2018, 2019), revision 8118. Until the formation of the ONeMg core, we use the MESA inlist of Jones et al. (2013). In short, the initial metallicity is , the mixing-length parameter 1.73 and the overshooting parameter at all convective boundaries with the exception of at the base of burning convective shells. Mass loss includes the Reimers prescription (Reimers, 1975) for the RGB phase with and the Blöcker prescription (Bloecker, 1995) with during the AGB phase. One difference is that we use the MESA nuclear reaction network sagb_NeNa_MgAl.net consisting of 22 isotopes to cover the H, He and C burning phases (Farmer et al., 2015). We add the important nuclear reaction to produce the URCA cooling element (Kippenhahn et al., 2012, p. 203).
The modeling of the thermally pulsing AGB phase is computationally very expensive and numerical difficulties for modeling the thermal pulse and high temperature hydrogen ingestion make the calculation of the whole star up to the oxygen ignition impossible with current MESA (Schwab & Rocha, 2019). Therefore, when the degenerate ONeMg core is formed, we remove the envelope with an artificial mass loss rate (). Nuclear burning during this phase is switched off for numerical simplicity. The resulting ONeMg core has a thin hot CO layer and is evolved to cool down until matter can be accreted. We checked that the cooling time does not affect the following evolution.
We model the ONeMg core growth phase until the oxygen ignition by assuming a constant mass accretion rate and the same accreted composition as the surface layer. The accretion rate is set to be or to account for the uncertainties involved in the H-He double shell burning and the associated third dredge-up of the He layer (Doherty et al., 2017). The nuclear network further includes the URCA processes of 23NaNe, 25MgNa and 25NaNe, and the electron-capture chains 24MgNaNe and 20NeFO by using the state-of-the-art rate tables (provided by Toki et al., 2013; Suzuki et al., 2016). We consider the rate for the second forbidden transition of 20NeF (Suzuki et al., 2019) as discussed in §2.2. The calculation is terminated when oxygen ignites in the mass zone with the maximum nuclear energy generation rate. Oxygen ignition is defined as when the nuclear energy generation rate by oxygen burning exceeds the thermal neutrino losses.
2.2 Electron-capture Rate of 20Ne
Here, we discuss the electron-capture rates on 20Ne used in the present work, especially focusing on the forbidden transition, 20Ne (0) 20F (2). Possible important roles of the forbidden transition in electron capture on 20Ne was pointed out in Martínez-Pinedo et al. (2014). While the experimental transition rate was not well determined and only the lower limit of the log ft value was given for the second-forbidden -decay transition 20F (2) 20Ne (0), the transition was taken to be an allowed Gamow-Teller transition with (GT) corresponding to the lower limit value of log ft =10.5; ft =6147/(GT). But this prescription using a constant strength is an approximation.
Here, we treat the forbidden transition 20Ne (0) 20F (2) properly, and evaluate the electron-capture rates by using the multipole expansion method (O’Connell et al., 1972; Walecka, 1975, 1995). An explicit formula for the electron-capture rate for finite density and temperature is given, for example, in Paar et al. (2009) and Fantina et al. (2012). For a 0+ 2+ transition, there are contributions from Coulomb, longitudinal and electric transverse terms induced by weak vector current as well as axial magnetic term induced by weak axial-vector current with multipolarity . Among them, about 60 contributions come from the Coulomb and longitudinal terms. The transition strength becomes electron energy dependent in contrast to the case of the prescription assuming an allowed transition. Note that the transition strengths or shape factors in forbidden transitions are energy dependent in general.
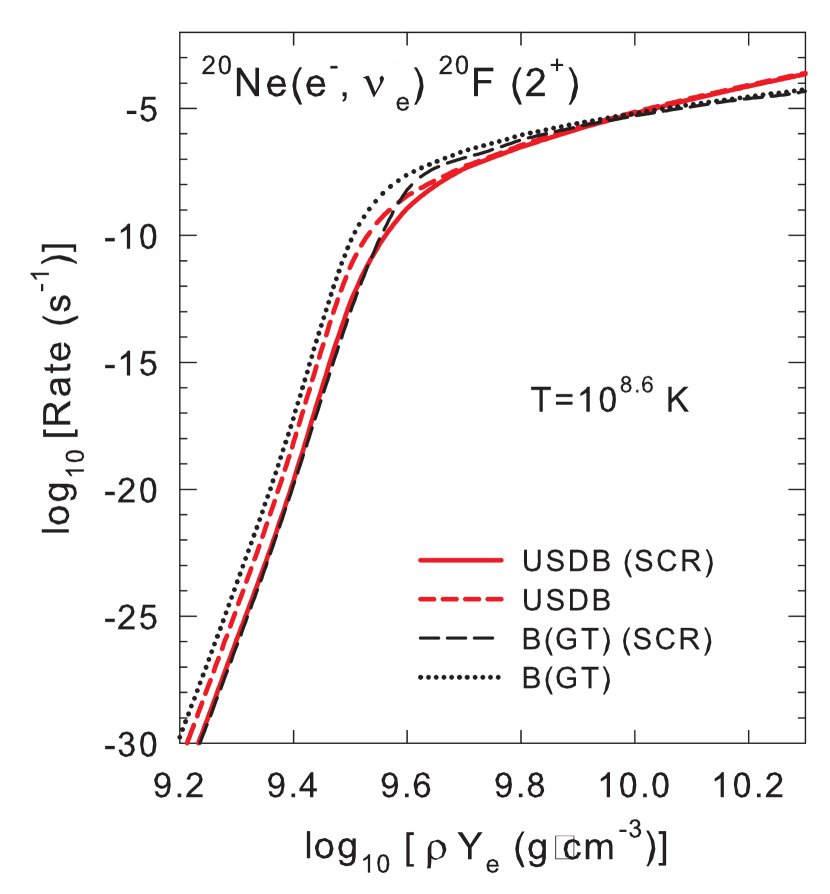
Calculated electron-capture rates for the forbidden transition obtained with the USDB Hamiltonian (Brown & Richter, 2006) with and without the Coulomb effects are shown in Figure 1 for log . Screening effects on both electrons and ions are taken into account for the Coulomb effects (Juodagalvis et al., 2010; Toki et al., 2013; Suzuki et al., 2016). Here, the quenching factor for the axial-vector coupling constant is taken to be (Richter et al., 2008). The Coulomb effects shift the electron-capture rates toward the higher density region due to an increase of the Q-value.
Recently, a new measurement for the -decay 20F (2) 20Ne (0) has been carried out, and the rate is determined to be log ft = 10.470.11 (Kirsebom et al., 2018), which is very close to the lower limit value log ft =10.5. Calculated rates obtained as an allowed transition with a (GT) value corresponding to log ft =10.47 are also shown in Figure 1. The rates obtained with a constant (GT) are found to be enhanced (reduced) compared with those with the USDB at log10(/g cm-3) () 9.9 in case without the Coulomb effects. In case with the Coulomb effects, the former rates are enhanced compared with the latter at 9.6 log10(/g cm-3) 9.9 though the difference is smaller. These tendencies are due to the difference in the electron energy dependence of the transition strength between the two methods. The density dependence of the calculated rates with USDB by the multipole expansion method derived from energy dependent transition strength should be considered as more reliable than that obtained assuming an allowed transition. The Coulomb effects are non-negligible and the rates with the Coulomb effects obtained with USDB are recommended to be used in astrophysical calculations.
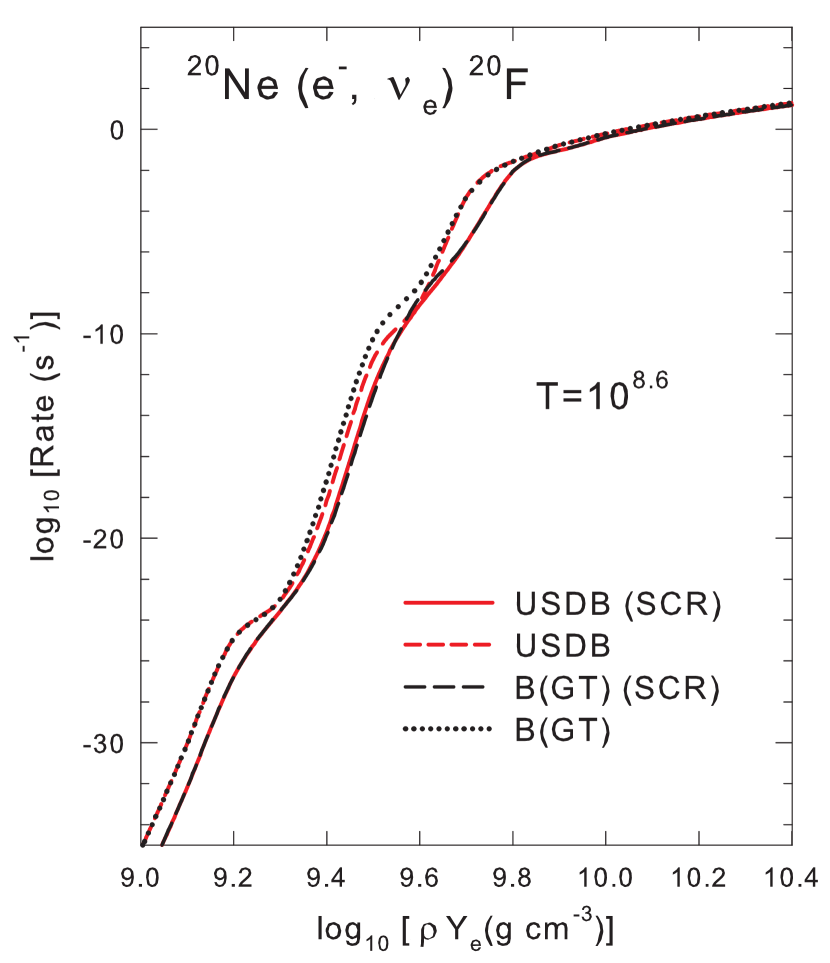
Total electron-capture rates on 20Ne are shown in Figure 2. Contributions from Gamow-Teller transitions from 0 and 2 states in 20Ne to 1+, 2+ and 3+ states in 20F obtained with USDB are included as well as the forbidden transition, 0 2.
2.3 Evolution of ONeMg core up to electron capture on 24Mg
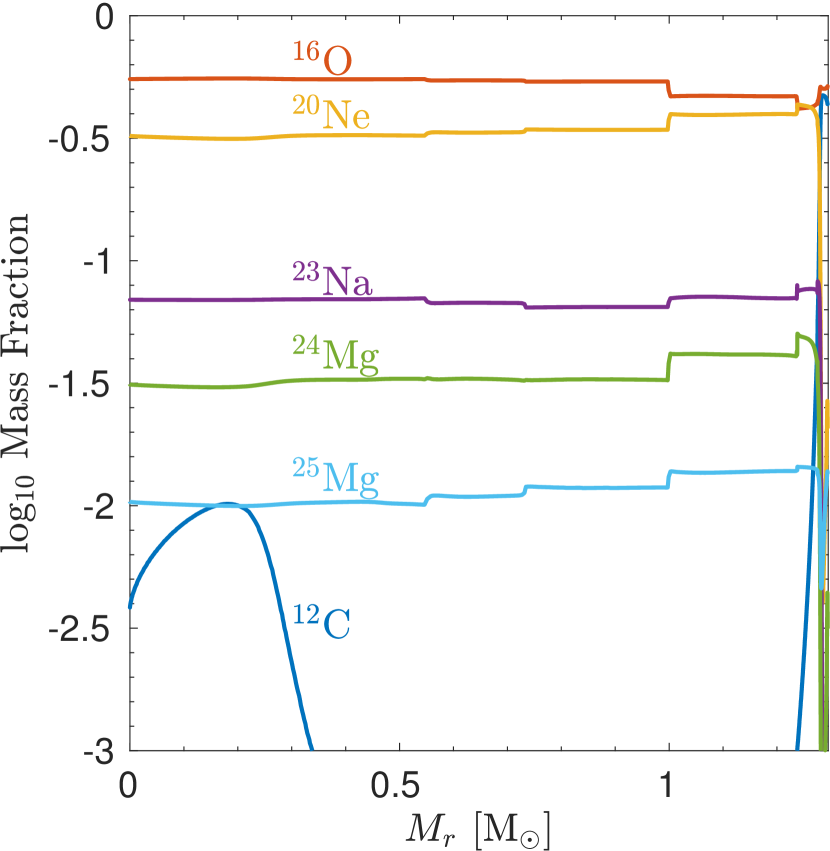
The evolution of the star until the formation of the degenerate ONeMg core is similar to the lower mass models of Jones et al. (2013). Carbon is ignited slightly off-center at ( is the mass coordinate). The carbon burning shell steadily propagates to the center, similar to the off-center carbon flame models in Farmer et al. (2015). After we stop the evolution of the whole star and remove its envelope, an core (with a CO layer) is left behind with the abundance profile shown in Figure 3. The abundances of key isotopes for URCA process and electron capture are listed in Table 1 in comparison with other works (Takahashi et al., 2013; Farmer et al., 2015; Schwab et al., 2017a). The composition agrees well with Farmer et al. (2015) except we produce 25Mg with the addition of . Note that we also find a residual carbon island at , but the maximum abundance is only so that oxygen burning cannot be ignited by this residual carbon burning at (Schwab & Rocha, 2019).
| \topruleIsotope | This work | T13 | F15 | SQB17 |
|---|---|---|---|---|
| 16O | 0.570 | 0.480 | 0.490 | 0.500 |
| 20Ne | 0.311 | 0.420 | 0.400 | 0.390 |
| 23Na | 0.069 | 0.035 | 0.060 | 0.050 |
| 24Mg | 0.031 | 0.050 | 0.030 | 0.050 |
| 25Mg | 0.010 | 0.015 | 0.002 | 0.010 |
For the accretion phase, until electron capture on 24Mg takes place, no convective instability is expected for the central region (Schwab et al., 2017a). The thermal evolution of the core is dominated by the compressional heating, thermal neutrino losses and URCA cooling. Then, 24Mg electron captures produce a negative temperature gradient and a positive gradient. The energy transport and mixing in such semiconvective region is not well constrained yet (Spruit, 2013), so we use the two extreme stability criteria, i.e., the Schwarzschild and Ledoux criteria, for investigating the uncertainties. In the following, we discuss the evolution after 24MgNa starts (when ) upon the usage of each criterion and set the theoretical uncertainty on the final outcomes.
2.4 Evolution of ONeMg Core with Ledoux Criterion
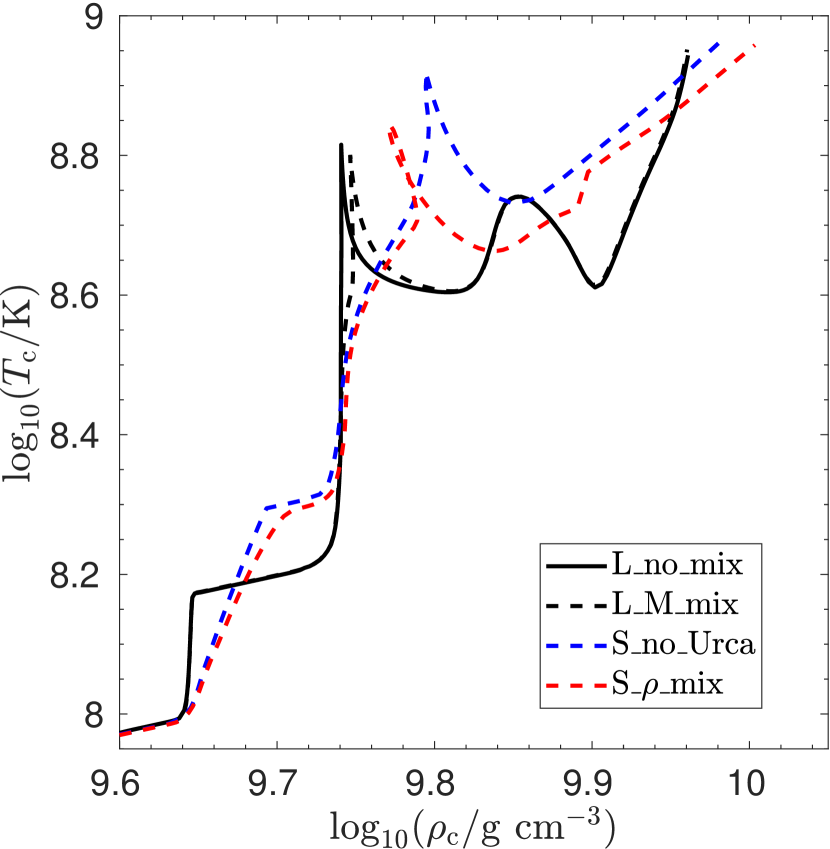
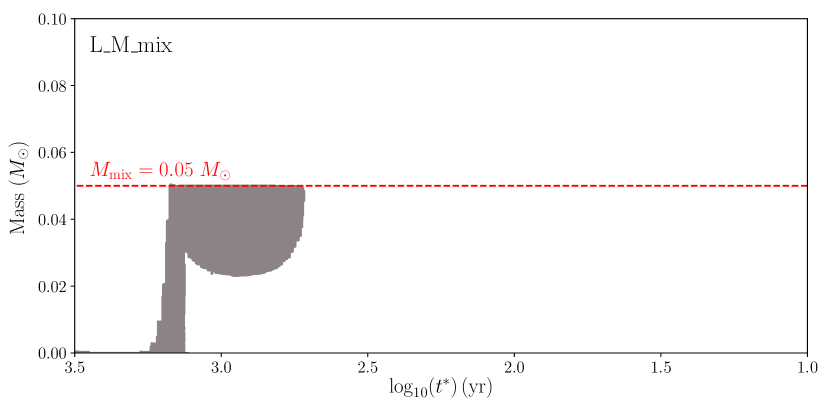
We first focus on the model with a mass accretion rate of yr-1. When using the Ledoux criterion, the gradient is able to stabilize against convective instability during electron capture on 24Mg. But after the onset of 24NaNe, a convective core develops. Numerical difficulty occurs when this convective core grows to . The rapid change of the convective boundary cannot be resolved with the Newton iteration solver in MESA (Schwab et al., 2017a; Schwab & Rocha, 2019). Two approaches are employed to further evolve the model. One is to mute the mixing-length theory treatment of convection by using the MESA option mlt_option=’none’ (model “L_no_mix”). Another is to limit the convection inside a mass coordinate beyond which we found the numerical difficulty (model “L_M_mix”). The evolution of the accreting ONeMg core in the central density-temperature plane is shown in Figure 4. The two approaches differ for the carbon ignition density, which is larger for L_M_mix due to the convective energy transport. Carbon burning does not ignite oxygen burning due to its low mass fraction in our ONeMg core model. Apart from this, the two models show the same evolution afterwards, as the thermal neutrino cooling drags the evolution back to a contractor (in balance between the compressional heating and thermal neutrino losses) at (Schwab & Rocha, 2019).
Later, the central region is heated by the second forbidden transition of 20NeF at and cooled by the URCA process 25NaNe at . The second forbidden transition is unable to ignite oxygen burning due to the slow increase of the electron-capture rate with respect to the density. The oxygen ignition then takes place mildly off-center at when . The convective structure for the L_M_mix model is shown in Figure 5. A convectively unstable core is driven by 24NaNe, until 24Na is depleted in the central region at . Heat released by electron capture on 20Ne does not result in the convection of the core.
2.5 Evolution of ONeMg Core with Schwarzshild Criterion
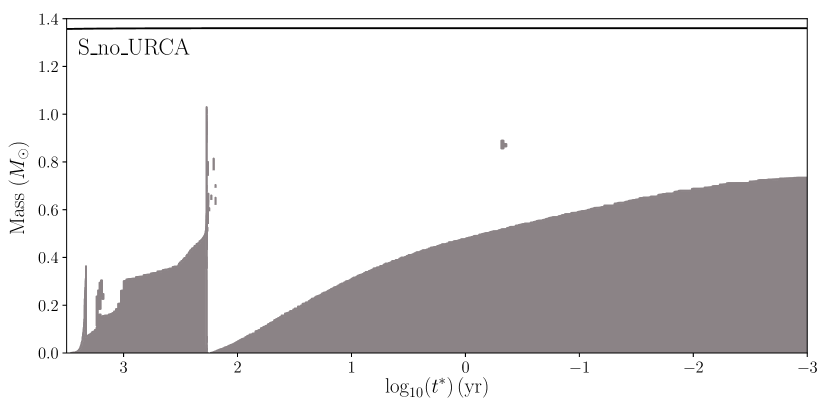
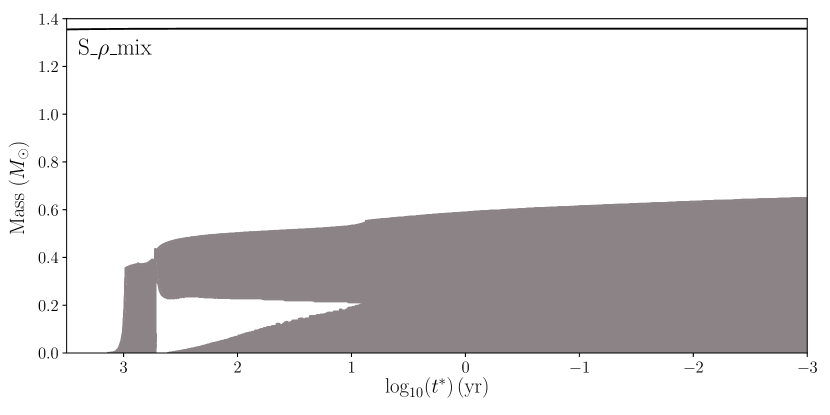
If we use the Schwarzschild criterion, the convection already emerges in the central region due to electron capture on 24Mg. The convective core continues to grow and eventually reaches the layers with ongoing URCA process of 23NaNe. Similar to Denissenkov et al. (2015) and Schwab et al. (2017b), the convective URCA process heats the core substantially in the MESA model. Due to this heating process, the core starts to expand at . As the work done by convection to transport degenerate electrons to the high density region is not self-consistently taken into account, this heating could be artificial. For our purpose, we get rid of the convective URCA process by two means. One is to mute the URCA reactions when the convective core reaches the corresponding layers (model “S_no_URCA”). Another is to limit the convective core below the URCA cooling shells (model “S__mix”). The URCA process of 25NaNe is muted as its threshold density is higher than that of 24MgNa.
Evolution of the accreting ONeMg core in the central density-temperature plane is also shown in Figure 4, in comparison with the Ledoux models. In this case, electron capture processes always make the core convectively unstable and the temperature increases slowly but to a higher value as more fuel is mixed into the center. Carbon burning is ignited at and cannot ignite oxygen burning. Convective structure of these two models are shown in Figures 6 and 7. An extended convective core is found in both models and has a mass of and at the oxygen ignition.
2.6 Oxygen Ignition
As seen in Figure 4, the contraction of the ONeMg core eventually leads to the oxygen ignition at . For the Schwarzshild criterion, due to the convective energy transport, the oxygen ignition takes place at the center and is delayed to a higher central density than that of the Ledoux models.
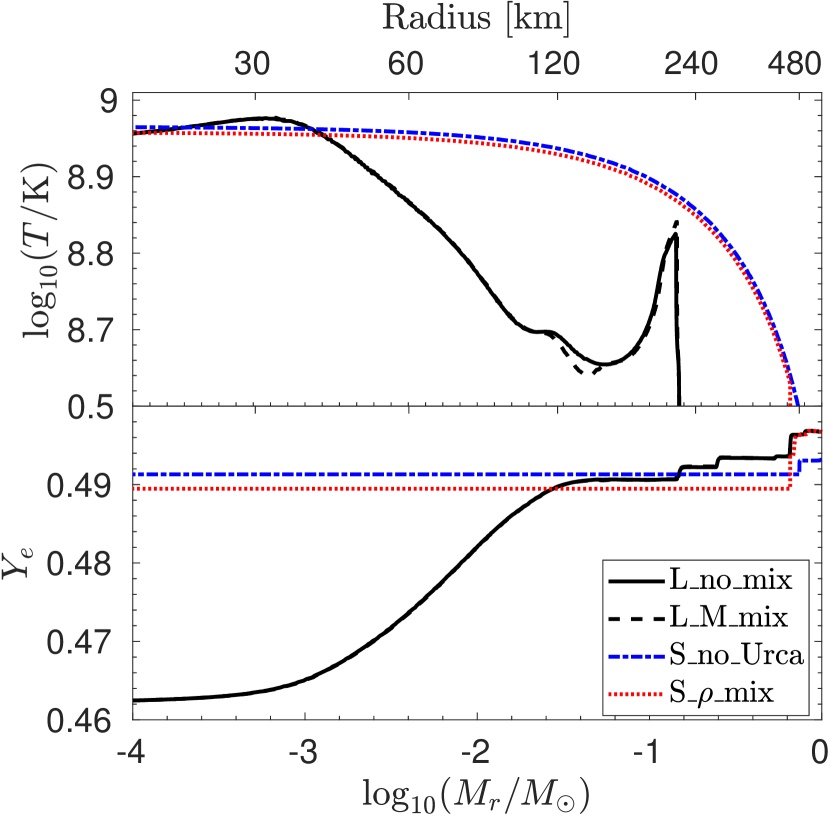
We compare the temperature and profiles at the oxygen ignition for the above 4 models in Figure 8.
For the Ledoux criterion, the result with allowing the convection at is identical to that with convection suppressed. The temperature profile is super-adiabatic at the central region stabilized by the positive gradient.
The two models with the Schwarzschild criterion have a similar central temperature structure except that the convective core is more extended in S__mix. Both models have a homogeneous profile in the central convective region. The key parameters for these models are summarized in Table 2 as the inputs for the subsequent hydrodynamical simulations.
| Model | [km] | ||||||
| L_no_mix | 9.96 | 0.464 | — | 1.361 | 32 | ||
| L_M_mix | 9.96 | 0.464 | — | 1.361 | 32 | ||
| S_no_URCA | 9.98 | 0.491 | 0.74 | 1.360 | 0 | 0 | |
| S__mix | 10.00 | 0.489 | 0.66 | 1.358 | 0 | 0 | |
| L_no_mix | 9.97 | 0.466 | — | 1.359 | 61 | ||
| S_no_URCA | 9.98 | 0.491 | 0.80 | 1.358 | 0 | 0 | |
| S__mix | 10.00 | 0.489 | 0.66 | 1.357 | 0 | 0 |
2.6.1 Off-center Oxygen Ignition
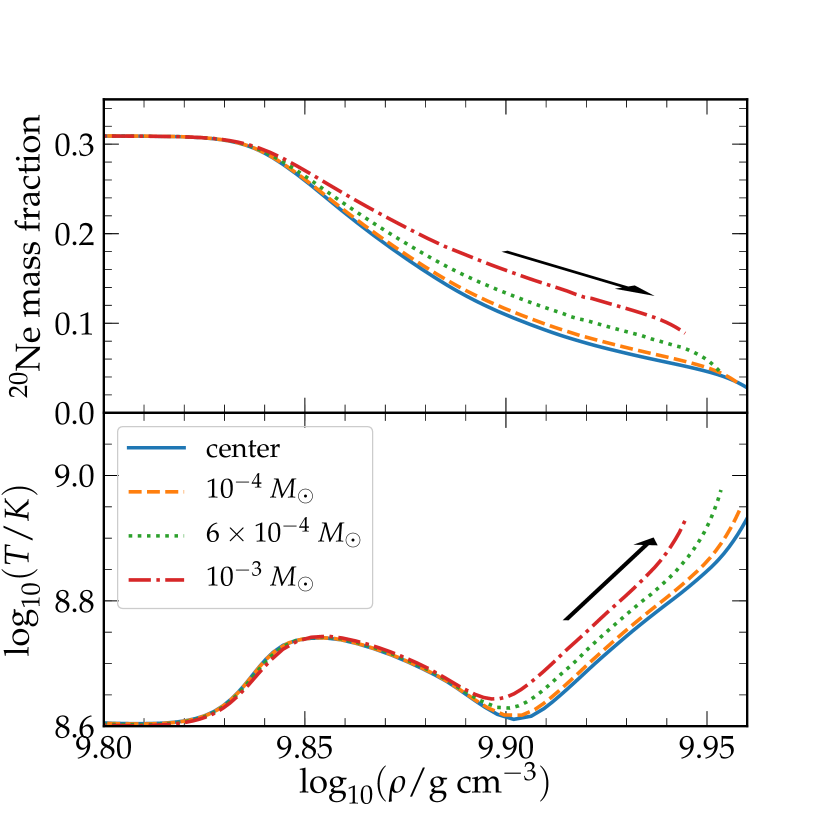
We found that with the inclusion of the second forbidden transition for 20NeF and using the Ledoux criterion, the oxygen ignition starts slightly off-center. This behavior was found to lower the critical below which the star explodes instead of collapsing (Leung et al., 2019). To address the reason for this off-center ignition, we show the evolution of the mass fractions of 20Ne as a function of the increasing local density for 4 representative mass zones in Figure 9. The oxygen ignition takes place at . electron capture on 20Ne is slower for the outer zones than the innermost zone (‘center’ in Figure 9). The higher 20Ne fraction in the outer zone results in a larger heating effect and temperature inversion. As a result, the oxygen ignition takes place mildly off-center.
2.6.2 Dependence on Core Growth Rate
To test the uncertainty of progenitor properties involved in the mass growth process, we calculate another set of models with a mass accretion rate of . The key parameters for the models at the oxygen ignition are also listed in Table 2. Most of the results show negligible differences compared to those with , except that for the case without any convection (L_no_mix), the oxygen ignition takes place further off-center at 61 km.
2.6.3 Location of Oxygen Ignition and 20Ne Mass Fraction
| Rate option | [km] | |||||
|---|---|---|---|---|---|---|
| Knuz | 0.311 | 0.570 | 0.026 | 0.039 | 32 | |
| jina reaclib | 0.325 | 0.549 | 0.036 | 0.036 | 0 | 0 |
| CF88 | 0.296 | 0.595 | 0.018 | 0.043 | 45 |
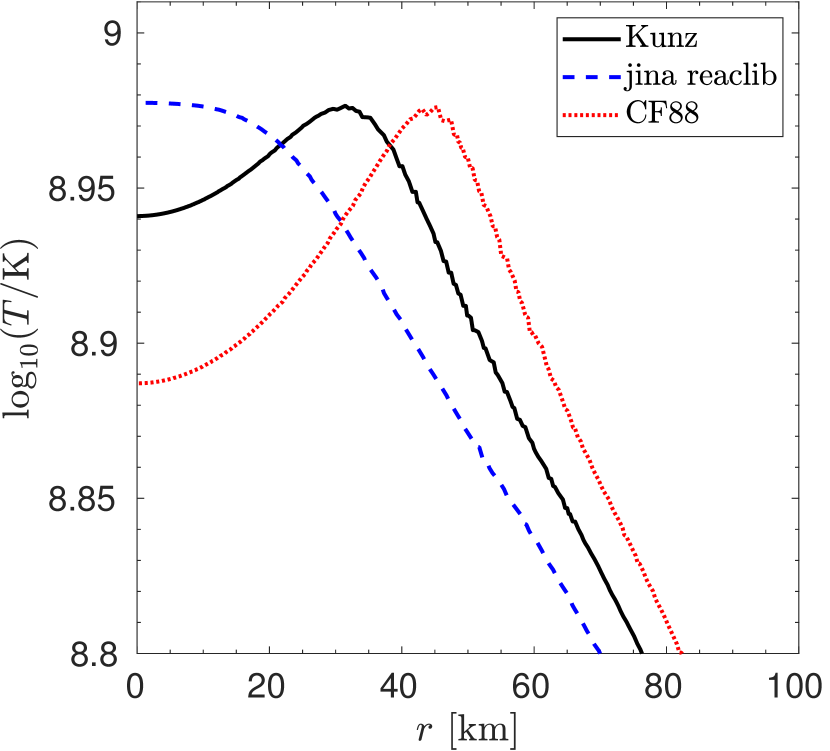
There is still an uncertainty for the reaction rate of 12CO (An et al., 2016). It is difficult to measure the rate at energies relevant for astrophysics. This rate affects the relative abundance of 12C and 16O after He burning, thus affecting the mass fraction of 20Ne after carbon burning. We check how this uncertainty affects our results by using three available rates for 12CO in the MESA code. In the previous models, we use ‘Kunz’ (Kunz et al., 2002), which results in . The other rates are ‘jina reaclib’ (Cyburt et al., 2010) and ‘CF88’ (Caughlan & Fowler, 1988)111The CF88 rate in MESA is larger than the original rate by a factor of 1.7., which result in and , respectively.
In Figure 10 we compare the final temperature profiles for the three 12CO rates. The convection is suppressed as in the ‘L_no_mix’ model. Table 3 summarizes and before and after electron capture on 20Ne and the location of the oxygen ignition. Although the difference in is relatively small, the ignition position of oxygen burning is different. In particular, for the largest with the ‘jina reaclib’ rate, the oxygen ignition takes place at the center. For the smallest with the ‘CF88’ rate, the ignition takes place further off-center at 45 km. The difference in the ignition position affects the final outcome of the hydrodynamical phase, which is explored in Section 3.
2.6.4 Effects of Residual Carbon
In the ONeMg core, there is a trace amount of residual carbon (Schwab & Rocha, 2019). In our case, the carbon is not enough to ignite oxygen burning at low density even if no mixing is allowed. However, Schwab & Rocha (2019) showed that with residual carbon (in a lower star) and without mixing, oxygen burning is ignited at . It is important to investigate how the convective mixing affects the results for this high carbon abundance as well as the convective URCA process associated with the carbon burning.
2.7 From Oxygen Ignition to Deflagration
We stop the MESA calculations at the oxygen ignition when the energy generation rate by oxygen burning exceeds thermal neutrino losses at the mass zone with the maximum energy generation rate. At this state, the heating timescale by the local oxygen burning is estimated as
| (1) |
where is the specific heat at constant pressure and the nuclear energy generation rate of oxygen burning. At the oxygen ignition, is s, which is still 8-9 orders of magnitude larger than the dynamical timescale ( s at ). Thus the thermonuclear runaway of local oxygen burning does not take place yet.
Oxygen burning forms a convectively unstable region even for the Ledoux criterion. The convective region will develop above the oxygen burning region, which is numerically difficult to calculate with the current MESA code. The further evolution is estimated as follows.
Firstly, materials in the convective region will be mixed. For the Schwarzschild models, the convective mixing from the center due to oxygen burning does not make much change of the and profiles seen in Figure 8.
For the L_no_mix model, in the mixed region will become much higher than 0.46. If the convective region extends to , becomes as estimated from the black solid line in Figure 8. As a result, only the very small central region of will have , while the outer part will have . Except for the very small central region, the averaged and profiles may not be so different from the Schwarzschild cases.
Secondly, for all models, the timescale of the temperature rise in the burning region will become long by the convective energy transport. Then the ONeMg core will continue to rapidly contract because of electron capture in the core whose mass is close to the “effective” with low . During contraction, the evolution in of the burning shell for all cases in Figure 4 will be close to the S__mix model (red dashed line) because of the convective energy transport. Eventually, the temperature reaches where the thermonuclear runaway occurs. To estimate at the runaway, we extrapolate the evolutionary paths of the burning shell of all cases along the red dashed line of S__mix in Figure 4 from the oxygen ignition to . We obtain even for the off-center ignition case. This is consistent with found by Takahashi et al. (2019), who took into account the semiconvective mixing. (If the super-adiabatic temperature gradient is taken into account, the runaway density would be a little lower.)
Because of the uncertainty in the evolution from the oxygen ignition through the thermonuclear runaway, in Section 3 we use the initial models with parameterized distribution and to study the parameter dependence of the hydrodynamical behavior. For the central density, we adopt . For the distribution, we adopt three cases as will be described in §3.2 and shown in Figure 11.
3 Hydrodynamical Simulations of Electron-Capture Supernovae
3.1 Methods
| Model | Conv. | Mix. | Result | ||||||
| Ledoux mix o-burn | |||||||||
| 6-0998-049-30-LM | 9.98 | 1.359 | 1400 | 30 | 0.49 | L | Y | E | |
| 6-0999-049-30-LM | 9.99 | 1.359 | 1410 | 30 | 0.49 | L | Y | C | |
| 6-1000-049-30-LM | 10.00 | 1.359 | 1420 | 30 | 0.49 | L | Y | C | |
| 7-1000-049-60-LM | 10.00 | 1.357 | 1370 | 60 | 0.49 | L | Y | E | |
| 7-1002-049-60-LM | 10.02 | 1.358 | 1350 | 60 | 0.49 | L | Y | C | |
| Smix | |||||||||
| 6-0996-049-00 | 9.96 | 1.359 | 1410 | 0 | 0.49 | S | Y | C | |
| 6-0996-049-30 | 9.96 | 1.359 | 1410 | 30 | 0.49 | S | Y | C | |
| 6-1000-049-00 | 10.00 | 1.360 | 1370 | 0 | 0.49 | S | Y | C | |
| 6-1000-049-30 | 10.00 | 1.360 | 1370 | 30 | 0.49 | S | Y | C | |
| 7-0997-049-00 | 9.97 | 1.358 | 1410 | 0 | 0.49 | S | Y | C | |
| 7-0997-049-60 | 9.97 | 1.358 | 1410 | 60 | 0.49 | S | Y | E | |
| 7-0999-049-60 | 9.99 | 1.359 | 1360 | 60 | 0.49 | S | Y | C | |
| 7-1000-049-00 | 10.00 | 1.360 | 1370 | 0 | 0.49 | S | Y | C | |
| 7-1000-049-60 | 10.00 | 1.360 | 1370 | 60 | 0.49 | S | Y | C | |
| Lnomix | |||||||||
| 6-0996-046-30 | 9.96 | 1.357 | 1430 | 30 | 0.46 | L | N | E | |
| 6-0996-046-00 | 9.96 | 1.357 | 1430 | 0 | 0.46 | L | N | E | |
| 6-0996-046-00b222The flame size is two times larger | 9.96 | 1.357 | 1430 | 0 | 0.46 | L | N | C | |
| 6-1000-046-30 | 10.00 | 1.357 | 1400 | 30 | 0.46 | L | N | E | |
| 6-1000-046-00 | 10.00 | 1.357 | 1400 | 0 | 0.46 | L | N | C | |
| 6-1010-046-30 | 10.10 | 1.361 | 1310 | 30 | 0.46 | L | N | C | |
| 7-0997-046-00 | 9.97 | 1.355 | 1430 | 0 | 0.46 | L | N | E | |
| 7-0999-046-00 | 9.99 | 1.356 | 1380 | 0 | 0.46 | L | N | E | |
| 7-1000-046-00 | 10.00 | 1.357 | 1400 | 0 | 0.46 | L | N | C | |
| 7-0997-046-60 | 9.97 | 1.355 | 1430 | 60 | 0.46 | L | N | E | |
| 7-1000-046-60 | 10.00 | 1.357 | 1400 | 60 | 0.46 | L | N | E | |
| 7-1002-046-60 | 10.02 | 1.357 | 1360 | 60 | 0.46 | L | N | E | |
| 7-1005-046-60 | 10.05 | 1.358 | 1330 | 60 | 0.46 | L | N | C | |
We use a 2D hydrodynamics code primarily developed for the supernova modeling (Leung et al., 2015a). The code has been applied to study Type Ia supernova (Leung et al., 2015b; Nomoto & Leung, 2017b; Leung & Nomoto, 2018, 2019b), accretion-induced collapse (Leung et al., 2019; Zha et al., 2019) and ECSN (Nomoto & Leung, 2017a; Leung & Nomoto, 2019a). Here we briefly review the algorithms particularly relevant to the modeling of ECSN. We refer the interested readers to the detailed implementation reported in Leung et al. (2019).
The code solves the 2D Euler equations using the fifth-order WENO scheme for spatial discretization (Barth & Deconinck, 1999) and five-step third-order NSSP Runge-Kutta scheme for time discretization (Wang & Spiteri, 2007). We use the Helmholtz equation of state (Timmes & Arnett, 1999). For the propagation speed of the oxygen deflagration, we implement sub-grid scale turbulence models introduced in Clement (1993) and Niemeyer & Hillebrandt (1995), with the turbulent flame model given in Pocheau (1994), Reinecke et al. (1999a, 2002) and Schmidt et al. (2006). We use the laminar flame speed as a function of the density and composition given in Timmes & Woosley (1992). To capture the geometry of oxygen deflagration we use the level-set method (Reinecke et al., 1999b) with reinitialization (Sussman et al., 1994). We use the three-step nuclear reaction to represent the energy production by nuclear burning (Townsley et al., 2007; Calder et al., 2007). Effects of binding energy changes, neutrino energy losses and mass differences between electron-proton pair and neutron are included for matter in NSE. The individual electron-capture rates of isotopes in the NSE ash are taken from Fuller et al. (1985); Oda et al. (1994b); Martínez-Pinedo & Langanke (1999); Nabi & Klapdor-Kleingrothaus (1999).333We remark that the computation of the electron-capture rate is still uncertain because the rate table for matter in NSE with relies on multiple tables. In particular, rates for isotopes with the mass number are based on Nabi & Klapdor-Kleingrothaus (1999). These rates have been calculated in Juodagalvis et al. (2010) based on the more sophisticated large-scale shell model as in (see e.g. Langanke & Martínez-Pinedo, 2000) but the actual values are unavailable yet.
We start the hydrodynamical phase of evolution by mapping the MESA model onto a 2D grid in cylindrical coordinates with a uniform spatial resolution of 4 km. (Details of the initial models are described in the §3.2.) To trigger the initial flame, we consider a central flame of a “three-finger” structure (see a similar illustration in Reinecke et al., 1999a) and an off-center flame with a one-bubble structure (also see Reinecke et al., 1999a). The bubble is put at 30 or 60 km away from the center444The location of the oxygen ignition is (61) km from the stellar evolutionary models with . For the hydrodynamical simulations, the results are not sensitive to the exact values for the adopted finite grid resolution.. The initially ignited matter is assumed to be burnt into NSE. A typical mass of to for the initial ash is assumed. In all simulations, we follow the propagation of the oxygen deflagration wave until the ONeMg core reaches a central density of () for the collapse (explosion) case.
3.2 Initial Models
In building the initial models in the hydrostatic equilibrium at the initiation of the deflagration, we use the stellar evolutionary models with yr-1 and yr-1. We use the 12CO rates by ‘Kunz’ (Table 2) and also ‘jina_reaclib’ (Table 3) to include the case of the central oxygen ignition.
For the and temperature profiles, we take into account the dependence on the convection criteria as shown in Figure 8 and Table 2. We also take into account the convection which develops after the oxygen ignition even for the Ledoux criterion (§2.7). The convection mixes the high matter in the outer part of the ONeMg core with the low materials at the oxygen-burning site (center or off-center).
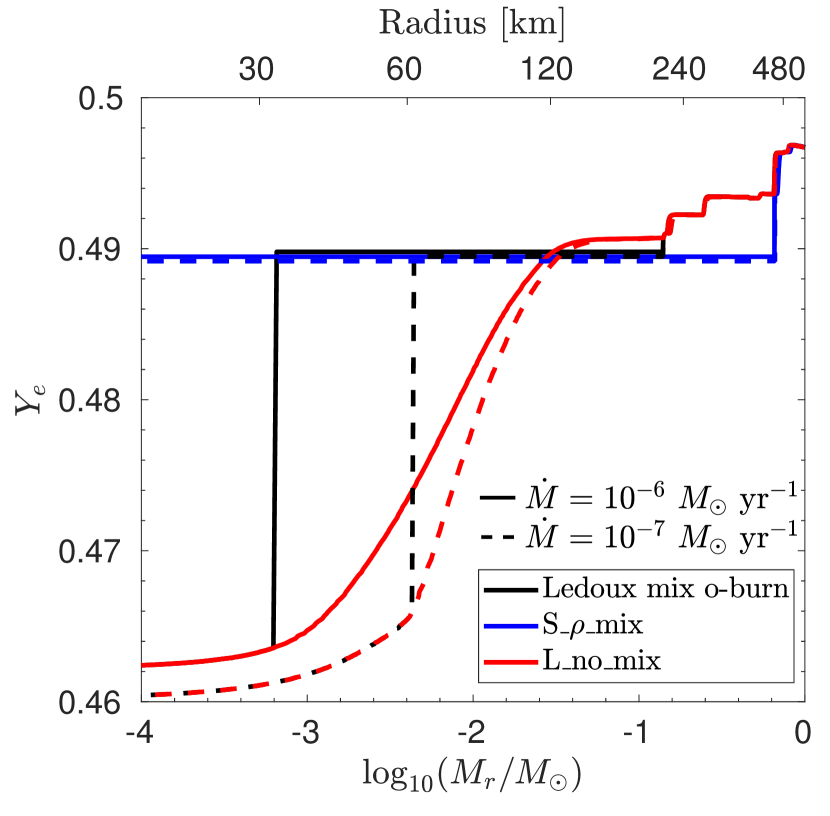
Therefore, for the initial profile, we constructed the following 3 cases (1)-(3) shown in Figure 11. We examine the dependence of the final fate of the ONeMg core on these initial distributions in §3.3 - 3.5. More details on the configuration are described in each subsection.
(1) “Ledoux mix o-burn”: Lnomix + mixed region above the oxygen ignited shell (§3.3).
(2) “Smix”: Schwarzshild criterion with almost full mixing. This also accounts for the convective mixing after the central ignition due to the usage of the ‘jina_reaclib’ rate for the Ledoux criterion (§3.4).
(3) “Lnomix”: Ledoux criterion with no mixing (§3.5).
In these models, is a model parameter. As discussed in §2.7, the convective energy transport above the oxygen ignited shell can significantly delay the thermonuclear runaway, thus increasing . However, the exact details of the convective energy transport and mixing remain unknown due to numerical difficulties with MESA. Therefore, the exact when the deflagration starts and its position are not well determined. As estimated in §2.7, can be as high as . Here we take ranging from to .
We do not directly map the MESA density profile because we find that the discretization produces global motion of the ONeMg core, which may affect the initial propagation of the flame and the final fate. Instead, we recalculate the hydrostatic equilibrium explicitly for a central density , with and temperature as a function of .
In Table 4 we tabulate the parameters and the outcomes of the hydrodynamical simulations for the models studied in this work. We name the models as follows. In 6-0996-046-30, 7-1002-049-60, and 6-0998-049-30-LM,, for example,
(a) “6” and “7” stand for the “6”-series and “7”-series progenitors evolved with yr-1 and yr-1, respectively.
(b) “0996”, “0998” and “1002” stand for = 9.96, 9.98 and , respectively.
(c) “046” and “049” stand for and 0.49, respectively, at the center of case (3) models (Lnomix) and case (2) models (Smix). of case (1) models (Ledoux mix o-burn) is shown as “049” (see (e) below).
(d) “30” and “60” stand for the initial flame at a distance of 30 and 60 km from the center, respectively.
(e) Models with an ending “-LM” represent those of case (1) above, i.e., L_no_mix + mixed region above the oxygen-ignited shell. In these models, “049” stands for in the oxygen-burning mixed shell.
3.3 Off-Center Runaway with Mixing (Ledoux mix o-burn “LM” Models)
These models come from the evolution of the ONeMg core using the Ledoux criterion with the off-center convective mixing (see Ledoux mix o-burn in Figure 11). When the off-center oxygen burning is ignited, the generated energy drives the convection from the burning location to the outer part.
To construct the initial models, we first use the and temperature profiles obtained from Section 2. Then we estimate the convective mixing which produces approximately 0.49. Within the region of , no mixing is assumed and the profile is directly taken from the stellar evolutionary model. Thus we set the following distribution as seen in Figure 11. At , 0.46 - 0.47, while at , 0.49. At follows the stellar evolutionary model again.
We do not change the temperature since the matter is extremely degenerate such that the role of temperature is unimportant compared to .
In §3.3.1, we run the models with as a parameter to see how the final fate depends on it.
3.3.1 -dependence
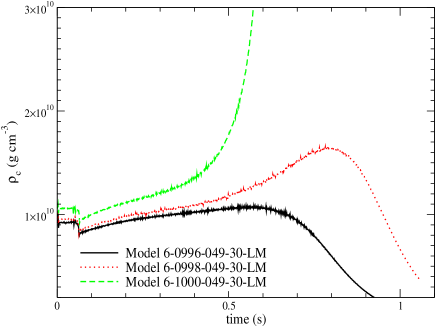
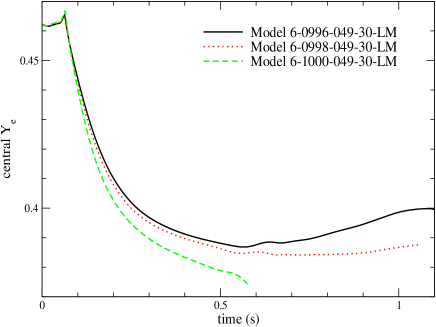
In Figure 12 we plot the central density and central against time for Models 6-0996-049-30-LM, 6-0998-049-30-LM and 6-1000-049-30-LM in the left and right panels respectively.
There is a time lapse s which is the time for the flame to arrive at the center to trigger the early expansion. The model which collapses shows a monotonic increase in the central density after the early expansion. For , the ONeMg core collapses to form a NS. Models which eventually explode show a turning point in the central density evolution. This is the moment when the energy input by the oxygen deflagration dominates the dynamical process in the star. We remark that for the model close to the bifurcation point, i.e., Model 6-0998-049-30, the central density at the turning point is as high as .
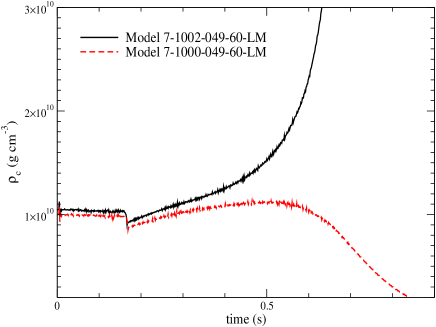
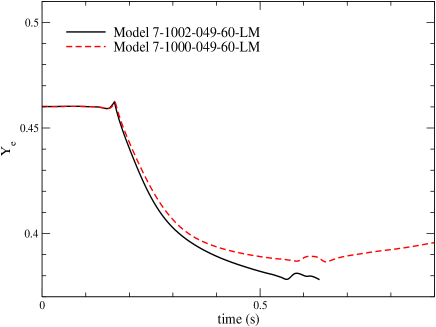
We also study the hydrodynamical outcomes for the model set with yr-1. In Figure 13 we plot the central density and evolution for Models 7-1000-046-60-LM and 7-1002-049-60-LM. Compared with the “6”-series, these two models have a farther off-center ignition at 60 km, which requires a longer time ( s) for the flame to reach the center. It thus provides more time for the flame to develop in its size and surface area, which may balance the contraction after electron capture occurs in the center.
When the flame arrives at the center, the heated core again rapidly expands by . Then the rapid electron capture in the NSE ash induces the first contraction. For , the core continues to collapse. For , the expansion starts at s. The electron capture fails to trigger sufficiently strong contraction before the flame can release the necessary energy to make the star explode.
3.4 Centered Runaway with Mixing (Smix Models)
When we apply the Schwarzschild criterion, convection can develop in the core before the oxygen ignition. The convective flow transports heat away from the center, which is the first place expected for the nuclear runaway, and uniformly mix the material as seen in Figure 8. To construct the models in Figure 11, we adopt the profile of Smix in Figure 8. Major differences in the initial models from those in §3.3 are the flat distribution in the core and the centered flame.
We also notice that this scenario is also possible for the Ledoux criterion. As described in Table 3, the exact abundance of 12C and 20Ne depends on the nuclear reaction rate. When we use the updated reaction rate ‘jina_reaclib’ the higher leads to the oxygen ignition at the center. And even with the Ledoux criterion, a convective core driven by the oxygen burning develops from the center afterwards.
3.4.1 -dependence
As discussed in §2.7, the core continues to contract to a higher until the thermonuclear runaway starts. Since the exact depends on the efficiency of the convective energy transport, we examine how the outcome of the deflagration depends on .
In the left panel of Figure 14 we show the central density evolution of two models with and 10.00. Both models directly collapse. The minimum for the ONeMg core to collapse is 9.96, which is even lower than 10.00 of the MESA model with the Schwarzschild criterion (S__mix). We also plot the central evolution in the right panel, which smoothly decreases without any bump.
The “7”-series models with different (7-0997-049-00 and 7-1000-049-00) are plotted in the Figure 15. The high (=0.49) again allows the ONeMg core to collapse at , which is lower than 10.00 of stellar evolutionary model (S__mix).
3.4.2 -dependence
For models with the central oxygen ignition, the center is the most likely position for the oxygen deflagration to start because the convection developed from the center will smooth out any temperature inversion in the star. However, when the convective flow is strong, the potential fluid parcel which will undergo the nuclear runaway may be carried away by the flow before the runaway is triggered. As a result, an off-center flame can be developed. Therefore, the exact could be non-zero and depends on the detailed characteristic of the convective flow. Here, we study the uncertainties in this parameter.
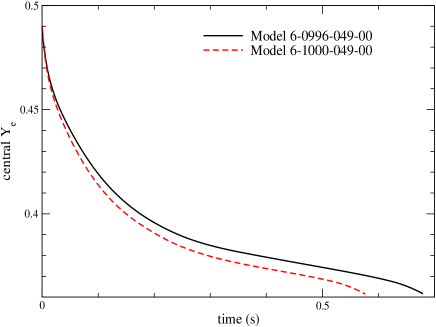
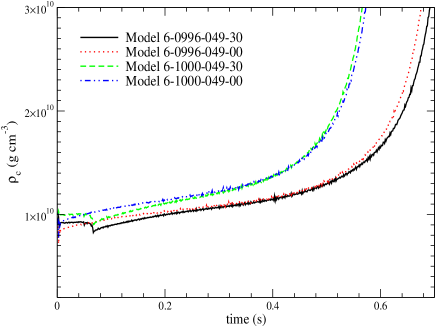
We simulate the propagation of the oxygen deflagration with different initial flame structures. In Figure 16 we compare the evolution of Models 6-0996-049-30, 6-0996-049-00, 6-1000-049-30 and 6-1000-049-00. They are two sets of models with the centered (-00) and off-center flame (-30). The two correspond to , i.e., the lowest cases of obtained from the Ledoux (0996) and Schwarzschild (1000) criteria, respectively.
Figure 16 shows that all four models directly collapse. As discussed in the previous section, the position of the initial flame affects the early evolution of the central density. Models with a centered flame show a rapid drop in at the beginning, but then the following electron capture makes the core contract again and increase until the simulations end. Models with an off-centered flame show no change in until the flame arrives at the center at s. After the rapid drop by , increases again until the end of simulations. Therefore, for models with 30 km, the position of the initial flame is less important for the final fate of the ONeMg core.
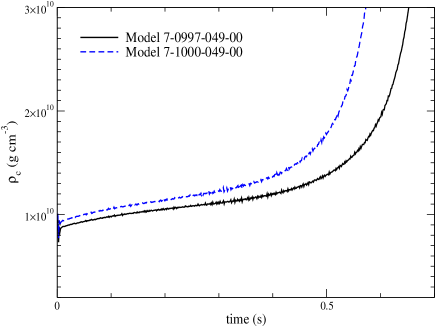
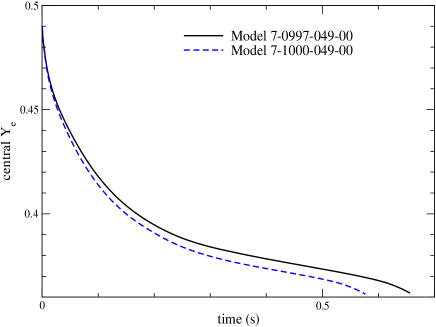
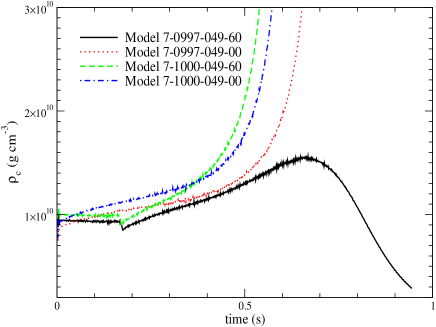
In the right panel of Figure 16 we plot the central density evolution for Models 7-0997-049-60, 7-0997-049-00, 7-1000-049-60 and 7-1000-049-00. The two models with a higher collapse. However, different from the models with 30 km, the lower model with a centered flame collapses while that with an off-center flame ( 60 km) explodes.
3.5 Off-center Runaway without Mixing (Lnomix Models)
Here we examine the model developed from the model Lnomix. This is another limiting case in our model survey, where we assume no convective mixing appears despite that the oxygen burning creates a convectively unstable region even with the Ledoux criterion. As a result, the oxygen-ignited site becomes the site for the nuclear runaway.
3.5.1 -dependence
We examine the dependence of the evolution of the ONeMg core on the initial central density . Even neglecting the convective energy transport, the timescale of the temperature rise due to early phase of the oxygen burning is still longer than the timescale of core contraction due to electron capture. Therefore can become somewhat higher than .
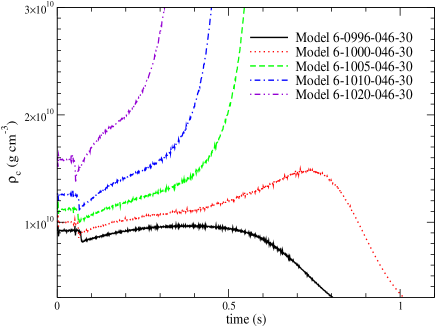
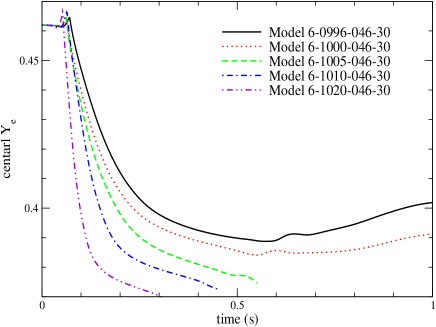
In the left panel of Figure 17 we plot the central density evolution for 5 models from 6-0996-046-30 to 6-1020-046-30, where the flame position and the temperature and profiles against are the same. at the center is as low as 0.46. Model 6-0996-046-30 corresponds to the model L_no_mix without contraction after the oxygen ignition, i.e., . The central density remains unchanged again for the first 0.1 s. Then, the central density shows a sudden drop as the burnt matter in the center expands. After that, the central density increases again. For models with a higher , the contraction is faster. Models with collapse into NSs.
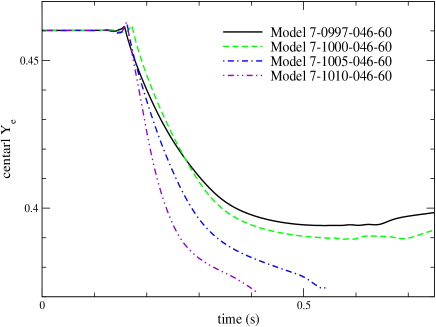
In the right panel of Figure 17, we show the corresponding central evolution. Before the flame reaches the center, remains unchanged. However, once the material is burnt into NSE, quickly drops from its original value to within 0.1 - 0.2 s. For a higher , the electron capture takes place faster. For models which explode, the central increases mildly when the central matter is mixed with the outer high material, until it reaches an asymptotic value.
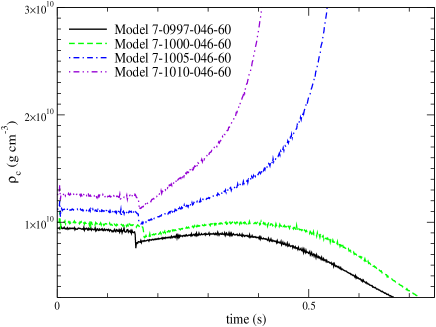
In the left panel of Figure 18 we plot the central density evolution for 4 models from 7-0997-046-60 to 7-1010-046-60. Model 7-0997-046-60 corresponds to the model L_no_mix without contraction after the oxygen ignition, i.e., . For models with , they collapse into NSs. It takes a longer time of s for the flame to reach the center. Then the early expansion and the subsequent contraction due to electron capture take place. The contraction is weaker than the case for because the flame has more time to propagation before central electron capture induces the rapid contraction. A maximum of is found for the turning point of the exploding models. At s, the core begins its expansion.
In the right panel, we plot the corresponding central evolution. The qualitative feature of the evolution is similar to the “6”-series models. Models which explode reach a minimum of . For those which collapse, continues to drop before the simulations stop. From the two set of models, it suffices to see that, despite the initial configurations are different, the models still show a strong sensitivity on . In particular, the exact value of is important because the minor change from to is sufficient to change the core from explosion to collapse.
3.5.2 -dependence
Depending on the nuclear reaction network, as discussed in §2.6.3, the initial runaway position can change from off-center ( km) to the center. Here we briefly examine how the models vary by considering the different possible position of the initial flame.
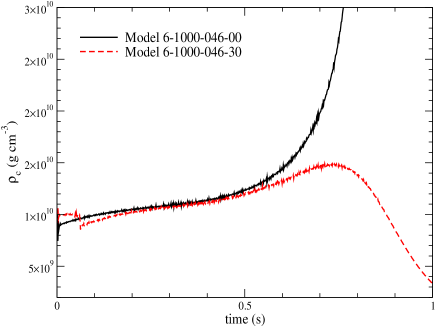
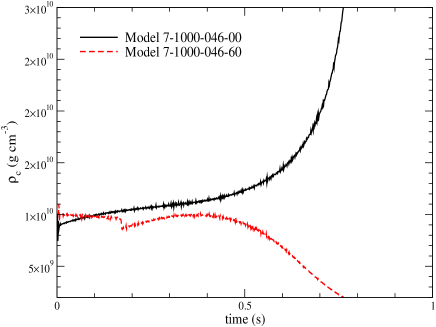
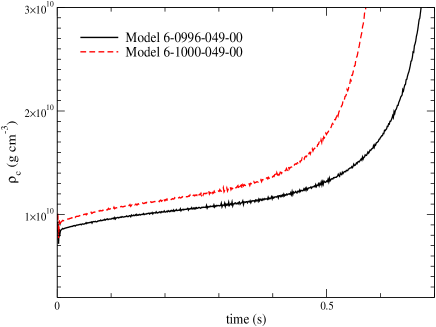
In Figure 19 we plot the central density evolution for Models 6-1000-046-30 and 6-1000-046-00 in the left panel and Models 7-1000-046-60 and 7-1000-046-00 in the right panel. Here we see the contrasting final fates when the flame starts at the center or off-center. For the centered flame in both cases, a direct collapse of ONeMg core is observed. On the other hand, an off-center flame leads to explosion. Furthermore, in the exploding case, owing to the high initial central density, during the contraction phase the central density can reach as high as . Such a high central density allows to reach as low as . The low allows formation of extremely neutron-rich isotopes, which may provide characteristic abundances if they are later ejected from the core during explosion.
3.6 Summary of Parameter Dependence
In §3.3-3.5, we have performed the hydrodynamical simulations by adopting the three distributions at the oxygen ignition: (1) Ledoux mix o-burn (§3.3), (2) Smix (§3.4), and (3) Lnomix (§3.5). Such differences stem from the different treatment of convection. Development of the convection after the oxygen ignition controls the further evolution and determines and the flame location () at the initiation of the oxygen deflagration. Because of the numerical difficulty to follow the evolution after the oxygen ignition, we have treated and as parameters.
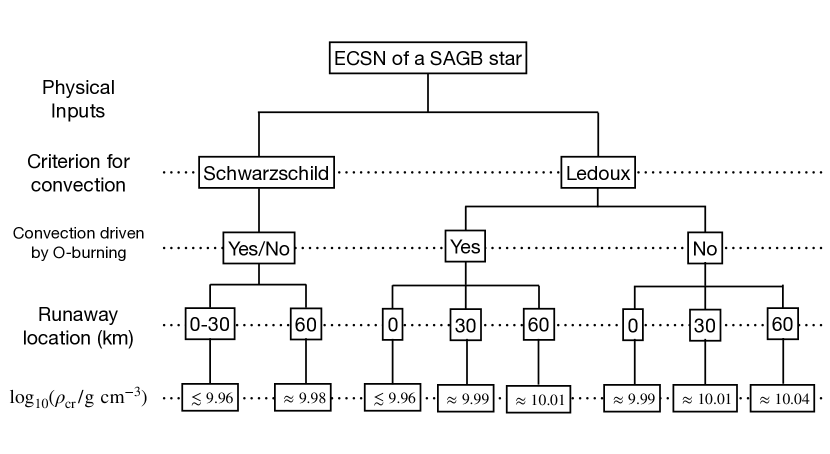
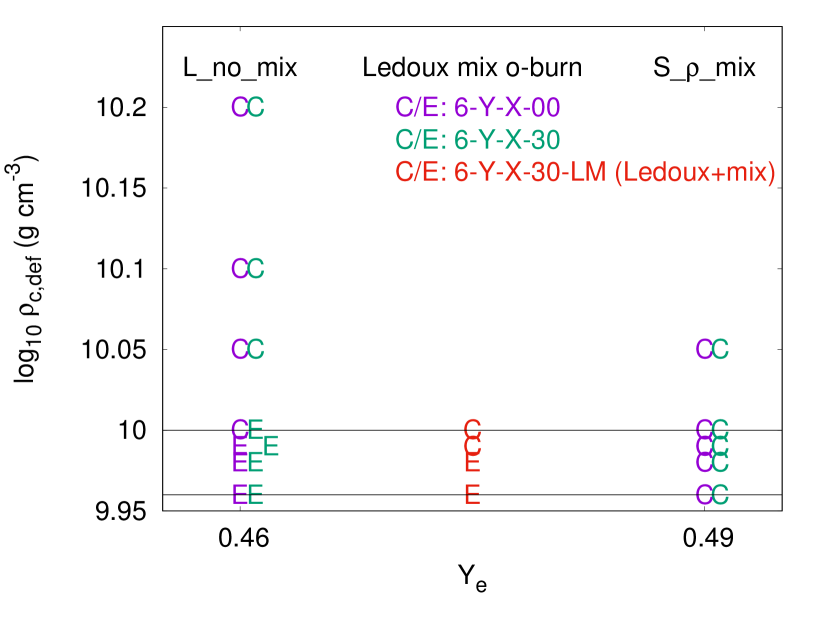
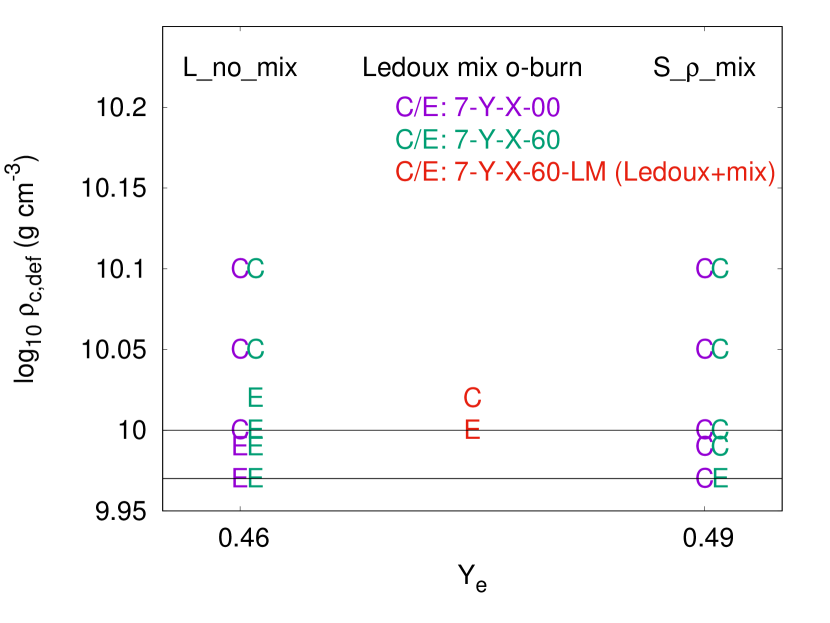
The outcomes of our 2D hydrodynamical simulations depend on the above parameters are summarized in Figures 21 and 22 for and , respectively. Here, the final fate of the ONeMg core is designated as either C (collapse) or E (explosion).
In the abscissa, 3 cases of the initial distributions are shown as for case (3), for case (2), and case (1) (-LM) in between. In the ordinate, is shown.
For case (1) (-LM), if 9.99 and 10.02, the final fate is the collapse for 30 km and 60 km, respectively. On the contrary, if and 10.00, respectively, the final fate would be the explosion. In other words, 9.985 and 10.01 for 30 km and 60 km, respectively.
For case (2) () with the Schwarzshild criterion, most models collapse, and even .
For case (3) with no mixing, . If as we estimated for the evolution after the oxygen ignition (§2.7), , i.e., the collapse is the most likely outcome.
4 Summary
We have calculated the evolution of the 8.4 star from the main sequence until the oxygen ignition in the degenerate ONeMg core, where the nuclear energy generation rate exceeds the thermal neutrino loss rate and a convective region develops. We have applied the latest weak rates (Suzuki et al., 2019), including the second forbidden transition for the electron capture on 20Ne (Kirsebom et al., 2018).
5 Acknowledgment
The results in this paper have been presented at the Lorentz Center workshop on “Electron-Capture-Initiated Stellar Collapse”. We would like to thank the Lorentz Center and the workshop participants for stimulated discussion. Near the end of the workshop, Kirsebom et al. (2019) was submitted. We will make comparisons in a separate paper. This work was supported by World Premier International Research Center Initiative (WPI), MEXT, Japan and JSPS KAKENHI Grant Numbers JP17K05382, JP19K03855, and a grant from the Research Grant Council of Hong Kong (Project 14300317). We acknowledge the support of the CUHK Central High Performance Computing Cluster, on which the stellar evolution simulation in this work has been performed. We thank F.-X. Timmes for the open-source subroutines of the helmholtz equation of state and torch nuclear reaction network. We also thank MESA developers for making their code open-source.
References
- An et al. (2016) An, Z.-D., Ma, Y.-G., Fan, G.-T., et al. 2016, ApJ, 817, L5
- Barth & Deconinck (1999) Barth, T. J., & Deconinck, H. 1999, Lecture Notes in Computational Science and Engineering 9: High-Order Methods for Computational Physics (Springer)
- Bloecker (1995) Bloecker, T. 1995, A&A, 299, 755
- Brown & Richter (2006) Brown, B. A., & Richter, W. A. 2006, Phys. Rev. C, 74, 034315
- Calder et al. (2007) Calder, A. C., Townsley, D. M., Seitenzahl, I. R., et al. 2007, ApJ, 656, 313
- Caughlan & Fowler (1988) Caughlan, G. R., & Fowler, W. A. 1988, Atomic Data and Nuclear Data Tables, 40, 283
- Clement (1993) Clement, M. J. 1993, ApJ, 406, 651
- Cyburt et al. (2010) Cyburt, R. H., Amthor, A. M., Ferguson, R., et al. 2010, ApJS, 189, 240
- Denissenkov et al. (2015) Denissenkov, P. A., Truran, J. W., Herwig, F., et al. 2015, MNRAS, 447, 2696
- Doherty et al. (2017) Doherty, C. L., Gil-Pons, P., Siess, L., & Lattanzio, J. C. 2017, Publications of the Astronomical Society of Australia, 34, e056
- Doherty et al. (2015) Doherty, C. L., Gil-Pons, P., Siess, L., Lattanzio, J. C., & Lau, H. H. B. 2015, MNRAS, 446, 2599
- Fantina et al. (2012) Fantina, A. F., Khan, E., Colò, G., Paar, N., & Vretenar, D. 2012, Phys. Rev. C, 86, 035805
- Farmer et al. (2015) Farmer, R., Fields, C. E., & Timmes, F. X. 2015, ApJ, 807, 184
- Fryer et al. (1999) Fryer, C., Benz, W., Herant, M., & Colgate, S. A. 1999, ApJ, 516, 892
- Fuller et al. (1980) Fuller, G. M., Fowler, W. A., & Newman, M. J. 1980, ApJS, 42, 447
- Fuller et al. (1985) —. 1985, ApJ, 293, 1
- Gutiérrez et al. (2005) Gutiérrez, J., Canal, R., & García-Berro, E. 2005, A&A, 435, 231
- Höfner & Olofsson (2018) Höfner, S., & Olofsson, H. 2018, A&A Rev., 26, 1
- Iben (1978) Iben, I., J. 1978, ApJ, 226, 996
- Jones et al. (2016) Jones, S., Röpke, F. K., Pakmor, R., et al. 2016, A&A, 593, A72
- Jones et al. (2013) Jones, S., Hirschi, R., Nomoto, K., et al. 2013, ApJ, 772, 150
- Jones et al. (2019) Jones, S., Röpke, F. K., Fryer, C., et al. 2019, A&A, 622, A74
- Juodagalvis et al. (2010) Juodagalvis, A., Langanke, K., Hix, W. R., Martínez-Pinedo, G., & Sampaio, J. M. 2010, Nucl. Phys. A, 848, 454
- Kasliwal et al. (2017) Kasliwal, M. M., Bally, J., Masci, F., et al. 2017, VizieR Online Data Catalog, J/ApJ/839/88
- Kippenhahn et al. (2012) Kippenhahn, R., Weigert, A., & Weiss, A. 2012, Stellar Structure and Evolution
- Kirsebom et al. (2018) Kirsebom, O. S., Hukkanen, M., Kankainen, A., et al. 2018, arXiv e-prints, arXiv:1805.08149
- Kirsebom et al. (2019) Kirsebom, O. S., Jones, S., Strömberg, D. F., et al. 2019, arXiv e-prints, arXiv:1905.09407
- Kitaura et al. (2006) Kitaura, F. S., Janka, H.-T., & Hillebrandt, W. 2006, A&A, 450, 345
- Kunz et al. (2002) Kunz, R., Fey, M., Jaeger, M., et al. 2002, ApJ, 567, 643
- Langanke & Martínez-Pinedo (2000) Langanke, K., & Martínez-Pinedo, G. 2000, Nuclear Physics A, 673, 481
- Langanke & Martínez-Pinedo (2001) Langanke, K., & Martínez-Pinedo, G. 2001, Atomic Data and Nuclear Data Tables, 79, 1
- Leung et al. (2015a) Leung, S.-C., Chu, M.-C., & Lin, L.-M. 2015a, MNRAS, 454, 1238
- Leung et al. (2015b) —. 2015b, ApJ, 812, 110
- Leung & Nomoto (2018) Leung, S.-C., & Nomoto, K. 2018, ApJ, 861, 143
- Leung & Nomoto (2019a) —. 2019a, Publications of the Astronomical Society of Australia, 36, e006
- Leung & Nomoto (2019b) —. 2019b, ApJ submitted, arXiv:1901.10007
- Leung et al. (2019) Leung, S.-C., Nomoto, K., & Suzuki, T. 2019, ApJ submitted, arXiv:1901.11438
- Leung et al. (2019) Leung, S.-C., Shuai, Z., Chu, M.-C., & Lin, L.-M. 2019, In Preparations
- Martínez-Pinedo et al. (2014) Martínez-Pinedo, G., Lam, Y. H., Langanke, K., Zegers, R. G. T., & Sullivan, C. 2014, Phys. Rev. C, 89, 045806
- Martínez-Pinedo & Langanke (1999) Martínez-Pinedo, G., & Langanke, K. 1999, Phys. Rev. Lett., 83, 4502
- Miyaji & Nomoto (1987) Miyaji, S., & Nomoto, K. 1987, ApJ, 318, 307
- Miyaji et al. (1980) Miyaji, S., Nomoto, K., Yokoi, K., & Sugimoto, D. 1980, Publications of the Astronomical Society of Japan, 32, 303
- Moriya et al. (2014) Moriya, T. J., Tominaga, N., Langer, N., et al. 2014, A&A, 569, A57
- Nabi & Klapdor-Kleingrothaus (1999) Nabi, J.-U., & Klapdor-Kleingrothaus, H. V. 1999, Atomic Data and Nuclear Data Tables, 71, 149
- Niemeyer & Hillebrandt (1995) Niemeyer, J. C., & Hillebrandt, W. 1995, ApJ, 452, 769
- Nomoto (1984) Nomoto, K. 1984, ApJ, 277, 791
- Nomoto (1987) —. 1987, ApJ, 322, 206
- Nomoto et al. (2013) Nomoto, K., Kobayashi, C., & Tominaga, N. 2013, ARA&A, 51, 457
- Nomoto & Kondo (1991) Nomoto, K., & Kondo, Y. 1991, ApJ, 367, L19
- Nomoto & Leung (2017a) Nomoto, K., & Leung, S.-C. 2017a, Handbook of Supernovae, eds. Alsabti, A.W. & Murdin, P. (Springer), 2017, Vol. 1, p. 483
- Nomoto & Leung (2017b) —. 2017b, Handbook of Supernovae, eds. Alsabti, A.W. & Murdin, P. (Springer), 2017, Vol. 2, p. 1275
- Nomoto et al. (1979) Nomoto, K., Miyaji, S., Sugimoto, D., & Yokoi, K. 1979, in IAU Colloq. 53: White Dwarfs and Variable Degenerate Stars, ed. H. M. van Horn, V. Weidemann, & M. P. Savedoff, 56
- Nomoto et al. (1982) Nomoto, K., Sparks, W. M., Fesen, R. A., et al. 1982, Nature, 299, 803
- O’Connell et al. (1972) O’Connell, J. S., Donnelly, T. W., & Walecka, J. D. 1972, Phys. Rev. C, 6, 719
- Oda et al. (1994a) Oda, T., Hino, M., Muto, K., Takahara, M., & Sato, K. 1994a, Atomic Data and Nuclear Data Tables, 56, 231
- Oda et al. (1994b) —. 1994b, Atomic Data and Nuclear Data Tables, 56, 231
- Paar et al. (2009) Paar, N., Colò, G., Khan, E., & Vretenar, D. 2009, Phys. Rev. C, 80, 055801
- Paxton et al. (2011) Paxton, B., Bildsten, L., Dotter, A., et al. 2011, ApJS, 192, 3
- Paxton et al. (2013) Paxton, B., Cantiello, M., Arras, P., et al. 2013, ApJS, 208, 4
- Paxton et al. (2015) Paxton, B., Marchant, P., Schwab, J., et al. 2015, ApJS, 220, 15
- Paxton et al. (2018) Paxton, B., Schwab, J., Bauer, E. B., et al. 2018, ApJS, 234, 34
- Paxton et al. (2019) Paxton, B., Smolec, R., Gautschy, A., et al. 2019, arXiv e-prints, arXiv:1903.01426
- Pocheau (1994) Pocheau, A. 1994, Phys. Rev. E, 49, 1109
- Radice et al. (2017) Radice, D., Burrows, A., Vartanyan, D., Skinner, M. A., & Dolence, J. C. 2017, ApJ, 850, 43
- Reimers (1975) Reimers, D. 1975, Memoires of the Societe Royale des Sciences de Liege, 8, 369
- Reinecke et al. (1999a) Reinecke, M., Hillebrandt, W., & Niemeyer, J. C. 1999a, A&A, 347, 739
- Reinecke et al. (2002) —. 2002, A&A, 386, 936
- Reinecke et al. (1999b) Reinecke, M., Hillebrandt, W., Niemeyer, J. C., Klein, R., & Gröbl, A. 1999b, A&A, 347, 724
- Richter et al. (2008) Richter, W. A., Mkhize, S., & Brown, B. A. 2008, Phys. Rev. C, 78, 064302
- Schmidt et al. (2006) Schmidt, W., Niemeyer, J. C., Hillebrandt, W., & Röpke, F. K. 2006, A&A, 450, 283
- Schwab et al. (2017a) Schwab, J., Bildsten, L., & Quataert, E. 2017a, MNRAS, 472, 3390
- Schwab et al. (2017b) Schwab, J., Martínez-Rodríguez, H., Piro, A. L., & Badenes, C. 2017b, ApJ, 851, 105
- Schwab et al. (2015) Schwab, J., Quataert, E., & Bildsten, L. 2015, MNRAS, 453, 1910
- Schwab & Rocha (2019) Schwab, J., & Rocha, K. A. 2019, ApJ, 872, 131
- Seitenzahl et al. (2009) Seitenzahl, I. R., Townsley, D. M., Peng, F., & Truran, J. W. 2009, Atomic Data and Nuclear Data Tables, 95, 96
- Spruit (1992) Spruit, H. C. 1992, A&A, 253, 131
- Spruit (2013) —. 2013, A&A, 552, A76
- Sussman et al. (1994) Sussman, M., Smereka, P., & Osher, S. 1994, JCP, 114, 146
- Suzuki et al. (2016) Suzuki, T., Toki, H., & Nomoto, K. 2016, ApJ, 817, 163
- Suzuki et al. (2019) Suzuki, T., Zha, S., Leung, S.-C., & Nomoto, K. 2019, ApJ, 881, 64
- Takahashi et al. (2019) Takahashi, K., Sumiyoshi, K., Yamada, S., Umeda, H., & Yoshida, T. 2019, ApJ, 871, 153
- Takahashi et al. (2013) Takahashi, K., Yoshida, T., & Umeda, H. 2013, ApJ, 771, 28
- Timmes & Arnett (1999) Timmes, F. X., & Arnett, D. 1999, ApJS, 125, 277
- Timmes & Woosley (1992) Timmes, F. X., & Woosley, S. E. 1992, ApJ, 396, 649
- Toki et al. (2013) Toki, H., Suzuki, T., Nomoto, K., Jones, S., & Hirschi, R. 2013, Phys. Rev. C, 88, 015806
- Tolstov et al. (2019) Tolstov, A., Nomoto, K., Sorokina, E., et al. 2019, ApJ, 881, 35
- Tominaga et al. (2013) Tominaga, N., Blinnikov, S. I., & Nomoto, K. 2013, ApJ, 771, L12
- Townsley et al. (2007) Townsley, D. M., Calder, A. C., Asida, S. M., et al. 2007, ApJ, 668, 1118
- Walecka (1975) Walecka, J. D. 1975, in Muon Physics, Volume II: Weak Interactions, ed. V. W. Hughes & C. S. Wu, 114
- Walecka (1995) Walecka, J. D. 1995, Oxford Stud. Nucl. Phys., 16, 1
- Wanajo et al. (2011) Wanajo, S., Janka, H.-T., & Müller, B. 2011, ApJ, 726, L15
- Wang & Spiteri (2007) Wang, R., & Spiteri, R. J. 2007, SIAM J. Numer. Anal., 45, 1871
- Zha et al. (2019) Zha, S., Chu, M.-C., Leung, S.-C., & Lin, L.-M. 2019, In Preparations