Thermopower of the electron-doped manganese pnictide LaMnAsO
Abstract
Upon chemical substitution of oxygen with fluor, LaMnAsO has been electron-doped in experiments, resulting in samples with remarkably high Seebeck coefficients of around at room temperature and 3% doping. Within the framework of density functional theory plus dynamical mean-field theory we are not only able to reproduce these experimental observations, but can also provide a thorough investigation of the underlying mechanisms. By considering electronic correlations in the half-filled Mn- shells, we trace the high Seebeck coefficient back to an asymmetry in the spectral function, which is due to emergence of incoherent spectral weight under doping and a strong renormalisation of the unoccupied states. This is only possible in correlated systems and cannot be explained by DFT-based band structure calculations.
I Introduction
In times of a drastic increase in energy consumption, the possibility to convert otherwise wasted heat into electric energy through thermoelectric devices becomes increasingly important [1; 2]. In addition to already commercially-used narrow-gap semiconductors, like \cePb(Se,Te) and \ceBi2Te3, research on thermoelectricity is also devoted to correlated materials, as it has been shown in recent years that electronic correlations can have a strong influence on the thermopower [3; 4; 5; 6; 7; 8; 9].
A class of strongly correlated materials for which experiments have repeatedly reported high thermopowers (Seebeck coefficients) are the manganese pnictides [10; 11; 12; 13; 14; 15; 16; 17; 18]. We focus on one example out of this material class, electron-doped \ceLaMnAsO, where doping can be accomplished experimentally by a fractional replacement of the O atoms with F [19; 18]. The experimental facts to be explained by theory are the following: The room-temperature Seebeck coefficient of polycrystalline \ceLaMnAsO_1-F_ samples changes from about at 3% doping to at 7% doping, but jumps to only at 10% doping [18].
On the theoretical side fairly little is known on the origin of the high Seebeck coefficients in manganese pnictides. Only for \ceBaMn2As2 the Seebeck coefficient was calculated within DFT and the constant scattering time approximation, which resulted in values of around for electron doping at [20]. However, the underlying microscopic details have not been studied, yet. Moreover, it has been pointed out in earlier works that the strong electron-electron interaction in the nominally half-filled Mn-3d shells is an important factor to understand the physical properties of manganese pnictides [21; 22; 23; 24]. In that sense, one also needs to take into account electron-electron interactions when studying thermoelectricity.
In this work, we use ab-initio density functional theory electronic structure calculations coupled to dynamical mean-field theory (DFT+DMFT) [25] to develop a theoretical understanding of the Seebeck coefficient in electron-doped \ceLaMnAsO. Using the virtual crystal approximation (VCA) to simulate electron-doping, not only the magnitude of the Seebeck coefficient, but also its doping dependence can be understood from the picture of a doped correlated insulator under the emergence of incoherent spectral weight due to inelastic electron-electron scattering. Such a description is not possible on the level of DFT, but requires at least local electronic correlations in the Mn- shells which are taken into account in DFT+DMFT. We emphasize that all calculations are performed without adjustable doping-dependent parameters. The interaction parameters and are fixed to their values of our previous study [24], where excellent agreement between theory and experiment for optical properties has been found.
After an outline of the theoretical framework, we will briefly review the necessary ingredients for high Seebeck coefficients from an electronic structure point of view, before we turn to the numerical calculations and comparisons between theoretical and experimental results.
II Methodology
To describe the electronic structure and the transport properties of electron-doped \ceLaMnAsO we carry out fully charge self-consistent density functional theory plus dynamical mean-field theory (DFT+DMFT) calculations using the TRIQS/DFTTools package [26; 27; 28; 29] in combination with WIEN2k [30; 31]. In addition to the following outline we refer the reader to our previous work [24] for further computational details.
For the DFT calculation we use -points in the full Brillouin zone (BZ) and the standard Perdew-Burke-Ernzerhof (PBE) [32] generalized gradient approximation (GGA) for the exchange-correlation functional. We use the crystal structure of the undoped compound (measured at in Ref. [33]) for all calculations. A test calculation with the experimental crystal structure at 10% electron doping [18] showed no substantial changes in our results. For all magnetic calculations we consider the C-type antiferromagnetic (AFM) ordering as determined experimentally for the undoped compound [34]. We treat electron doping using the virtual crystal approximation (VCA) in DFT by modifying the atomic numbers of the substituted atoms according to the desired doping levels. We assess the quality of this approximation by a comparison to super-cell calculations (see appendix A). The doping is of course taken into account also in the DMFT part of the calculation by adjusting the chemical potential to the corresponding electron count.
From the DFT Bloch states we construct projective Wannier functions for the Mn- orbitals in an energy window from to around the Fermi energy for the undoped compound, but adjust the upper boundary such that the same number of states at each doping level are included. In DMFT we work with a full rotationally invariant Slater Hamiltonian for the five Mn- orbitals with a Coulomb interaction of and a Hund’s coupling of () [24]. We choose the fully localized limit (FLL) as double counting correction [35], where we use the electron charge in the orbitals calculated from the fully self-consistently determined charge density. The TRIQS/CTHYB solver [36], which is based on continuous-time quantum Monte Carlo in the hybridization expansion [37; 38], is used to solve the impurity model on the Matsubara axis at an inverse temperature , corresponding to room temperature. We use the Beach’s stochastic method [39] for the analytic continuation of the self-energy to the real-frequency axis by constructing an auxiliary Green’s function .
Transport properties are evaluated within the linear response Kubo formalism (neglecting vertex corrections). The static conductivity tensor and the Seebeck tensor are given by [40; 41]
| (1) |
with and kinetic coefficients
| (2) |
where is the spin degeneracy and the Fermi function. The transport distribution is defined as
| (3) |
with the unit cell volume . In multi-band systems the interacting (correlated) spectral function and the velocities are Hermitian matrices in the band indices , which we omitted in the equations above. The velocities (matrix elements of the momentum operator) are calculated with the WIEN2k optic code [42], , from the charge self-consistent Bloch states.
For a crystal symmetry demanding diagonal rank-2 tensors, as it is the case for \ceLaMnAsO, the Seebeck coefficient in direction is given by
| (4) |
As all synthesized samples of \ceLaMnAsO (doped and undoped) are polycrystalline, we simulate a “polycrystalline” Seebeck coefficient by averaging over the three Cartesian coordinates [43]
| (5) |

III Ingredients for a high
Seebeck coefficient
Due to the -factor in the kinetic coefficient , Eq. (2), electron contributions ( ) and hole contributions () influence the Seebeck coefficient in an opposite way. Thus, getting a high , and in turn a high , requires a high electron-hole asymmetry around the chemical potential , i.e., a strongly asymmetric transport distribution , Eq. (3). There are two different mechanisms to promote a strong asymmetry in , as there are likewise two quantities entering : the velocity matrices and the spectral function .
The first scenario, shown in sketch Fig. 1 (a), is to have an asymmetric spectral function, e.g. with a steep slope of the spectrum close to the chemical potential [44; 45; 46]. A high positive Seebeck coefficient is expected if there is much more spectral weight below than above, and a high negative Seebeck coefficient for cases with much more spectral weight above than below. In the context of strongly correlated systems this picture was also discussed with regard to a sharp Kondo peak directly above or below the chemical potential [4; 5].
In the second scenario a high Seebeck coefficient is obtained from a strong asymmetry directly in , which can occur due to peculiar band shapes [6; 7; 47]. If we assume a constant isotropic scattering time , an approximation for the kinetic coefficients is [6]
| (6) | ||||
| (7) |
Here, the summation runs only over states in the range of . The velocities are characteristic velocities for the states above (A) and for states below (B) . For example, a linear dispersion in the vicinity of corresponds to , and thus will be small, as it is the case for ordinary metals [6]. The optimal situation for a high are “pudding-mold”-like bands, which are for instance non or only weakly dispersive below and show a strongly-dispersive behavior above , see sketch Fig. 1 (b). If is located close to the flat portion of such a band and the temperature is high enough, we find , and consequently . For a band with its flat portion below this results in a negative .
Of course, and are intertwined, and for real materials the influence of the electronic structure on the thermoelectric properties should be always considered as an interplay of these two ingredients [48; 8]. A band structure showing a strong asymmetry in usually comes with an asymmetry in , too. This can be such that it partially compensate the effect of the asymmetry in , as demonstrated for \ceNa_0.7CoO2 [48]. We show below that also the opposite behavior, where and contribute with the same sign to , is possible. Coming back to the sketch in Fig. 1 (b), this happens when the corresponding asymmetry in is such that the derivative of the Fermi function in the kinetic coefficient (Eq. (2)) picks up more spectral weight above than below. Then, the asymmetries in and contribute both with a negative sign to .
An indicator, which we will use in this work, to measure the influence of the asymmetry in the spectral function on , is to evaluate Eqs. (1-3) with . In this case, the velocities drop out and we end up with
| (8) |
If is significantly different from , we can infer that the asymmetry in the velocities is important for the Seebeck coefficient. If , the velocities are of less importance, and a high Seebeck coefficient is driven mainly by the asymmetry in the spectral function.
IV Results
We start with the discussion of the Seebeck coefficient of \ceLaMnAsO at 5% electron doping, which was experimentally determined to be [18]. First, we calculate directly from spin-polarized (antiferromagnetic) DFT assuming a constant isotropic scattering time (const.- approximation) 111In the TRIQS/DFTTools transport code we achieve this by setting with . Note that the actual value of is not relevant as it cancels in the calculation of .. This approximation results in a high negative value of . On the contrary, when setting the velocity matrices (Eq. (8)) we only obtain , showing the importance of the asymmetry in . This is also apparent in the DFT band structure (Fig. 2, top). The DFT picture is that of a band insulator which becomes metallic under doping as the Fermi energy is “shifted” into the unoccupied states. The doping mainly affects the hole pockets of orbital character at the A and M points. At the M point the bands are rather flat, resembling a mold-like shape with the bottom of the bands lying below the Fermi energy. This is the origin of the strong influence of on . The associated asymmetry in the density of states (DOS), see bottom panel of Fig. 2, does not compensate the asymmetry, but rather gives a contribution with the same sign and implies that at room temperature more relevant states above the Fermi energy than below contribute to . We conclude that on the DFT level the asymmetries in the DOS and are both of similar relevance for .
This picture drastically changes when we calculate from the antiferromagnetic (AFM) DFT+DMFT solution instead of using the DFT+const.- approximation. The resulting is , which is in remarkably good agreement with the experimental value. Setting leads to only a slight reduction of by about 15%. In sharp contrast to the DFT+const.- result, this reveals that the asymmetry in the DFT+DMFT spectral function is the major factor, whereas the influence of the velocity asymmetries is negligible.
To gain a better understanding of this observation, we discuss how electronic correlations shape the spectral function under doping (Fig. 3, bottom). In comparison to undoped \ceLaMnAsO (dashed line), doping has two major effects: First, the edge of the spectral function between and in the undoped compound is pushed towards with increased doping. Although the slope of this edge is steeper in comparison to the undoped spectral function, it does not substantially change for the different doping levels. Second, the insulating state is suppressed and spectral weight at and below the chemical potential emerges. The spectral weight below the chemical potential increases with doping level and develops into a shoulder, well visible at 10% doping. We emphasize that this spectral weight is not a result of the displacement of quasi-particle states, but is entirely incoherent and originates from inelastic scattering due to electronic correlations.
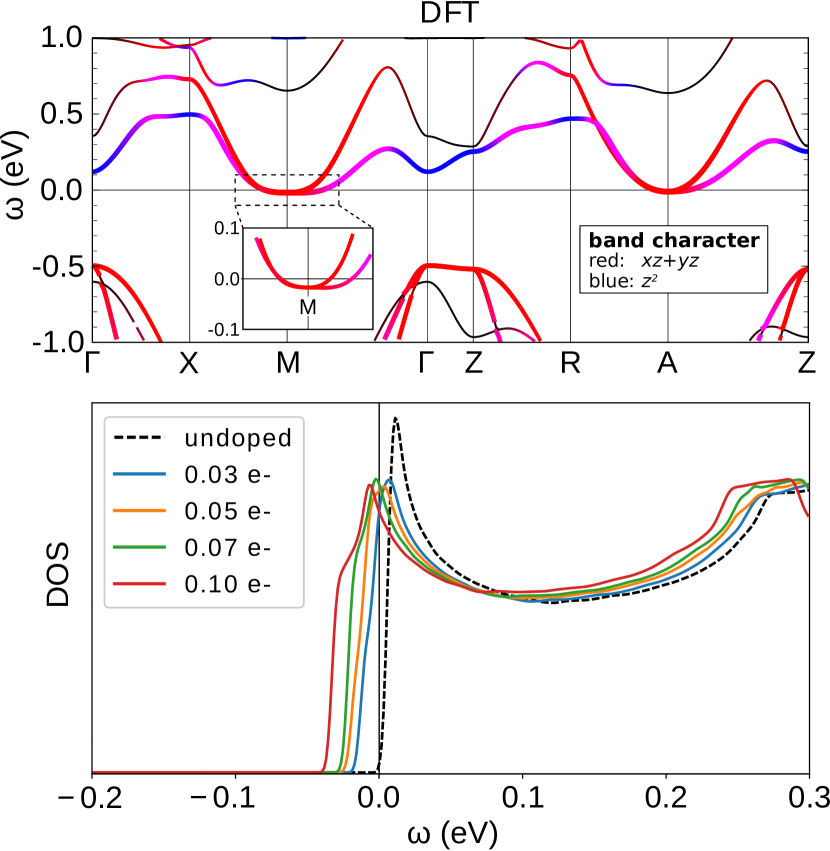
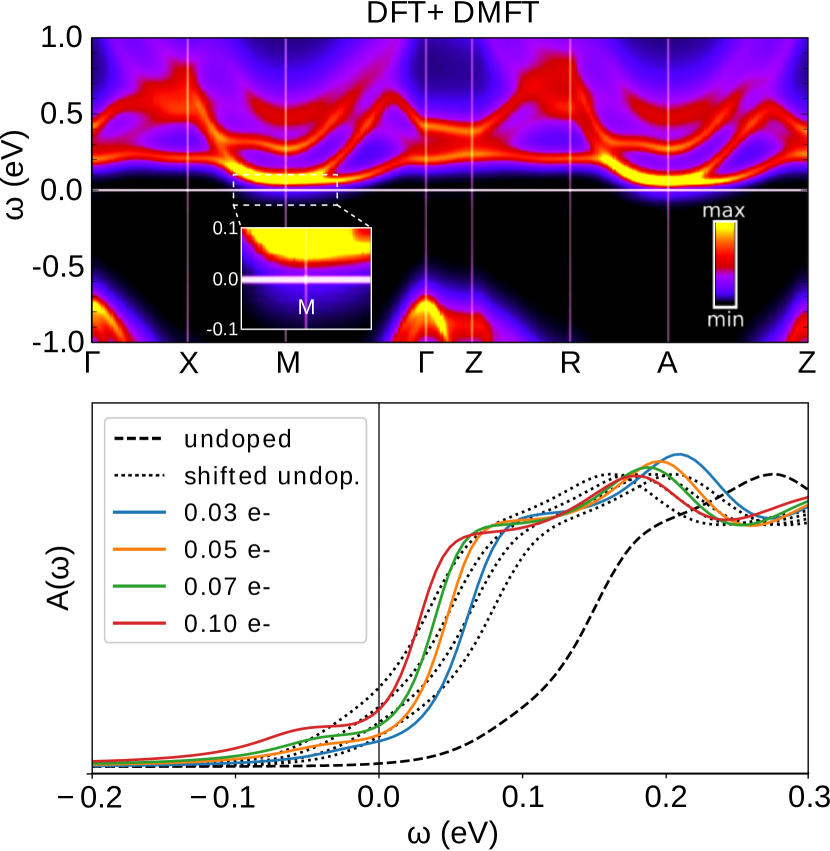
This is also visible in the -resolved spectral function (Fig. 3, top), where the chemical potential cuts trough incoherent spectral weight of the unoccupied states. However, the most prominent spectral features at the A and M points lie above the chemical potential, which leads to a considerable spectral weight asymmetry. This is clearly different from the DFT band structure, where the coherent bands cross the Fermi energy (see Fig. 2, top). Additionally, around the A and M points we find spectral weight which has a stronger pronounced flat part than the corresponding DFT bands, cf. the path from M to in the top panels of Figs. 2 and 3. In general, spectral features are much less dispersive in the DFT+DMFT result as a consequence of the overall renormalization of the unoccupied states.
Additionally, we show in the bottom panel of Fig. 3 the spectral functions which are generated by a rigid shift of the undoped spectral function according to the different doping levels (dotted black lines). The fact that not much spectral weight is present in the first above the chemical potential results in a substantial shift already at the lowest doping level of 3%. A further increase of the doping leads to only small additional shifts. However, these simple energy shifts do not correctly reproduce the doped DFT+DMFT results, demonstrating the importance of separate fully charge self-consistent DFT+DMFT calculations at each doping level.
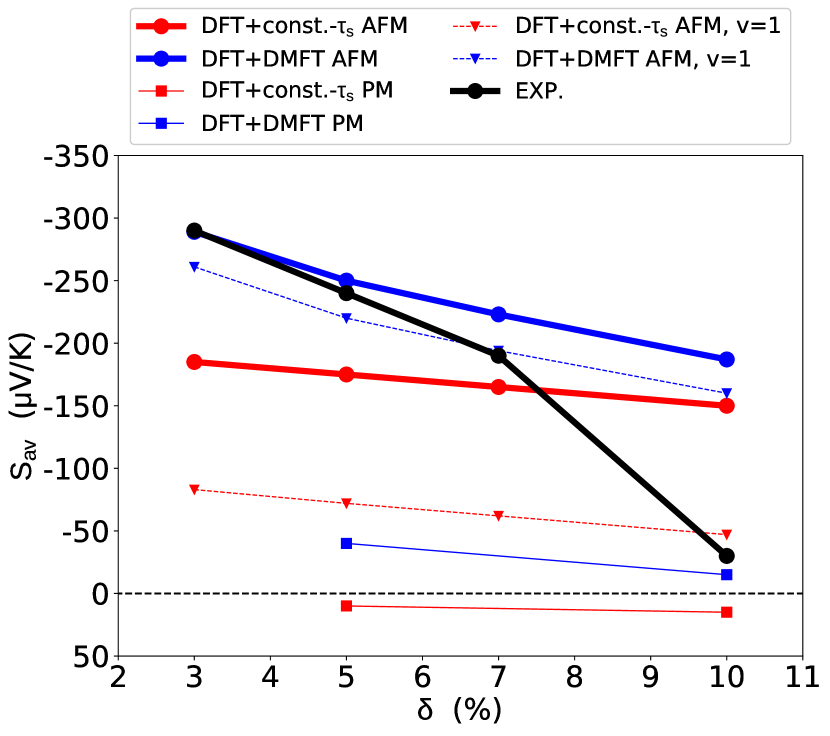
Now, we turn to the doping dependence of the Seebeck coefficient (Fig. 4). The DFT+DMFT in the AFM phase is at 3% doping and increases up to at 10% doping (blue circles). At a doping of 3% the calculated value coincides with the experimental data [18] (black circles) and is still in a good agreement at doping levels of 5 and 7%. On the other hand, a paramagnetic (PM) DFT+DMFT calculation (blue squares) of yields only at 5% doping. The large discrepancy at 5% between the PM and the AFM result suggest that the magnetic ground state is an essential ingredient to describe the thermoelectric properties of \ceLaMnAsO at the lower doping levels.
The experimental data shows a strong change of to only when doping is increased from 7 to 10%. A similar behavior has been observed for \ceSmMnAsO_1- samples [16]. In this compound the Seebeck coefficient is for an oxygen-deficiency of at room temperature, but upon a further increase to it jumps to only . In \ceSmMnAsO_1- this change in , which is also accompanied by a strong increase of the conductivity, is connected to the transition to the PM state. Although the Néel temperature in the case of \ceF-doped \ceLaMnAsO has not been measured, the conductivity does change abruptly by two orders of magnitude from 7 to 10% doping [18]. Furthermore, experiments demonstrated that the AFM phase can be destructed under H doping of about 8-14% [51]. At 10% doping our calculation in the PM phase is in accordance with the experimental value, which can be seen as a further hint that the suppression of from 7 to 10% doping is probably connected to the AFM-PM transition. However, in this work we do not intend to investigate the phase transition from an AFM to a PM state within DFT+DMFT. It is well know that DMFT is not too reliable in predicting the absolute value of magnetic transition temperatures [24; 52; 53], as well as the transition as function of doping, which has been discussed for example in the context of high- cuprate superconductors [54; 55].
The doping dependence of , see Fig. 4, shows that the DFT+const.- approximation cannot provide an accurate description over the full range of doping levels. For example, at 3% doping is by more than smaller than the DFT+DMFT value and the experimental data. From the evaluation of (red and blue triangles) we see that the fundamental difference in the interpretation of within DFT+DMFT and DFT+const.-, as discussed above at 5% doping, applies to the whole studied doping range. We finally point out that in contrast to PM DFT+DMFT the non-magnetic DFT+const.- calculations result even in a positive Seebeck coefficient of at 5% doping and at 10% doping (red squares).
For thermoelectric applications not only is crucial, but more so the power-factor (numerator of ). The calculated out-of-plane conductivity of electron-doped \ceLaMnAsO is about a factor 50 lower in our DFT+DMFT calculations than the in-plane conductivity . This is a consequence of the quasi-two-dimensional nature of \ceLaMnAsO [24]. The crystal symmetries demand and , and thus the averaged Seebeck coefficient is mainly determined by its in-plane value, (Eq. (5)). However, we find that the quasi-two-dimensional nature is not pronounced in the direction-dependent Seebeck coefficient itself. For all studied doping levels in the AFM phase is less than smaller than . Putting everything together, the in-plane direction offers a slightly higher Seebeck coefficient and exhibits a substantially higher conductivity than the out-of-plane direction. Therefore, we predict that a possible single-crystalline \ceLaMnAsO_1-F_ sample should show the highest power-factor () if thermoelectricity is harvested in the in-plane direction.
V Conclusion
We studied the electronic influences on the Seebeck coefficient of electron-doped \ceLaMnAsO within the framework of fully charge self-consistent DFT+DMFT calculations. To model experimentally synthesized \ceLaMnAsO_1-F_ we used the virtual crystal approximation at electron doping levels of 3, 5, 7 and 10%. In DFT the doping pushes the bottom of the flat bands below the Fermi energy. On the contrary, the incorporation of electronic correlations within DMFT shows that doping leads to incoherent weight at and below the chemical potential, whereas the renormalization of the unoccupied states results in strongly-pronounced spectral features located directly above it. Both DFT and DFT+DMFT calculations predict negative Seebeck coefficients, however with completely opposing underlying mechanisms. While the DFT+const.- approximation points towards a picture where the asymmetry in the velocities is pivotal, DFT+DMFT traces the Seebeck coefficient almost exclusively back to the asymmetry of the correlated spectral function. Therefore, our calculations demonstrate that the interpretation of the Seebeck coefficient in materials with strong electronic correlations and non-negligible incoherent spectral weight requires to go beyond the constant scattering time approximation. Considering finite life-time effects within the DFT+DMFT framework yields a higher Seebeck coefficient in electron-doped \ceLaMnAsO than what would be anticipated from DFT, and is also in much better agreement with experimental data. The emergence of incoherent spectral weight under doping is unique to correlated systems, and could potentially offer new routes in the engineering of thermoelectric materials.
Acknowledgements.
We thank R. Triebl and J. Mravlje for useful discussions. The authors acknowledge financial support from the Austrian Science Fund FWF (Y746, P26220, F04103) as well as NAWI Graz. Calculations have been performed on the Vienna Scientific Cluster (VSC). The Flatiron Institute is a division of the Simons Foundation.Appendix A Virtual Crystal Approximation
A simple way of incorporating the effect of doping within band-structure methods is the virtual crystal approximation (VCA). Computationally, the VCA is efficient, because calculations can be carried out at the same cost as for the corresponding undoped structure. However, the VCA neglects charge localization and assumes that there is a virtual atom on all sites which interpolates between the original atom and the dopant. This picture is only adequate for atoms with similar radii and the same number of core electrons. Another possibility to take doping effects into account is the construction of super-cells (SC), where the doped atoms are directly replaced by the dopant in a larger unit cell. Super-cells assume a long-range order of the dopants in the crystal matrix. Using this approach within DFT+DMFT is certainly feasible at high enough doping levels, but it would be demanding for the lower doping levels used in this work due to the size of super-cells needed.
To assess the applicability of the VCA to \ceLaMnAsO_1-F_ we compare our WIEN2k calculations to super-cell calculations carried out with VASP 5.4.1 [56; 57; 58; 59] with the projector augmented wave (PAW) method [60; 61] and pseudopotentials v.54 222The pseudopotentials are: La 06Sep2000, Mn 06Sep2000, As 22Sep2009, O 08Apr2002, F 08Apr2002, Sr_sv 07Sep2000.. The plane wave energy cutoff of is set to . Like in the WIEN2k calculations, the PBE density functional and the same crystal structure parameters are used. The full BZ of the super-cell is sampled with a -centered Monkhorst-Pack -grid [63], whereas for the WIEN2k calculation -points in the BZ of the initial cell, which is 9 times smaller in real space, are used. To be consistent with the experiment, we replaced the O atoms by F atoms in a super-cell, which corresponds to a doping level of (see inset of Fig. 5). In WIEN2k the VCA is employed by adjusting the atomic number of the O atoms to . We note that the choice of WIEN2k for the VCA calculation and VASP for super-cells is intrinsic to the differences in these two DFT codes. In the full-electron code WIEN2k large super-cell calculations are demanding. On the other hand, VASP is a pseudo-potential code, which makes it cumbersome to use the VCA.
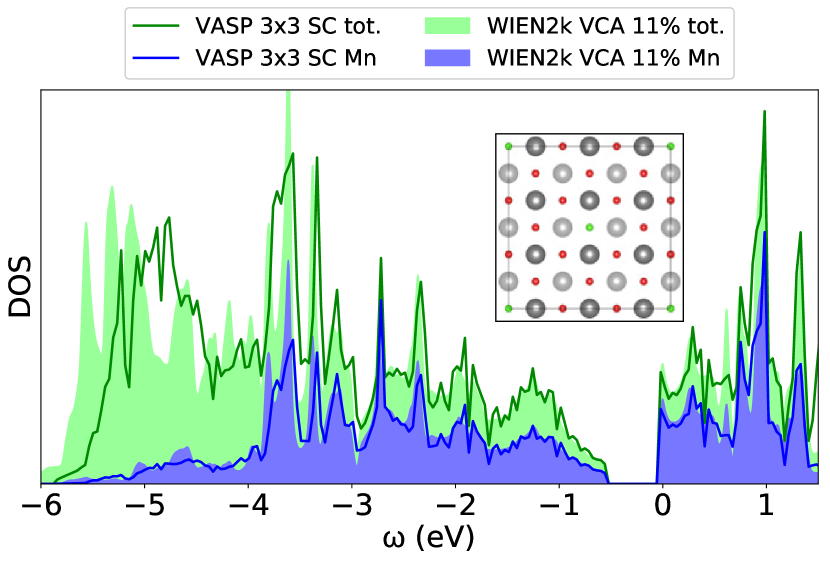
The agreement of the VCA with the super-cell calculations, Fig. 5, is especially good in the energy region with no or only weak hybridization of the La-O and Mn-As layers, which is roughly between and . Note that the Mn- projected DOS are in even better agreement than the total DOS. The former is the more important quantity as only the Mn- orbitals are treated within DMFT. Of course, in energy regions exhibiting dopant states one cannot expect a good agreement between the VCA and the super-cell calculation. This is visible from to about , where the DOS is mainly determined by O states, i.e. the properties of the La-O layer.
Super-cell calculations with a different arrangement of the dopants in
the unit cell did not substantially change the DOS. We also compared
the VCA to a super-cell calculation for the non-spin-polarized state
and found an agreement on the same level as for the spin-polarized
calculations (not shown). Furthermore, calculations for the undoped compound
gave perfect agreement between WIEN2k and VASP. As we are mainly interested
in spectral properties in the vicinity of the Fermi energy, which are to a great
extent determined by the Mn-As layer, the comparison presented in
Fig. 5 underlines that VCA is an eligible approximation
for the doping levels considered in this study.
References
- Snyder and Toberer [2008] G. J. Snyder and E. S. Toberer, Nat. Mater. 7, 105 (2008).
- Liu et al. [2015] W. Liu, Q. Jie, H. S. Kim, and Z. Ren, Acta Mater. 87, 357 (2015).
- Tomczak [2018] J. M. Tomczak, J. Phys. Condens. Matter 30, 183001 (2018).
- Held et al. [2009] K. Held, R. Arita, V. I. Anisimov, and K. Kuroki, “The LDA+DMFT Route to Identify Good Thermoelectrics,” in Properties and Applications of Thermoelectric Materials: The Search for New Materials for Thermoelectric Devices (Springer Netherlands, Dordrecht, 2009) pp. 141–157.
- Haule and Kotliar [2009] K. Haule and G. Kotliar, “Thermoelectrics Near the Mott Localization-Delocalization Transition,” in Properties and Applications of Thermoelectric Materials: The Search for New Materials for Thermoelectric Devices (Springer Netherlands, Dordrecht, 2009) pp. 119–131.
- Kuroki and Arita [2007] K. Kuroki and R. Arita, J. Phys. Soc. Jpn. 76, 083707 (2007).
- Arita et al. [2008] R. Arita, K. Kuroki, K. Held, A. V. Lukoyanov, S. Skornyakov, and V. I. Anisimov, Phys. Rev. B 78, 115121 (2008).
- Wissgott et al. [2011] P. Wissgott, A. Toschi, G. Sangiovanni, and K. Held, Phys. Rev. B 84, 085129 (2011).
- Mravlje and Georges [2016] J. Mravlje and A. Georges, Phys. Rev. Lett. 117, 036401 (2016).
- Wang et al. [2009] H. F. Wang, K. F. Cai, H. Li, L. Wang, and C. W. Zhou, J. Alloy. Comp. 477, 519 (2009).
- Wang et al. [2012] H. F. Wang, K. F. Cai, and S. Chen, J. Mater. Sci. Mater. Electron. 23, 2289 (2012).
- Wang and Petrovic [2013] K. Wang and C. Petrovic, Appl. Phys. Lett. 103, 192104 (2013).
- Yanagi et al. [2009] H. Yanagi, T. Watanabe, K. Kodama, S. Iikubo, S. Shamoto, T. Kamiya, M. Hirano, and H. Hosono, J. Appl. Phys. 105, 093916 (2009).
- Sun et al. [2012] Y.-L. Sun, J.-K. Bao, Y.-K. Luo, C.-M. Feng, Z.-A. Xu, and G.-H. Cao, EPL 98, 17009 (2012).
- Kayanuma et al. [2009] K. Kayanuma, H. Hiramatsu, T. Kamiya, M. Hirano, and H. Hosono, J. Appl. Phys. 105, 073903 (2009).
- Shiomi et al. [2011] Y. Shiomi, S. Ishiwata, Y. Taguchi, and Y. Tokura, Phys. Rev. B 84, 054519 (2011).
- Simonson et al. [2012] J. W. Simonson, Z. P. Yin, M. Pezzoli, J. Guo, J. Liu, K. Post, A. Efimenko, N. Hollmann, Z. Hu, H.-J. Lin, C.-T. Chen, C. Marques, V. Leyva, G. Smith, J. W. Lynn, L. L. Sun, G. Kotliar, D. N. Basov, L. H. Tjeng, and M. C. Aronson, PNAS 109, E1815 (2012).
- Ryu [2012] G. Ryu, Study on exploration for superconducting transition metal compounds with low-dimensionality, Ph.D. thesis, Tokyo Institute of Technology, Japan (2012).
- Naito et al. [2014] A. Naito, Y. Morosawa, T. Watanabe, Y. Takano, and K. Takase, JPS Conf. Proc. 1, 036401 (2014).
- An et al. [2009] J. An, A. S. Sefat, D. J. Singh, and M.-H. Du, Phys. Rev. B 79, 075120 (2009).
- McNally et al. [2015] D. E. McNally, S. Zellman, Z. P. Yin, K. W. Post, H. He, K. Hao, G. Kotliar, D. Basov, C. C. Homes, and M. C. Aronson, Phys. Rev. B 92, 115142 (2015).
- McNally et al. [2014] D. E. McNally, J. W. Simonson, K. W. Post, Z. P. Yin, M. Pezzoli, G. J. Smith, V. Leyva, C. Marques, L. DeBeer-Schmitt, A. I. Kolesnikov, Y. Zhao, J. W. Lynn, D. N. Basov, G. Kotliar, and M. C. Aronson, Phys. Rev. B 90, 180403 (2014).
- Yao et al. [2011] Y. X. Yao, J. Schmalian, C. Z. Wang, K. M. Ho, and G. Kotliar, Phys. Rev. B 84, 245112 (2011).
- Zingl et al. [2016] M. Zingl, E. Assmann, P. Seth, I. Krivenko, and M. Aichhorn, Phys. Rev. B 94, 045130 (2016).
- Kotliar et al. [2006] G. Kotliar, S. Y. Savrasov, K. Haule, V. S. Oudovenko, O. Parcollet, and C. A. Marianetti, Rev. Mod. Phys. 78, 865 (2006).
- Parcollet et al. [2015] O. Parcollet, M. Ferrero, T. Ayral, H. Hafermann, I. Krivenko, L. Messio, and P. Seth, Comput. Phys. Commun. 196, 398 (2015).
- Aichhorn et al. [2016] M. Aichhorn, L. Pourovskii, P. Seth, V. Vildosola, M. Zingl, O. E. Peil, X. Deng, J. Mravlje, G. J. Kraberger, C. Martins, M. Ferrero, and O. Parcollet, Comput. Phys. Commun. 204, 200 (2016).
- Aichhorn et al. [2009] M. Aichhorn, L. Pourovskii, V. Vildosola, M. Ferrero, O. Parcollet, T. Miyake, A. Georges, and S. Biermann, Phys. Rev. B 80, 085101 (2009).
- Aichhorn et al. [2011] M. Aichhorn, L. Pourovskii, and A. Georges, Phys. Rev. B 84, 054529 (2011).
- Blaha et al. [2001] P. Blaha, K. Schwarz, G. Madsen, D. Kvasnicka, and J. Luitz, WIEN2k, An augmented Plane Wave + Local Orbitals Program for Calculating Crystal Properties (Techn. Universitaet Wien, Austria, 2001).
- Schwarz and Blaha [2003] K. Schwarz and P. Blaha, Comput. Mater. Sci. 28, 259 (2003).
- Perdew et al. [1997] J. P. Perdew, K. Burke, and M. Ernzerhof, Phys. Rev. Lett. 78, 1396 (1997).
- Emery et al. [2010] N. Emery, E. J. Wildman, J. M. S. Skakle, G. Giriat, R. I. Smith, and A. C. Mclaughlin, Chem. Commun. 46, 6777 (2010).
- Emery et al. [2011] N. Emery, E. J. Wildman, J. M. S. Skakle, A. C. Mclaughlin, R. I. Smith, and A. N. Fitch, Phys. Rev. B 83, 144429 (2011).
- Czyżyk and Sawatzky [1994] M. T. Czyżyk and G. A. Sawatzky, Phys. Rev. B 49, 14211 (1994).
- Seth et al. [2016] P. Seth, I. Krivenko, M. Ferrero, and O. Parcollet, Comput. Phys. Commun. 200, 274 (2016).
- Werner et al. [2006] P. Werner, A. Comanac, L. de’ Medici, M. Troyer, and A. J. Millis, Phys. Rev. Lett. 97, 076405 (2006).
- Werner and Millis [2006] P. Werner and A. J. Millis, Phys. Rev. B 74, 155107 (2006).
- Beach [2004] K. S. D. Beach, ArXiv e-prints (2004), arXiv:cond-mat/0403055 .
- Mahan [2000] G. D. Mahan, Many-Particle Physics (Springer US, New York, 2000).
- Oudovenko et al. [2006] V. S. Oudovenko, G. Pálsson, K. Haule, G. Kotliar, and S. Y. Savrasov, Phys. Rev. B 73, 035120 (2006).
- Ambrosch-Draxl and Sofo [2006] C. Ambrosch-Draxl and J. O. Sofo, Comput. Phys. Commun. 175, 1 (2006).
- Singh [2012] D. J. Singh, Phys. Rev. B 86, 174507 (2012).
- Heremans et al. [2008] J. P. Heremans, V. Jovovic, E. S. Toberer, A. Saramat, K. Kurosaki, A. Charoenphakdee, S. Yamanaka, and G. J. Snyder, Science 321, 554 (2008).
- Sootsman et al. [2009] J. R. Sootsman, D. Y. Chung, and M. G. Kanatzidis, Angew. Chem. Int. Ed. 48, 8616 (2009).
- Tomczak et al. [2013] J. M. Tomczak, K. Haule, and G. Kotliar, “Thermopower of the Correlated Narrow Gap Semiconductor FeSi and Comparison to RuSi,” in New Materials for Thermoelectric Applications: Theory and Experiment (Springer Netherlands, Dordrecht, 2013) pp. 45–57.
- Mori et al. [2013] K. Mori, H. Sakakibara, H. Usui, and K. Kuroki, Phys. Rev. B 88, 075141 (2013).
- Wissgott et al. [2010] P. Wissgott, A. Toschi, H. Usui, K. Kuroki, and K. Held, Phys. Rev. B 82, 201106 (2010).
- Note [1] In the TRIQS/DFTTools transport code we achieve this by setting with . Note that the actual value of is not relevant as it cancels in the calculation of .
- [50] E. Assmann, “Spaghetti-prima.py,” [http://eassmann.github.io/prima.py], software Version 0.3.
- Hanna et al. [2013] T. Hanna, S. Matsuishi, K. Kodama, T. Otomo, S. Shamoto, and H. Hosono, Phys. Rev. B 87, 020401 (2013).
- Mravlje et al. [2012] J. Mravlje, M. Aichhorn, and A. Georges, Phys. Rev. Lett. 108, 197202 (2012).
- Lichtenstein et al. [2001] A. I. Lichtenstein, M. I. Katsnelson, and G. Kotliar, Phys. Rev. Lett. 87, 067205 (2001).
- Maier et al. [2005] T. Maier, M. Jarrell, T. Pruschke, and M. H. Hettler, Rev. Mod. Phys. 77, 1027 (2005).
- Otsuki et al. [2014] J. Otsuki, H. Hafermann, and A. I. Lichtenstein, Phys. Rev. B 90, 235132 (2014).
- Kresse and Hafner [1993] G. Kresse and J. Hafner, Phys. Rev. B 47, 558 (1993).
- Kresse and Hafner [1994] G. Kresse and J. Hafner, Phys. Rev. B 49, 14251 (1994).
- Kresse and Furthmüller [1996a] G. Kresse and J. Furthmüller, Comput. Mater. Sci. 6, 15 (1996a).
- Kresse and Furthmüller [1996b] G. Kresse and J. Furthmüller, Phys. Rev. B 54, 11169 (1996b).
- Blöchl [1994] P. E. Blöchl, Phys. Rev. B 50, 17953 (1994).
- Kresse and Joubert [1999] G. Kresse and D. Joubert, Phys. Rev. B 59, 1758 (1999).
- Note [2] The pseudopotentials are: La 06Sep2000, Mn 06Sep2000, As 22Sep2009, O 08Apr2002, F 08Apr2002, Sr_sv 07Sep2000.
- Monkhorst and Pack [1976] H. J. Monkhorst and J. D. Pack, Phys. Rev. B 13, 5188 (1976).
- Momma and Izumi [2011] K. Momma and F. Izumi, J. Appl. Crystallogr. 44, 1272 (2011).