Geometry-controlled Failure Mechanisms of Amorphous Solids on the Nanoscale
Abstract
Amorphous solids, confined on the nano-scale, exhibit a wealth of novel phenomena yet to be explored. In particular, the response of such solids to a mechanical load is not well understood and, as has been demonstrated experimentally, it differs strongly from bulk samples made of the same materials. Failure patterns and mechanisms are strongly affected by the geometry of the confinement and the interplay between interfacial effects in the sample and the time scale, imposed by an external mechanical field. Here, we present the mechanism of cavity formation in a confined model glass, subjected to expansion with a constant strain rate. This system is studied for varying geometric aspect ratio and sample size. Our results show that for a given temperature and straining condition, the sample shows cavitation when the aspect ratio reaches a critical value and below this aspect ratio the sample breaks by forming a neck. The critical aspect ratio is associated with a critical curvature of the neck that depends on strain rate and temperature. If this critical curvature is exceeded, the free energy of the system is minimized by the formation of a cavity. Our study reveals a novel mechanism of cavity formation on the nanoscale. This is probably a generic mechanism for material’s failure in small confined systems under mechanical load.
Introduction
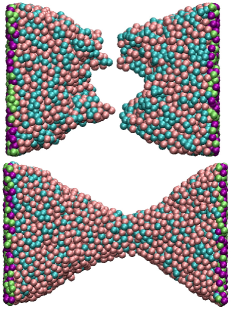
Understanding the failure mechanisms of amorphous solids under external loading is one of the most active research fields amongst scientific as well as engineering community Argon (1979); Maloney and Lemaître (2006, 2006); Hentschel et al. (2010); Karmakar et al. (2010a, b); Dauchot et al. (2011); Lagos and Das (2016); Hufnagel et al. (2016); Chen (2008); Ashby and Greer (2006); Rodney et al. (2011); Schuh et al. (2007); Shrivastav et al. (2016). This is mainly due to its importance in fundamental science and industrial applications Greer (1995); Chen (2008). It is experimentally known that amorphous solids have much larger failure strength than their crystalline counterpart with similar compositions, but amorphous solids show catastrophic failure which severely limits their applicability as a useful design material Binder et al. (2005); Schroers and Johnson (2004); Schuster et al. (2007); Schuh et al. (2007); Scudino et al. (2015); Sun and Wang (2015); Hufnagel et al. (2016). Bulk materials that show catastrophic failure by forming cracks under applied load are generically termed as brittle materials Schroers and Johnson (2004); Guo et al. (2007); Crété et al. (2014); Li et al. (1992). On the other hand, some materials show significant plastic deformation before final failure and they are called ductile materials Singh et al. (2016); Chaudhuri and Horbach (2016). In Fig. 1, we show representative failure morphology for brittleness and ductility for small systems on the nanoscale. For brittle failure (top panel) the rough failure surface is noticeable while for ductile failure (bottom panel), the neck formation is very prominent. Reducing brittleness of strongly confined amorphous solids is of considerable practical importance.
Recent studies Volkert et al. (2008); Chen et al. (2013); Luo et al. (2010); Jang and Greer (2010); Greer and De Hosson (2011); Kraft et al. (2010) suggest that the nature of plasticity in materials depends very significantly on their size. It has been demonstrated experimentally that failure patterns and mechanisms in nano-scale systems can be very different from those of bulk samples of the same materials. Typically, a bulk metallic glass can sustain only up to 2% strain before failing via brittle crack formation. However, uniaxial strain experiments, performed in Ref.Luo et al. (2010) on metallic glasses with different sample sizes, show that the strain before failure can increase up to 200% when the sample size is reduced to 100nm. For such nano-sized sample, it has been also found that the sample may break via the formation of necks. These necks can shrink to chain-like structures as thin as a few atomic layers. This necking in nano-scale samples also indicate a ductile rather than a brittle behaviour of the material in response to deformation.
The change of the mechanical response with reducing sample size has been also observed in uniaxial compression experiments. In Ref. Volkert et al. (2008), such experiments on pilers made of metallic glasses are presented. Here, it is shown that pilers with diameters larger than 100 nm show prominent shear band formation, a hallmark of brittle failure. However, pilers that are less than 100 nm in diameter display homogeneous plastic deformation without shear localization. Similarly, Greer et al. Jang and Greer (2010) have demonstrated that size reduction affects the brittle-to-ductile transition in metallic glasses. They have also indicated that the brittle-to-ductile transition is associated with a critical size. Several experiments and simulations of metallic glasses confirm that size reduction increases the material ductility due to surface states Luo et al. (2010); Chen et al. (2013). Thus, it is clear that plasticity and failure mechanisms for a material can change very significantly with the physical size and dimension of the sample. A microscopic understanding of these observations would be very important for the systematic development of nano-materials with specific mechanical properties.
The goal of the present study is to understand the nature of plasticity when the system size is reduced from bulk to nano-scale and also to find out the microscopic origin of the observed differences. We have performed uniaxial elongation simulations of a model glass in nano-confinement in order to understand the effects of small sample size on the failure mechanisms and investigate the controlling parameters that determine whether a material will fail via neck formation or via the formation of cavities.
Results
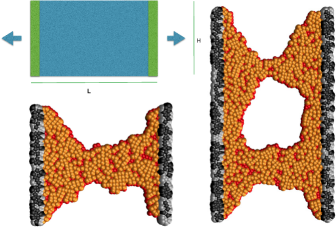
We have performed numerical simulations in which we chose a model glass former (see Supplementary Material (SM) for further details of the model) and prepared an amorphous solid by cooling the supercooled liquid at a certain cooling rate (see the method section for details). Then, we put a uniaxial load on it until the material breaks completely. In all these systems the numerical experiments are designed as follows. We first equilibrate the model liquids at some high temperature and then cool it to a low temperature below the experimental glass transition temperature defined as the temperature where the relaxation time reaches a value of . Then, at that low temperature, we put a barostat and perform constant pressure and temperature (NPT) simulations at zero pressure such that one can remove the periodic boundary condition. We now define two side walls at the two ends of the solid in the -direction by freezing the motion of the particles in the two end regions as depicted in the cartoon in Fig. 2.
The typical size of this wall is around three inter-particle diameters. The other boundaries are made free. Next, the walls are moved by an increment equal in size and opposite in sign, i.e., the system is subjected to uniaxial strain. To quantify the maximum deformation that a system can withstand before the failure, we have defined the maximum strain as
| (1) |
where is the initial (before pulling) length of the system along the tension direction ( direction) and is the final length when the system breaks into two parts. We repeat this numerical simulation for different aspect ratio ranging from to . is the width of the system as shown in the schematic diagram in Fig. 2. We have done extensional simulations for different strain rates and temperatures keeping for all the systems with different aspect ratio, .
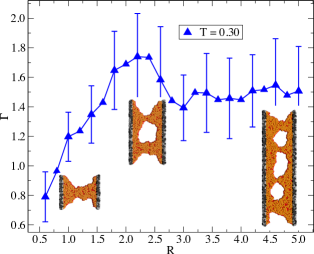
In Fig. 3, we have plotted the maximum deformation as a function of aspect ratio, , for at a strain rate . The observation that as one decreases size of the sample (aspect ratio in this case) the system starts to show significant change in ductility is in complete agreement with the experimental results reported in Refs. Luo et al. (2010); Volkert et al. (2008); Jang and Greer (2010); Chen et al. (2013). The change in maximum strain is around 40% with decreasing aspect ratio at this strain rate. One expects this variation to become even larger at strain rates that are small and comparable to experimental strain rates Sergueeva et al. (2004). As discussed in the subsequent paragraphs, the variation indeed becomes larger with decreasing strain rate. Even more surprising results that need experimental validation is the existence of a critical aspect ratio, , below which one no longer sees an increase in maximum strain, . actually starts to decrease very rapidly with decreasing aspect ratio below this critical aspect ratio, . Thus, the vs. curve shows a peak which signifies the existence of a favoured geometric aspect ratio at which the material will show maximum ductility.
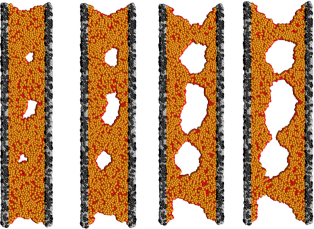
Next, we try to characterize the failure patterns as one increases the aspect ratio, to elucidate the reason for the existence of a critical aspect ratio and a maximum ductility. As shown in Fig. 3, we found that at very small aspect ratio, , the system always breaks via neck formation and the failure mechanisms changes very sharply at the critical aspect ratio at which one observes the appearance of a single cavity. With further loading, the cavity increases in size and eventually the cavity becomes large enough that the system breaks into two fragments. As one further increases the aspect ratio, the number of cavities increases by an integer number and one observes the appearance of multiple cavities. At these aspect ratios, the system eventually fails by the merger of cavities into a larger cavity in complete agreement with experimental observations Ding et al. (2015); Maaß et al. (2015); An et al. (2011); Murali et al. (2011); Guan et al. (2013); Singh et al. (2016). The appearance of cavities above a critical aspect ratio indicates a ductile-to-brittle transition in the material with increasing system size. It has been suggested that the change from brittle to ductile behavior with decreasing system size is related to the enhanced relaxation on the surface layer Jang and Greer (2010); Dauchot et al. (2011); Lagos and Das (2016); Steif (1983); Chen et al. (2013); Guo et al. (2007). To further understand this phenomenon and the effect of surface-induced relaxation, we have done similar uniaxial elongation simulations at different strain rate and temperature.
Effect of strain rate and temperature
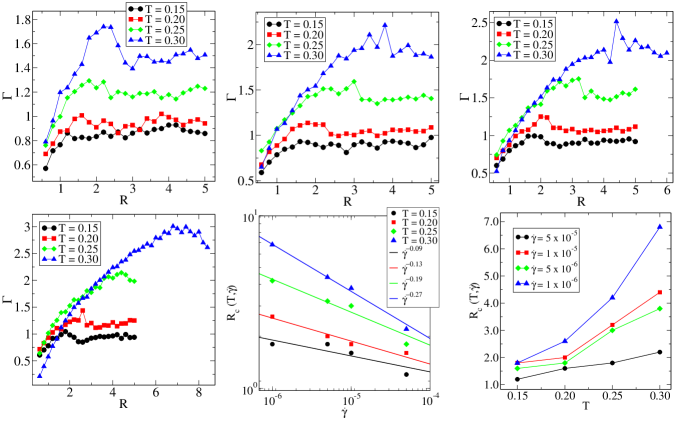
In Fig. 4, we show the maximum strain, , as a function of the aspect ratio for different temperatures at a given strain rate. The critical aspect ratio increases with increasing temperature and the variation of with temperature is larger as one decreases the strain rate, . As shown in Fig. 4, the critical aspect ratio changes from to for strain rate (top left panel) as the temperature increases from to , while with slower strain rate the value of increases from to around in the same temperature range. In the bottom middle panel of Fig. 4, the critical aspect ratio, , is plotted as a function of for different temperatures. The critical aspect ratio as a function of strain rate can be described by a power law, , with exponent varying strongly with temperature. At low temperature, is very small and approximately close and becomes substantially larger as the temperature is increased towards , the calorimetric glass transition temperature for the model. So at , the exponent is obtained. In the bottom right panel of the same figure, the critical aspect ratio is plotted as a function of temperature for different strain rates. One clearly sees that the critical aspect ratio where failure happens via cavity formation increases to larger values, suggesting the expected behaviour of increased ductility with increasing temperature. This behaviour becomes very strong as one decreases the strain rate and thus, under experimental conditions with very slow straining, one can expect a very strong dependence of the mechanical response on temperature.
Effect of system size
An increasing aspect ratio while keeping fixed is associated with an increasing system size. It is not obvious whether the cavity formation with increasing aspect ratio is solely a geometric effect. To clarify this issue, we have done simulations with a larger system size () at (smaller than ), and , and monitored the failure mechanisms systematically. We also did another simulation with at (bigger than ). We found that the failure mechanisms for remain neck-like even for larger systems. For , it is cavity-dominated even for smaller system size. Within the studied system size, failure mechanisms seem to be geometric rather than being a system size effect. Although it can be easily argued that at system sizes much larger than the one studied in this work, one will eventually reach the bulk behaviour where the aspect ratio will no longer play any role and the material will behave like a brittle material. It will be interesting to find out the crossover system size where one obtains this behaviour but that system size is expected to be very large and is beyond the scope of this work.
Coalescence of cavities as a generic mechanism for brittle failure:
We now focus on the microscopic failure mechanisms for systems with an aspect ratio much larger than the critical aspect ratio at a given temperature and strain rate. For systems with an aspect ratio larger but close to , a single cavity appears in the middle of the system with increasing deformation and then the cavity increases in size until it meets the open surface to break apart. With further increase in aspect ratio, one observes the appearance of two and then three cavities and this continues with increasing aspect ratio. One also observes that the cavities generally appear at equal distance from each other and if the straining is stopped and the cavities are allowed to relax, they remain at that size without closing them. This indicates that the cavities formed during straining are very stable at least in the studied time duration. For aspect ratios at which multiple cavities are formed during straining, first cavities coalesce to become a large single cavity with further deformation and then finally meets the open boundary. In Fig. 5, we have shown such a process of cavity merger for a system with an aspect ratio at and . One can clearly see that the first three cavities form in the middle of the sample almost equally spaced. Then, these cavities become larger in size maintaining roughly their separation. Finally, they merge to become a larger but elongated cavity before pinching off the open boundaries. Coalescence of multiple cavities is found to be a very generic mechanism for failure in these systems with a larger aspect ratio. This implies that for bulk brittle materials failure happens generically via formation and coalescence of cavities. As for a given aspect ratio, certain numbers of cavities form and then merge, one should be able to understand the morphology and roughness of the brittle crack surface from the typical size of these cavities before their merger. In the rightmost panel of Fig. 5, one can also see the rough fracture contour which has a scale roughly equal to the radius of the cavities before the merger. A much detailed systematic analysis on a larger system size is needed to have some understanding on this.
Results from 3D systems:
Until now, results for amorphous solids in two dimensions have been presented. A natural question is to see to what extent these results also hold in three dimensional systems. Our initial results of uniaxial elongation tests for three-dimensional samples under similar loading conditions and temperatures indeed suggest that the change in failure mechanism from necking to cavity formation with changing aspect ratio is also seen in three dimensional systems (see SI for further details). So it seems that the existence of a critical aspect ratio above which cavity formation dominates the failure mechanism under uniaxial elongation is a generic phenomenon and does not depend on the dimensionality of the sample. It will also be very interesting to understand the failure in three-dimensional nano-sized systems by varying systematically the cross-sectional area of the sample from square to rectangular to circular. If one of the side are made much smaller than another side, one will have a system which will be quasi two dimensional or like a thin film and failure mechanisms with increasing film thickness might be important and interesting for practical applications.
Curvature of the open surface

To understand the origin of the crossover in the failure mechanism from necking to cavitation, we now analyze the curvature of the free surfaces with increasing straining. To this end, we fit the average morphology of the free surfaces to an ellipse and determine the radius of curvature () at the centre of the surface (vertex of the minor axis of the ellipse). In Fig. 6, we show a typical snapshot of the surface particles and a fit to it with the equation of an ellipse. As can be inferred from this snapshot, the fitting of the morphology of the free surfaces works very well and therefore the estimate of the curvature is expected to be reliable.
Variation of radius of curvature with aspect ratio
In Fig. 7, we show the curvature of the free boundary at and for different aspect ratio.
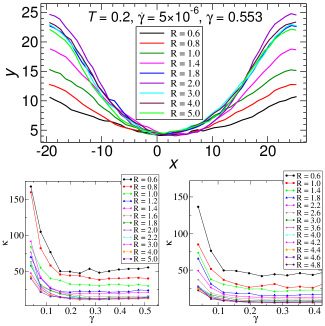
It is clear that the radius of curvature () is decreasing down to a certain value as the aspect ratio is increased. The radius of curvature starts to saturate at , which is close to the critical aspect ratio at and . This observation clearly indicates that once reaches , the curvature of the surface can no longer increase. Thus the system gets constrained to generate more surface area by increasing the curvature via necking and it leads to cavity formation in the bulk. Fig. 7 shows the evolution of curvature as a function of strain, , for different aspect ratios at a particular temperature and strain rates (left panel) and (right panel). The radius of curvature initially decreases monotonically and then reaches a plateau with increasing strain for each aspect ratio. Beyond the critical aspect ratio, the curvature seems to become the same for all aspect ratios. The aspect ratio at which this happens tends to increase with decreasing strain as can be observed from the data shown in the right panel of Fig. 7.

In Fig. 8, we show the radius of curvature at as a function of the aspect ratio for different temperatures and strain rates . For all the studied cases, the radius of curvature starts to saturate after values of that are close to the critical aspect ratio, , at that and . In this figure, we also highlight the value of the corresponding , that we computed earlier from the variation of . The correspondence between the value of at which vs. has a peak and the value at which vs. reaches a saturation value, is undoubtedly very good (see SI for further details).
Conclusions
We have performed uniaxial extensile deformation simulations of a model amorphous solids to understand the microscopic origin of cavitation and its connection to ductility in nano-sized amorphous solids. In this work, we have explored some of the main controlling parameters that determine whether the solid will fail via formation of cavities or via necking when subjected to external uniaxial extensional load. Our findings clearly suggest that the aspect ratio of the sample is one of the key parameters that control whether the failure will be via necking or will be dominated by cavity formation. We also showed for the first time that there exists a critical aspect ratio at which the ductility of the material is maximal and the failure mechanism is very different below and above this critical aspect ratio. Our results confirm that all the samples having an aspect ratio below its critical value will fail via necking whereas samples having aspect ratio larger than the critical value always forms cavities inside bulk before it breaks into two segments. Also, the number of cavities increases as one increases the aspect ratio. Our observations also show that this critical aspect ratio is a strong function of temperature and strain rate as the value of critical aspect ratio becomes larger at lower strain rate and higher temperature. Thus the ductility of amorphous solid on the nano-scale depends strongly on temperature and strain rate. Not much system size dependence in the failure mechanism is observed within the studied system size range and it completely depends upon its geometrical aspect ratio. Thus the conventional notion of enhanced relaxation due to surface states leading to an increase in ductility of the material at nano-scale may not be completely correct as geometric parameters also seem to play a big role. We believe that our observation of a crossover between neck-like failure to cavity-dominated failure across a critical aspect ratio will help us in future to understand why formation and subsequent merger of cavities are generic mechanisms for brittle failure on small length scales.
I Method Section
We have studied a generic model binary glass former in two dimensions Babu et al. (2016). The equations of motion are integrated with a leap-frog algorithm, using an integration time step of with . The temperature was kept constant via a Berendsen thermostat. The number of particles varied from to and the bi-dispersity ratio was 65 : 35 (A : B).
In our simulations, we used a protocol similar to in the recent study by Babu et al. Babu et al. (2016): First, we generate 32 independent configurations at the high temperature . To this, the end, simulations over time steps in the ensemble are performed, applying periodic boundary conditions (PBC) in the two spatial directions. Then, these configurations are cooled down to a desired temperature in the range with a cooling rate of 0.001, followed in each case by an simulation at zero pressure, i.e. , for another steps. Then, we remove the PBC, introducing free boundaries in the direction and confining the system in direction by two disordered walls. The two walls are obtained by pinning particles in layers of thickness on both sides in direction. Now the system is at the desired temperature and zero pressure, and both walls are uniaxially pulled in the opposite direction with a constant strain rate . We vary the strain rate in the range . At each strain rate, the system is deformed until it breaks completely into two parts.
Acknowledgements.
We would like to thank Pinaki Chaudhuri, Surajit Sengupta and Srikanth Sastry for useful discussion.References
- Argon (1979) A. Argon, Acta Metallurgica 27, 47 (1979).
- Maloney and Lemaître (2006) C. E. Maloney and A. Lemaître, Physical Review E 74, 016118 (2006).
- Maloney and Lemaître (2006) C. Maloney and A. Lemaître, Phys. Rev. E 74, 016118 (2006).
- Hentschel et al. (2010) H. G. E. Hentschel, S. Karmakar, E. Lerner, and I. Procaccia, Physical Review Letters 104, 025501 (2010).
- Karmakar et al. (2010a) S. Karmakar, E. Lerner, I. Procaccia, and J. Zylberg, Physical Review E 82, 031301 (2010a).
- Karmakar et al. (2010b) S. Karmakar, E. Lerner, and I. Procaccia, Physical Review E 82, 055103 (2010b).
- Dauchot et al. (2011) O. Dauchot, S. Karmakar, I. Procaccia, and J. Zylberg, Phys. Rev. E 84, 046105 (2011).
- Lagos and Das (2016) M. Lagos and R. Das, Advances in Applied Mathematics and Mechanics 8, 485 (2016).
- Hufnagel et al. (2016) T. C. Hufnagel, C. A. Schuh, and M. L. Falk, Acta Materialia 109, 375 (2016).
- Chen (2008) M. Chen, Annual Review of Materials Research 38, 445 (2008), https://doi.org/10.1146/annurev.matsci.38.060407.130226 .
- Ashby and Greer (2006) M. Ashby and A. Greer, Scripta Materialia 54, 321 (2006), viewpoint set no: 37. On mechanical behavior of metallic glasses.
- Rodney et al. (2011) D. Rodney, A. Tanguy, and D. Vandembroucq, Modelling and Simulation in Materials Science and Engineering 19, 083001 (2011).
- Schuh et al. (2007) C. Schuh, T. Hufnagel, and U. Ramamurty, Acta Materialia - ACTA MATER 55, 4067 (2007).
- Shrivastav et al. (2016) G. P. Shrivastav, P. Chaudhuri, and J. Horbach, Physical Review E 94, 042605 (2016).
- Greer (1995) A. L. Greer, Science 267, 1947 (1995).
- Binder et al. (2005) K. Binder, J. Horbach, W. Kob, and A. Winkler, “Computer simulation of molten and glassy silica and its mixtures with sodium oxide and aluminium oxide,” in Complex Inorganic Solids: Structural, Stability, and Magnetic Properties of Alloys, edited by P. E. A. Turchi, A. Gonis, K. Rajan, and A. Meike (Springer US, Boston, MA, 2005) pp. 35–53.
- Schroers and Johnson (2004) J. Schroers and W. L. Johnson, Phys. Rev. Lett. 93, 255506 (2004).
- Schuster et al. (2007) B. Schuster, Q. Wei, M. Ervin, S. Hruszkewycz, M. Miller, T. Hufnagel, and K. Ramesh, Scripta Materialia 57, 517 (2007).
- Scudino et al. (2015) S. Scudino, H. Shakur Shahabi, M. Stoica, I. Kaban, B. Escher, U. Kühn, G. B. M. Vaughan, and J. Eckert, Applied Physics Letters 106, 031903 (2015), https://doi.org/10.1063/1.4906305 .
- Sun and Wang (2015) B. Sun and W. Wang, Progress in Materials Science 74, 211 (2015).
- Guo et al. (2007) H. Guo, P. F. Yan, Y. B. Wang, J. Tan, Z. F. Zhang, M. L. Sui, and E. Ma, Nature Materials 6, 735 EP (2007).
- Crété et al. (2014) J. Crété, P. Longère, and J. Cadou, Computer Methods in Applied Mechanics and Engineering 275, 204 (2014).
- Li et al. (1992) G. C. Li, H. Q. Liu, M. L. Du, Y. S. Hong, and X. Zhang, Fatigue & Fracture of Engineering Materials & Structures 15, 187 (1992), https://onlinelibrary.wiley.com/doi/pdf/10.1111/j.1460-2695.1992.tb00048.x .
- Singh et al. (2016) I. Singh, R. Narasimhan, and U. Ramamurty, Phys. Rev. Lett. 117, 044302 (2016).
- Chaudhuri and Horbach (2016) P. Chaudhuri and J. Horbach, Phys. Rev. B 94, 094203 (2016).
- Volkert et al. (2008) C. A. Volkert, A. Donohue, and F. Spaepen, Journal of Applied Physics 103, 083539 (2008), https://doi.org/10.1063/1.2884584 .
- Chen et al. (2013) D. Z. Chen, D. Jang, K. M. Guan, Q. An, W. A. Goddard, and J. R. Greer, Nano Letters 13, 4462 (2013).
- Luo et al. (2010) J. H. Luo, F. F. Wu, J. Y. Huang, J. Q. Wang, and S. X. Mao, Phys. Rev. Lett. 104, 215503 (2010).
- Jang and Greer (2010) D. Jang and J. R. Greer, Nature Materials 9, 215 EP (2010).
- Greer and De Hosson (2011) J. R. Greer and J. T. M. De Hosson, Festschrift Vaclav Vitek, Progress in Materials Science 56, 654 (2011).
- Kraft et al. (2010) O. Kraft, P. A. Gruber, R. Mönig, and D. Weygand, Annual Review of Materials Research 40, 293 (2010), https://doi.org/10.1146/annurev-matsci-082908-145409 .
- Sergueeva et al. (2004) A. Sergueeva, N. Mara, D. Branagan, and A. Mukherjee, Scripta Materialia 50, 1303 (2004).
- Ding et al. (2015) B. Ding, X. Li, X. Zhang, H. Wu, Z. Xu, and H. Gao, Nano Energy 18, 89 (2015).
- Maaß et al. (2015) R. Maaß, P. Birckigt, C. Borchers, K. Samwer, and C. Volkert, Acta Materialia 98, 94 (2015).
- An et al. (2011) Q. An, G. Garrett, K. Samwer, Y. Liu, S. V. Zybin, S.-N. Luo, M. D. Demetriou, W. L. Johnson, and W. A. Goddard, The Journal of Physical Chemistry Letters, The Journal of Physical Chemistry Letters 2, 1320 (2011).
- Murali et al. (2011) P. Murali, T. F. Guo, Y. W. Zhang, R. Narasimhan, Y. Li, and H. J. Gao, Physical Review Letters 107, 215501 (2011).
- Guan et al. (2013) P. Guan, S. Lu, M. J. B. Spector, P. K. Valavala, and M. L. Falk, Physical Review Letters 110, 185502 (2013).
- Steif (1983) P. S. Steif, Journal of the Mechanics and Physics of Solids 31, 359 (1983).
- Babu et al. (2016) J. S. Babu, C. Mondal, S. Sengupta, and S. Karmakar, Soft Matter 12, 1210 (2016).