Measuring Supermassive Black Hole Masses: Correlation between the Redshifts of the Fe III UV Lines and the Widths of Broad Emission Lines
Abstract
We test the recently proposed (Mediavilla et al. 2018) black hole mass scaling relationship based on the redshift with respect to the quasar’s rest frame of the Fe III2039-2113 line blend. To this end, we fit this feature in the spectra of a well suited sample of quasars, observed with X-shooter at the Very Large Telescope (VLT), whose masses have been independently estimated using the virial theorem. For the quasars of this sample we consistently confirm the redshift of the Fe III2039-2113 blend and find that it correlates with the squared widths of H, H and Mg II, which are commonly used as a measure of to determine masses from the virial theorem. The average differences between virial and Fe III2039-2113 redshift based masses are 0.18 dex, 0.18 dex and 0.14 dex, when the full widths at half maximum (FWHM) of the H, H and MgII lines are, respectively, used. The difference is reduced to 0.10 dex when the standard deviation, , of the MgII line is used, instead. We also study the high S/N composite quasar spectra of the Baryon Oscillation Spectroscopic Survey (BOSS), finding that the Fe III2039-2113 redshifts and Mg II squared widths, , match very well the correlation found for the individual quasar spectra observed with X-shooter. This correlation is expected if the redshift is gravitational.
1 Introduction
The masses of Super-Massive Black Holes (SMBH) found in the center of galaxies are known to correlate strongly with the properties of their host galaxies (Kormendy & Richstone 1995, Magorrian et al. 1998). Understanding the coupling between the growth of SMBH and the evolution of galaxies requires measuring SMBH masses at early epochs, i.e., in distant quasars (Peng et al. 2006). In quasars, a central SMBH is surrounded by a disc of inspiralling matter (Zeldovich 1964, Salpeter 1964) that illuminates gas clouds located in a larger region (Broad Line Region, BLR), giving rise to broad emission lines (BEL). In this scenario, the SMBH mass can be estimated assuming virialization of the BLR gas clouds (Peterson 2014). However, the accuracy of individual virial mass estimates is limited to (e.g. Peterson 2014) by our ignorance about the BLR structure and dynamics. To complicate matters further, in the case of distant quasars, the emission line of reference observable in the optical is CIV, whose suitability to estimate masses is controversial (see, e.g., Mejía-Restrepo et al. 2016 and references therein).
Another approach to measure masses is the gravitational redshift that the SMBH should induce on the BEL (Netzer 1977, Anderson 1981, Mediavilla & Moreno-Insertis 1989). If the kinematics is ruled by gravitation, the typical widths of the BEL, , imply gravitational redshifts, , which correspond to wavelength redshifts of for the UV emission lines, and of for the optical ones. However, owing to the complex morphology of the BEL, which are typically blends of several components with different kinematics and origin, the detection of shifts of this magnitude (perhaps affecting only one of the components) is quite difficult. Likely for this reason, detections of gravitational redshift using the typical strong BEL (Peterson et al. 1985, Sulentic 1989, Zheng & Sulentic 1990, Popovic et al. 1995, Corbin 1997, Kollatschny 2003, Jonic et al. 2016, Liu et al. 2017) have been, until now, scarce and inaccurate. The situation is particularly bad in the case of distant quasars for which the available data at (rest frame) optical wavelengths are limited.
In this context the recent report by Mediavilla et al. (2018) of a consistently observed redshift111Here and hereafter, we refer to the Fe III2039-2113 redshift with respect to the quasar’s rest frame, i.e., after correcting for the cosmological redshift. of the Fe III2039-2113 blend222This feature is weak but, according to Vestergaard & Wilkes 2001, relatively free of contamination from lines of other species. by amounts explicable by the gravitational redshift induced by the SMBH, is promising. Based on the impact of microlensing magnification, this feature seems to arise from an inner region of the BLR of about 13 light-days in size (Fian et al. 2018) for quasars of average luminosity . This size, smaller by more than one order of magnitude than the typical dimensions of the BLR, would explain the relatively large measured redshifts. From these results, in Mediavilla et al. (2018) we calibrate a mass scaling relationship based on the Fe III2039-2113 redshift useful to measure the SMBH mass from a single spectrum333It is important to remark that this alternative way to estimate masses is not only simple to apply but also free from geometrical effects and largely insensitive to nongravitational forces.. The estimated masses are in good agreement with virial masses over two orders of magnitude.
The objective of this work is to test the use of the Fe III2039-2113 redshift to estimate SMBH masses, studying a sample of quasars with independent virial mass estimates. The objects in this sample should have a convenient redshift (to exhibit the Fe III UV lines in the optical), S/N ratio as high as possible (the Fe III UV blend is relatively weak) and measured virial mass. The sample of 39 unobscured quasars at observed with X-shooter@VLT by Capellupo et al. (2015, 2016), selected to cover a wide range in masses and Eddington ratios is, to our knowledge, the best available dataset for this purpose. At the redshift of the sample, the broad X-shooter wavelength range allows observations of the four strong lines (C IV, Mg II, H and H) commonly used to estimate virial masses, and also includes the Fe III2039-2113 blend. Virial masses of the black holes of the quasars in the sample have been derived by Mejía-Restrepo et al. (2016).
The paper is organized as follows: In §2 we describe the fits of the Fe III2039-2113 blend in the subsample of objects (10) with sufficient S/N ratio. In this section we also estimate the Fe III2039-2113 line shifts with respect to the quasars’ rest frame and study their dependence on the H, H and Mg II emission line widths. In §3 we derive the masses from the Fe III2039-2113 redshifts and compare them with the virial masses. In this section we also infer a size-luminosity relationship for the Fe III2039-2113 emitting region. Finally, in §4 we summarize our main conclusions.
2 Results
2.1 Fe III2039-2113 Redshift Measurements
The S/N of the spectra studied by Mejía-Restrepo et al. (2016) is high (S/N 100) in the region of the Fe III2039-2113 blend. However, after continuum subtraction not all the spectra present a Fe III2039-2113 feature with S/N high enough to allow for a reasonably good fit. We have selected the 10 systems (J0019-1053, J0043+0114, J0155-1023, J0209-0947, J0404-0446, J0842+0151, J0934+0005, J0941+0443, J1002+0331 and J1158-0322) with at the peak of the blend after continuum subtraction, and without features that prevent the determination of the continuum around the Fe III2039-2113 blend. We model the blend following the same steps as in Mediavilla et al. (2018), although, when convenient, the windows used to fit the continuum have been adapted to the shape of the continuum, which can change from object to object444The fits match well the shape of the blend with reduced chi-squared values .. We have used the peak of the Mg II emission line to define the quasar cosmological redshift. We have checked the consistence of this determination with the narrow H (in all the spectra) and [OIII] (in four objects) emission lines finding differences from the rest wavelengths smaller than the errors in the fit (Å).
After correcting the spectra for the cosmological redshifts, we find that the Fe III2039-2113 blend is redshifted in the 10 quasars of the sample. This confirms the consistently observed redshift of this feature in quasars found by Mediavilla et al. (2018). We estimate an average redshift and scatter among the 10 spectra of , comparable to the redshift of found in the high S/N composite SDSS spectrum (Mediavilla et al. 2018).
2.2 Correlation between the Fe III2039-2113 Redshifts and the H, H and Mg II Squared Widths
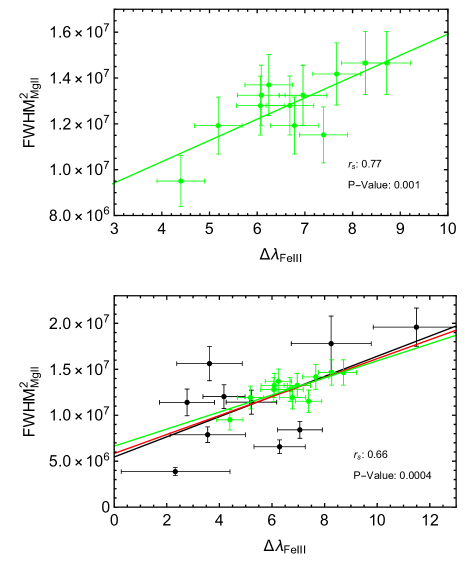
In the upper left panel of Figure 1 we plot the squared widths of H, , measured by Mejía-Restrepo et al. (2016) vs. the Fe III UV wavelength redshifts, , for the 10 objects in the sample. There is a significant correlation between both quantities (linear fit with Pearson correlation coefficient, ), thus supporting that the redshift is related to , as is the case of the squared widths. Considering that is the preferred quantity to infer masses using the virial theorem, this correlation supports the gravitational origin of the measured redshifts.
In principle, alternative explanations leaving aside the gravitational redshift scenario are possible. Kovačević-Dojčinović & Popović (2015) interpret the redshifts found in the case of the UV Fe II emission lines as inflow of gas clouds located at the outer parts of the BLR. According to Ferland et al. (2009), infall requires that the clouds have large column densities and, hence, we will see predominantly the shielded face of the near-side infalling clouds with the consequent redshift of the emission lines. However, this or other alternative hypothesis should provide a convincing explanation of the good correlation between the observed redshifts and .
The correlation between widths and redshifts is also observed in H and in Mg II (Fig. 1) with correlation coefficients and , respectively. It is interesting to note that, in the case of Mg II, the correlation becomes very strong () when we take the squared standard deviation calculated by Mejía-Restrepo et al. (2016), , instead of as the magnitude related to the virial masses (Fig. 1). On the contrary, in the case of H, the correlation is weak if we adopt as the virial indicator. In the case of Mg II, the improvement may be explained by the higher precision measure of the virial product obtained by using (instead of ) (Peterson et al. 2004), or by the larger bias (likely related to inclination) of based measurements of SMBH masses with respect to those based on (Collin et al. 2006). In the case of the more complex H line profiles, these factors could be less significant than the presence of several components at low levels of intensity, which can be affecting in a very different way and FWHM. In fact, the correlation between and FWHM is by far worst in the case of H.
2.3 Correlation between the Fe III2039-2113 Redshift and for BOSS Composite Spectra
Encouraged by the correlations found in the previous section between the Fe III2039-2113 redshifts and the squared widths of several emission lines, we check these results with the high S/N composite spectra from the BOSS survey (Jensen et al. 2016). Mediavilla et al. (2018) obtained the Fe III2039-2113 redshifts for the BOSS composite spectra with high enough S/N ratio. For 13 of these spectra, the wavelength coverage of the BOSS survey includes the MgII line (H and H are out of the observed wavelength range).
We estimate the in a direct way, fitting the continuum to a straight line in the 2650-2700 and 2900-2925 wavelength ranges and measuring the width at 50% of the peak intensity with respect to this continuum. The resulting FWHMs have a strong correlation () with the Fe III2039-2113 redshifts (upper panel in Figure 2). Very interestingly, the BOSS data match very well the correlation obtained with the data from Mejía-Restrepo et al. (2016) in §2.2 (see lower panel in Figure 2). Note that in Figure 2 we have divided the FWHM of BOSS data by a factor 1.06 to equal the means of the squared widths, , of both data sets555This slight global shift does not affect the slope of the fit to the BOSS data and would correspond to a shift by a factor of 1.12 in mass estimates, which is also small given the typical uncertainties in virial masses.. Notice the excellent agreement between the linear fits to the BOSS, Mejía-Restrepo et al. (2016) and all data.
The good correlation of the Fe III2039-2113 redshifts with the of the BOSS composites and the match with the correlation obtained in §2.2 from Mejía-Restrepo et al. (2016) data, confirm the hypothesis that the Fe III2039-2113 redshifts are a proxy for .
3 Discussion
3.1 Test of the SMBH Mass Scaling Relationship Based on the Fe III2039-2113 Redshift
To test the SMBH mass measurements from the Fe III2039-2113 redshift, we consider the mass scaling relationship of Mediavilla et al. (2018) based on the best fit to the pairs, of a sample of 10 AGN and quasars, using as free parameter the exponent of the R-L relationship, , (Eq. 14 of Mediavilla et al. 2018):
| (1) |
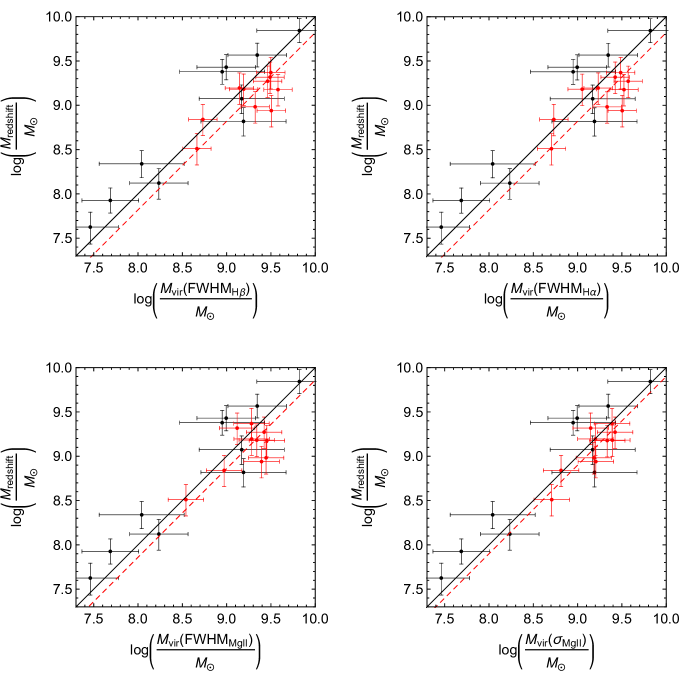
We use this equation to estimate the masses based on the Fe III2039-2113 redshift of the 10 objects in the sample of Mejía-Restrepo et al. (2016) and compare them with the virial masses obtained by Mejía-Restrepo et al. (2016) from the H, H and Mg II FWHMs. The results are shown in Figure 3. The agreement is rather good, with mean shifts and scatters () between the redshift based and virial masses of , and dex for H, H and Mg II, respectively. If we take as reference for the Mg II widths instead of the FWHM, we obtain a significantly better fit (see Figure 3) with a mean shift of 0.10 dex and a scatter of dex. Notice that these scatters are comparable to the intrinsic scatter between virial masses obtained from H () and Mg II () with respect to H (Mejía-Restrepo et al. 2016). In other words, for the studied sample, the intrinsic uncertainty of virial masses is an upper limit of the uncertainty of mass estimates based on the redshift.
Although the mean differences between the redshift and virial based masses are below the scatter, on average the redshift based masses are smaller than the virial based ones. This may come from the derivation of Eq. 1. The virial masses used by Mediavilla et al. (2018) to calibrate this Fe III UV mass scaling relationship come from different bibliographic sources and are based on a variety of emission lines. The use of different emission lines or different procedures to evaluate the line widths introduce systematics that could explain the offset. In fact, in our case the offset is significantly smaller when is used. Leaving aside the statistical significance of the offsets, it is important to mention that some recent results indicate that mass determinations based on reverberation mapping are, on average, smaller than those based on single epoch measurements and the R-L relationship (Grier et al. 2017, Lira et al. 2018).
After the consistent results described above, we may recalibrate the mass scaling relationship with Fe III2039-2113 redshift (Eq. 1) using the 10 objects of the sample in Mediavilla et al. (2018) plus the new 10 objects from Mejía-Restrepo et al. (2016). The change would imply a relatively small offset in the calibration of dex in the case of H and of only dex for . In any case, any recalibration of Eq. 1 basically implies a recalibration of the size-luminosity, R-L, relationship for Fe III2039-2113. We address this issue in the next section.
3.2 Size-Luminosity Relationship for Fe III2039-2113
The correlation between and the redshift of the Fe III2039-2113 blend also implies a correlation between the sizes of the regions emitting H, , and the Fe III UV blend, . Combining the virial equation for H,
| (2) |
where is the virial factor (which may change from object to object), with the equation relating the SMBH mass with the gravitational redshift of the Fe III UV lines (see Eq. 3 in Mediavilla et al. 2018),
| (3) |
we obtain,
| (4) |
An immediate result of this equation is that the observed correlation between and makes sense only if the factor does not change very much from object to object. As there is no reason to expect that individual variations in are compensated by simultaneous variations in that leave the whole factor unchanged, we conclude that both factors must be approximately constant among the different objects. Averaging Eq. 4 over the 10 objects selected from the Mejía-Restrepo et al. (2016) sample we obtain:
| (5) |
(Notice that this value corresponds to a mean luminosity of the quasars of ). Then, for the value adopted by Mejía-Restrepo et al. (2016), the size of the Fe III UV emitting region is significantly smaller than the size associated with H. Similar scaling relationships can be obtained for H, , and MgII, .
According to Mejía-Restrepo et al. (2016) the scaling with luminosity of the H emitting region is given by . Taking into account this dependence in Equation 3 and using the SMBH mass averaged over the 10 objects selected from the Mejía-Restrepo et al. (2016) sample corresponding to H we can obtain a scaling relationship of size with luminosity for Fe III UV,
| (6) |
where, according to the proportionality, we have used the 0.65 exponent inferred by Mejía-Restrepo et al. (2016). Mediavilla et al. (2018) reached a similar result. Writing Equation 13 from Mediavilla et al. (2018) in the same way as Equation 11 of these authors and identifying terms, we obtain,
| (7) |
In principle, we could use the R-L scaling relationship of Eq. 6 to recalibrate Eq. 1 to remove the (relatively small) offset between the Mejía-Restrepo et al. (2016) virial masses and our Fe III2039-2113 redshift based estimates. However, recent size estimates based on reverberation mapping (Grier et al. 2017) are on average smaller than the single epoch ones based on the R-L relationship, especially for high luminosity objects like the ones in the Mejía-Restrepo et al. (2016) sample. Then, it seems preferable to maintain the calibration of Eq. 1 until this discrepancy is resolved.
Notice that Equations 3 to 6 can also be seen as a consequence of the correlation found between redshifts, , and squared widths, , without the need of invoking the gravitational redshift hypothesis although, then, the factor would be different. On the other hand, Eq. 7 is an empirical result independent of the origin of the redshifts.
The question of the localization of the Fe III2039-2113 emission region is crucial to decide between several possible hypothesis about the origin of the redshifts. Reverberation mapping is, indeed, the most robust and independent way to measure the size of the emission region. Until the results of this observational technique become available, the outcomes of the present work can be regarded like empirical findings, irrespective of the origin of the measured redshifts.
4 Conclusions
We fit the Fe III2039-2113 emission line blend in a sample of 10 quasars with the best spectra available to study this feature (Mejía-Restrepo et al. 2016). We have extended part of this analysis to the composite quasar spectra from the BOSS survey. The results support that the redshift of these lines is a proxy for and the possibility of using this redshift to estimate SMBH masses. Specifically:
1 - We consistently confirm the redshift of the Fe III2039-2113 feature. We find an average redshift of Å, well above uncertainties (Å).
2 - There is a linear correlation () between the measured Fe III2039-2113 redshift and the squared widths () of the H, H and Mg II lines independently determined by Mejía-Restrepo et al. (2016). This correlation, nicely confirmed in the case of Mg II by the analysis of the high S/N ratio composite quasar spectra from the BOSS survey (), supports the hypothesis that these redshifts measure . The correlation with the squared widths is expected if the origin of the Fe III2039-2113 redshift is gravitational. The correlation is surprisingly tight () with .
3 - The scaling relationship of mass with redshift and luminosity given by Mediavilla et al. (2018) predicts the masses for the SMBH associated with the quasars of the sample of Mejía-Restrepo et al. (2016) with mean offsets of 0.18 dex respect to the virial masses computed from , 0.18 dex (virial masses from ), 0.14 dex (virial masses from ) and 0.10 dex (virial masses from ). The statistical agreement between redshift based and virial masses is as good as the internal agreement among virial mass estimates based on different lines (and/or definitions of the line widths).
4 - The correlation between widths and Fe III2039-2113 redshifts provides a size-luminosity, R-L, scaling for in reasonable agreement with the results from Mediavilla et al. (2018).
The calibration of the mass scaling relationship with the Fe III2039-2113 redshift resides on the size of the region emitting the Fe III2039-2113. Until now, this size has been derived (Mediavilla et al. 2018) either directly from microlensing (an average estimate with large uncertainties) or, indirectly, matching the redshift based and virial masses (obtained using emission lines arising from very much larger regions). The measurements of a sample of quasars made in the present work support these results. However, reverberation mapping observations of Fe III2039-2113 are needed to determine, in an independent and accurate way, the size of the emitting region and, if possible, to obtain a size-luminosity, R-L, relationship for this blend.
References
- Anderson (1981) Anderson, K. S. 1981, ApJ, 246, 13
- Capellupo et al. (2015) Capellupo, D. M., Netzer, H., Lira, P., Trakhtenbrot, B., & Mejía-Restrepo, J. 2015, MNRAS, 446, 3427
- Capellupo et al. (2016) Capellupo, D. M., Netzer, H., Lira, P., Trakhtenbrot, B., & Mejía-Restrepo, J. 2016, MNRAS, 460, 212
- Collin et al. (2006) Collin, S., Kawaguchi, T., Peterson, B. M., & Vestergaard, M. 2006, A&A, 456, 75
- Corbin (1997) Corbin, M. R. 1997, ApJ, 485, 517
- Ferland et al. (2009) Ferland, G. J., Hu, C., Wang, J.-M., et al. 2009, ApJ, 707, L82
- Fian et al. (2018) Fian, C., Guerras, E., Mediavilla, E., et al. 2018, ApJ, 859, 50
- Grier et al. (2017) Grier, C. J., Trump, J. R., Shen, Y., et al. 2017, ApJ, 851, 21
- Jensen et al. (2016) Jensen, T. W., Vivek, M., Dawson, K. S., et al. 2016, ApJ, 833, 199
- Jonić et al. (2016) Jonić, S., Kovačević-Dojčinović, J., Ilić, D., & Popović, L. Č. 2016, Ap&SS, 361, 101
- Kollatschny (2003) Kollatschny, W. 2003, A&A, 412, L61
- Kormendy & Richstone (1995) Kormendy, J., & Richstone, D. 1995, ARA&A, 33, 581
- Kovačević-Dojčinović & Popović (2015) Kovačević-Dojčinović, J., & Popović, L. Č. 2015, ApJS, 221, 35
- Lira et al. (2018) Lira, P., Kaspi, S., Netzer, H., et al. 2018, ApJ, 865, 56
- Liu et al. (2017) Liu, H. T., Feng, H. C., & Bai, J. M. 2017, MNRAS, 466, 3323
- Magorrian et al. (1998) Magorrian, J., Tremaine, S., Richstone, D., et al. 1998, AJ, 115, 2285
- Mediavilla & Insertis (1989) Mediavilla, E., & Insertis, F. M. 1989, A&A, 214, 79
- Mediavilla et al. (2018) Mediavilla, E., Jiménez-Vicente, J., Fian, C., et al. 2018, ApJ, 862, 104
- Mejía-Restrepo et al. (2016) Mejía-Restrepo, J. E., Trakhtenbrot, B., Lira, P., Netzer, H., & Capellupo, D. M. 2016, MNRAS, 460, 187
- Netzer (1977) Netzer, H. 1977, MNRAS, 181, 89P
- Peng et al. (2006) Peng, C. Y., Impey, C. D., Rix, H.-W., et al. 2006, ApJ, 649, 616
- Peterson et al. (1985) Peterson, B. M., Meyers, K. A., Carpriotti, E. R., et al. 1985, ApJ, 292, 164
- Peterson et al. (2004) Peterson, B. M., Ferrarese, L., Gilbert, K. M., et al. 2004, ApJ, 613, 682
- Peterson (2014) Peterson, B. M. 2014, Space Sci. Rev., 183, 253
- Popovic et al. (1995) Popovic, L. C., Vince, I., Atanackovic-Vukmanovic, O., & Kubicela, A. 1995, A&A, 293, 309
- Salpeter (1964) Salpeter, E. E. 1964, ApJ, 140, 796
- Sulentic (1989) Sulentic, J. W. 1989, ApJ, 343, 54
- Vestergaard & Wilkes (2001) Vestergaard, M., & Wilkes, B. J. 2001, ApJS, 134, 1
- Zel’dovich (1964) Zel’dovich, Y. B. 1964, Soviet Physics Doklady, 9, 195
- Zheng & Sulentic (1990) Zheng, W., & Sulentic, J. W. 1990, ApJ, 350, 512