2Instituto de Astrofísica de Andalucía - CSIC, PO Box 3004, 18008, Granada, Spain
3 Instituto de Astrofísica, Facultad de Física, Pontificia Universidad Católica de Chile, Casilla 306, Santiago 22, Chile
4Department of Astronomy, University of Florida, 211 Bryant Space Sciences Center, Gainesville, FL 32607, USA
5Department of Astronomy, University of Virginia, Charlottesville, VA 22903, USA
6National Radio Astronomy Observatory, Charlottesville, VA 22903, USA
7Núcleo de Astronomía de la Facultad de Ingeniería, Universidad Diego Portales, Av. Ejército Libertador 441, Santiago, Chile
8Visiting Scientist: Facultad de Ciencias, Univ. de Zaragoza, Spain
9Department of Physics and Astronomy, 4129 Frederick Reines Hall, University of California, Irvine, CA 92697, USA
10ICREA and Institut de Ciències del Cosmos (ICC), Universitat de Barcelona (IEEC-UB), Martí i Franquès 1, 08028, Barcelona, Spain
11Spitzer Science Center, California Institute of Technology, Pasadena, CA 91106, USA
12Chalmers University of Technology, Department of Earth and Space Sciences, Onsala Space Observatory, 43992 Onsala, Sweden
13Infrared Processing and Analysis Center, California Institute of Technology, Pasadena, CA 91125, USA
14Gemini North Observatory, 670 N. A‘ohoku Place, Hilo, HI 96720, USA
15University of Hawaii, Institute for Astronomy, 2680 Woodlawn Dr., Honolulu, HI 96822, USA
15Joint ALMA Observatory, Alonso de Córdova 3107, Vitacura, Santiago, Chile
16Institute for Astronomy, Astrophysics, Space Applications & Remote Sensing, National Observatory of Athens, GR-15236, Penteli, Greece
17Green Bank Observatory, Green Bank WV, 24944, USA
18National Optical Astronomy Observatory, 950 North Cherry Avenue, Tucson, AZ 85719, USA
Molecular gas and dust properties of galaxies from the
Great Observatories All-sky LIRG Survey
We present IRAM-30 m Telescope 12CO and 13CO observations of a sample of 55 luminous and ultraluminous infrared galaxies (LIRGs and ULIRGs) in the local universe. This sample is a subset of the Great Observatory All-Sky LIRG Survey (GOALS), for which we use ancillary multi-wavelength data to better understand their interstellar medium and star formation properties. Fifty-three (96%) of the galaxies are detected in 12CO, and 29 (52%) are also detected in 13CO above a 3 level. The median full width at zero intensity (FWZI) velocity of the CO line emission is 661 km s-1, and 54% of the galaxies show a multi-peak CO profile. Herschel photometric data is used to construct the far-IR spectral energy distribution of each galaxy, which are fit with a modified blackbody model that allows us to derive dust temperatures and masses, and infrared luminosities. We make the assumption that the gas-to-dust mass ratio of (U)LIRGs is comparable to local spiral galaxies with a similar stellar mass (i.e., gas/dust of mergers is comparable to their progenitors) to derive a CO-to-H2 conversion factor of (K km s-1 pc2)-1; such a value is comparable to that derived for (U)LIRGs based on dynamical mass arguments. We derive gas depletion times of Myr for the (U)LIRGs, compared to the 1.3 Gyr for local spiral galaxies. Finally, we re-examine the relationship between the 12CO /13CO ratio and dust temperature, confirming a transition to elevated ratios in warmer systems.
Key Words.:
ISM: molecules — galaxies: ISM — galaxies: active — galaxies: starburst — radio lines: galaxies1 Introduction
Luminous and ultraluminous infrared galaxies (LIRGs: ; ULIRGs; ) are known to host powerful starbursts, making them ideal for studying the properties of extreme star-forming environments. Since the discovery of (U)LIRGs as an important galaxy population by the Infrared Astronomical Satellite (IRAS), which found that 30%-50% of the total bolometric luminosity of galaxies in the local universe is emitted at infrared (IR) and sub-millimeter wavelengths (Soifer et al., 1986), CO observations of (U)LIRGs have been carried out to characterize the molecular gas responsible for the ongoing star formation, as well as to trace galaxy kinematics (e.g., Tinney et al., 1990; Sanders et al., 1991; Aalto et al., 1995; Solomon et al., 1997; Downes & Solomon, 1998; Bryant & Scoville, 1999; Yao et al., 2003; Narayanan et al., 2005; Papadopoulos et al., 2012b). Much of the interpretation of the data is reliant on the CO luminosity-to-molecular gas mass conversion factor, ; the commonly used “Milky Way” conversion factor, (K km s-1 pc2)-1, has been called into question for its use with (U)LIRGs, for which alternative values have been proposed (e.g., Downes & Solomon, 1998; Bolatto et al., 2013). The choice directly impacts upon estimates of the total gas mass, the star formation efficiency, and the gas depletion timescale, which can differ by almost an order of magnitude. In addition to CO, observations of high density and optically thin gas tracers have provided the opportunity to better assess the physical conditions of the interstellar medium (ISM), in part by determining the physical state of the gas more directly involved in the formation of future stars.
The advent of broadband receivers on millimeter-wave telescopes has enabled the detection of multiple lines at once, probing a range of optical depths, critical densities, and temperatures. In our present study, we make use of the 30 m Telescope of the Institut de Radioastronomie Millim/’etrique (IRAM-30 m) to detect multiple millimeter-wave lines from a sample of 55 nearby (U)LIRGs selected from the Great Observatories All-Sky LIRG Survey (GOALS, Armus et al., 2009). We focus here primarily on the 12CO(10) and 13CO(10) data, which is combined with new Herschel Space Observatory observations in order to estimate the conversion factor from an assumed gas-to-dust mass ratio, the star formation efficiency, and gas depletion timescales, and to examine the relation between the 12CO(10)-to-13CO(10) ratio and the dust temperature. A complementary study of dense gas tracers HCN(10) and HCO+(10), observed as part of this IRAM campaign, was presented in Privon et al. (2015).
This paper is organized as follows: we describe our sample in Sect. 2. Observations and data reduction are summarized in Sect. 3. The main results are presented in Sect. 4. In Sect. 5 we determine the CO-to-H2 conversion factor (5.1), derive the star formation properties of the sample (5.2), and reexamine the 12CO /13CO relationship with dust temperature (5.3). Finally, we summarize our results in Sect. 6. Throughout this study, we adopt a Wilkinson Microwave Anisotropy Probe (WMAP) cosmology of km s-1 Mpc-1, and (Hinshaw et al., 2013).
2 Sample
Our sources are selected from the GOALS sample, which consists of all 180 luminous and 22 ultraluminous nearby IR galaxy systems in the IRAS Revised Bright Galaxy Sample (: Sanders et al. 2003). The GOALS sample has been observed with the Hubble Space Telescope (HST; Haan et al., 2011; Kim et al., 2013), the Spitzer Space Telescope (Díaz-Santos et al., 2010, 2011; Petric et al., 2011; Stierwalt et al., 2013, 2014), the Herschel Space Observatory (Chu et al., 2017), the Galaxy Evolution Explorer (GALEX) (Howell et al., 2010), and the Chandra X-ray Observatory (Iwasawa et al., 2011), making it the most complete multiwavelength sample of nearby, IR-bright galaxies. In addition, ground-based H i, radio, and near-IR spectroscopic data complement the space-telescope-based dataset. GOALS contains a sufficient number of LIRGs to cover the full range of galaxy-galaxy interactions and merger stages, including isolated sources. The sample of 55 (U)LIRGs observed for our present CO survey consists of GOALS sources accessible from Pico Veleta that had not been previously observed by the IRAM-30 m Telescope. Unfortunately, due to the lack of a public archive for the IRAM-30 m Telescope, previously observed data for GOALS galaxies cannot be obtained in its raw format, so a systematic data reduction could not be guaranteed. For this reason, we restricted the current study to the aforementioned sample of 55 (U)LIRGs.
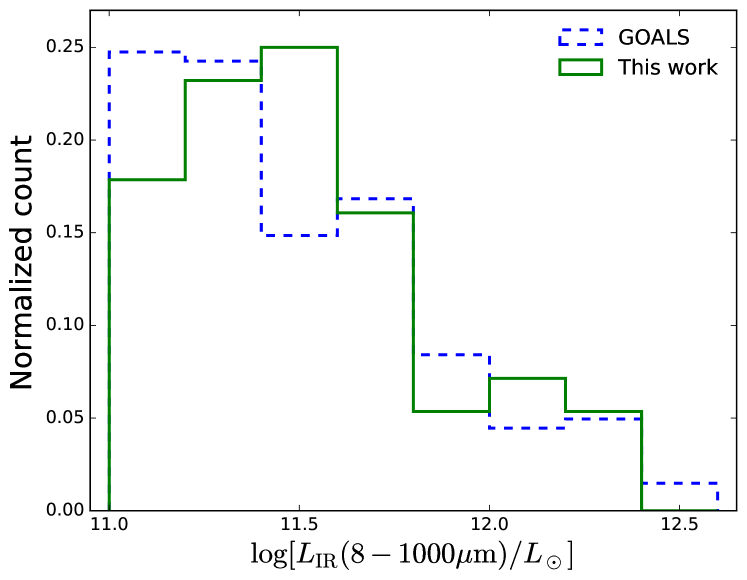
In the observed sample, 48 of the galaxies are LIRGs or components of LIRGs, and seven are ULIRGs or component of ULIRGs. In the cases where each component of a system was observed independently, these were treated as individual sources throughout the analysis. The list of galaxies is presented in Table 1, along with from Armus et al. (2009). As shown in the histogram of Fig. 1, our observed sources are representative of the complete GOALS sample in terms of luminosity.
To compare our (U)LIRG sample with local spiral galaxies, we have used published observations from the HERA CO-Line Extragalactic Survey (HERACLES) (Leroy et al., 2009) and the Five College Radio Astronomy Observatory (FCRAO) (Young et al., 1995), for which CO and Herschel data are available. These include a total of 22 sources.
For comparison, our (U)LIRG sample has a median redshift (see Sect. 4 for details) of and a median of according to Armus et al. (2009), where the errors indicate the standard deviation of the sample. On the other hand, the local comparison sample (both HERACLES and FCRAO) has a median redshift of and a median of .
| Source name | R.A. | Dec. | |
|---|---|---|---|
| (J2000) | (J2000) | () | |
| NGC 0034 | 00 11 06.55 | -12 06 27.90 | 11.49 |
| Arp 256N | 00 18 50.17 | -10 21 44.78 | 11.48††footnotemark: † |
| Arp 256S | 00 18 50.90 | -10 22 36.19 | 11.48††footnotemark: † |
| IC 1623 | 01 07 47.53 | -17 30 25.88 | 11.71 |
| MCG -03-04-014 | 01 10 08.96 | -16 51 09.79 | 11.65 |
| IRAS F01364-1042 | 01 38 52.92 | -10 27 11.41 | 11.85 |
| IC 0214 | 02 14 05.47 | 05 10 25.21 | 11.43 |
| UGC 01845 | 02 24 07.99 | 47 58 10.81 | 11.12 |
| NGC 0958 | 02 30 42.85 | -02 56 20.51 | 11.20 |
| ESO 550-IG025 | 04 21 20.00 | -18 48 39.38 | 11.51 |
| UGC 03094 | 04 35 33.83 | 19 10 18.19 | 11.41 |
| NGC 1797 | 05 07 44.85 | -08 01 08.69 | 11.04 |
| IRAS F05189-2524 | 05 21 01.47 | -25 21 45.40 | 12.16 |
| IRAS F05187-1017 | 05 21 06.54 | -10 14 46.79 | 11.30 |
| IRAS F06076-2139 | 06 09 45.81 | -21 40 23.70 | 11.65 |
| NGC 2341 | 07 09 12.00 | 20 36 10.01 | 11.17 |
| NGC 2342 | 07 09 18.06 | 20 38 10.39 | 11.31 |
| IRAS 07251-0248 | 07 27 37.55 | -02 54 54.11 | 12.39 |
| IRAS F09111-1007 W | 09 13 36.40 | -10 19 30.00 | 12.06††footnotemark: † |
| IRAS F09111-1007 E | 09 13 38.80 | -10 19 20.32 | 12.06††footnotemark: † |
| UGC 05101 | 09 35 51.60 | 61 21 11.81 | 12.01 |
| 2MASX J11210825-0259399111111Southwest component of CGCG 011-076. | 11 21 08.28 | -02 59 39.01 | 11.43††footnotemark: † |
| CGCG 011-076 | 11 21 12.22 | -02 59 02.18 | 11.43††footnotemark: † |
| IRAS F12224-0624 | 12 25 03.89 | -06 40 51.71 | 11.36 |
| CGCG 043-099 | 13 01 50.80 | 04 19 59.99 | 11.68 |
| ESO 507-G070 | 13 02 52.35 | -23 55 17.69 | 11.56 |
| NGC 5104 | 13 21 23.10 | 00 20 32.89 | 11.27 |
| IC 4280 | 13 32 53.30 | -24 12 25.88 | 11.15 |
| NGC 5258 | 13 39 57.25 | 00 49 47.60 | 11.62††footnotemark: † |
| UGC 08739 | 13 49 13.91 | 35 15 26.21 | 11.15 |
| NGC 5331 | 13 52 16.20 | 02 06 05.62 | 11.66 |
| CGCG 247-020 | 14 19 43.21 | 49 14 11.90 | 11.39 |
| IRAS F14348-1447 | 14 37 38.34 | -15 00 22.79 | 12.39 |
| CGCG 049-057 | 15 13 13.09 | 07 13 32.02 | 11.35 |
| NGC 5936 | 15 30 00.86 | 12 59 22.20 | 11.14 |
| IRAS F16164-0746 | 16 19 11.79 | -07 54 02.81 | 11.62 |
| CGCG 052-037 | 16 30 56.50 | 04 04 58.51 | 11.45 |
| IRAS F16399-0937 | 16 42 40.21 | -09 43 14.41 | 11.63 |
| NGC 6285 | 16 58 23.99 | 58 57 21.31 | 11.37††footnotemark: † |
| NGC 6286 | 16 58 31.55 | 58 56 12.19 | 11.37††footnotemark: † |
| IRAS F17138-1017 | 17 16 35.76 | -10 20 39.80 | 11.49 |
| UGC 11041 | 17 54 51.83 | 34 46 34.50 | 11.11 |
| CGCG 141-034 | 17 56 56.63 | 24 01 01.31 | 11.20 |
| IRAS 18090+0130 | 18 11 38.41 | 01 31 40.12 | 11.65 |
| NGC 6701 | 18 43 12.50 | 60 39 11.20 | 11.12 |
| NGC 6786 | 19 10 54.00 | 73 24 35.71 | 11.49††footnotemark: † |
| UGC 11415 | 19 11 04.40 | 73 25 32.02 | 11.49††footnotemark: † |
| ESO 593-IG008 | 19 14 31.15 | -21 19 06.31 | 11.93 |
| NGC 6907 | 20 25 06.60 | -24 48 32.11 | 11.11 |
| IRAS 21101+5810 | 21 11 30.40 | 58 23 03.19 | 11.81 |
| ESO 602-G025 | 22 31 25.49 | -19 02 04.31 | 11.34 |
| UGC 12150 | 22 41 12.18 | 34 14 57.01 | 11.35 |
| IRAS F22491-1808 | 22 51 49.36 | -17 52 24.82 | 12.20 |
| CGCG 453-062 | 23 04 56.55 | 19 33 07.09 | 11.38 |
| 2MASX J23181352+0633267222222Southwest component of NGC 7591. | 23 18 13.52 | 06 33 26.50 | 11.12††footnotemark: † |
3 Observations and data reduction
The observations222Based on observations carried out with the IRAM-30 m Telescope. IRAM is supported by INSU/CNRS (France), MPG (Germany) and IGN (Spain). presented in this study were carried out with the Eight Mixer Receiver (EMIR) multiband millimeter-wave receiver (Carter et al., 2012) at the IRAM-30 m Telescope on Pico Veleta, Spain, in five observing periods: June 2010, September 2011, December 2011, October 2012 (PI: K. Iwasawa), and March 2014 (PI: R. Herrero-Illana). The final March 2014 run was obtained during the director’s discretionary time in order to verify the 13CO line strength of three sources (IRAS F05189-2524, IRAS 22491-1808, and IRAS 07251-0248). We tuned the receiver to two frequency windows: one centered at the redshifted frequencies of HCN and HCO (rest frequencies of 88.632 and 89.189 GHz, respectively; presented in Privon et al., 2015), and the other at the frequencies of 12CO and 13CO (rest frequencies of 115.271 and 110.201 GHz, respectively). The EMIR receiver has a total bandwidth of 8 GHz. All the observations were performed in wobbler switching mode. For the majority of the galaxies, the peak of their Spitzer IRAC channel 4 (i.e., 8m) emission was used as the pointing center. A complete journal of observations is presented in Table 2, along with the measured line intensities.
| Source name | Date | FWZI | ||||
| (min) | (K) | (Jy km s-1) | (Jy km s-1) | (km s-1) | ||
| (1) | (2) | (3) | (4) | (5) | (6) | (7) |
| NGC 0034 | 2011-09 | 10.5 | 278, 182 | |||
| Arp 256N | 2011-12 | 21.0 | 188, 138 | |||
| Arp 256S | 2011-12 | 16.0 | 197, 142 | |||
| IC 1623 | 2011-12 | 21.5 | 200, 143 | |||
| MCG -03-04-014 | 2011-12 | 16.0 | 175, 133 | |||
| IRAS F01364-1042 | 2011-09 | 21.0 | 171, 135 | |||
| IC 0214 | 2011-12 | 16.0 | 183, 177 | |||
| UGC 01845 | 2012-10 | 10.0 | 204, 140 | |||
| NGC 0958 | 2012-10 | 15.5 | 285, 176 | 12.1 2.1 | ||
| ESO 550-IG025 | 2011-09 | 16.0 | 222, 157 | |||
| UGC 03094 | 2012-10 | 10.0 | 197, 136 | |||
| NGC 1797 | 2012-10 | 15.5 | 219, 148 | |||
| IRAS F05189-2524 | 2014-03 | 128.0 | 236, 173 | |||
| IRAS F05187-1017 | 2014-03 | 51.0 | 166, 117 | |||
| IRAS F06076-2139 | 2011-09 | 16.0 | 200, 145 | 3.3 | ||
| NGC 2341 | 2014-03 | 25.5 | 235, 150 | |||
| NGC 2342 | 2012-10 | 15.5 | 169, 117 | |||
| IRAS 07251-0248 | 2014-03 | 21.5 | 136, 106 | |||
| IRAS F09111-1007 W | 2011-09 | 21.5 | 184, | |||
| IRAS F09111-1007 E | 2011-09 | 21.5 | 189, | |||
| UGC 05101 | 2010-06 | 53.0 | 159, 122 | |||
| 2MASX J11210825-0259399 | 2014-03 | 30.5 | 203, 134 | 3.7‡ | 3.7‡ | |
| CGCG 011-076 | 2012-10 | 10.0 | 201, 179 | |||
| IRAS F12224-0624 | 2014-03 | 20.5 | 190, 126 | |||
| CGCG 043-099 | 2011-09 | 26.5 | 194, 141 | |||
| ESO 507-G070 | 2011-12 | 10.5 | 227, 135 | |||
| NGC 5104 | 2012-10 | 10.0 | 186, 151 | |||
| IC 4280 | 2012-10 | 10.0 | 252, 178 | |||
| NGC 5258 | 2011-12 | 10.5 | 243, 145 | |||
| UGC 08739 | 2012-10 | 15.5 | 232, 166 | |||
| NGC 5331 | 2011-09 | 16.0 | 176, 134 | |||
| CGCG 247-020 | 2012-10 | 20.5 | 309, 231 | |||
| IRAS F14348-1447 | 2011-09 | 10.5 | 173, 147 | 6.3 | ||
| CGCG 049-057 | 2012-10 | 61.5 | 253, 179 | |||
| NGC 5936 | 2012-10 | 10.0 | 176, 122 | |||
| IRAS F16164-0746 | 2011-12 | 10.5 | 240, 152 | |||
| CGCG 052-037 | 2012-10 | 20.0 | 182, 125 | |||
| IRAS F16399-0937 | 2011-12 | 16.0 | 243, 154 | |||
| NGC 6285 | 2011-12 | 10.5 | 170, 109 | |||
| NGC 6286 | 2011-12 | 10.5 | 216, 116 | |||
| IRAS F17138-1017 | 2011-12 | 10.5 | 245, 141 | |||
| UGC 11041 | 2012-10 | 10.0 | 196, 148 | |||
| CGCG 141-034 | 2012-10 | 10.0 | 171, 118 | |||
| IRAS 18090+0130 | 2011-09 | 16.0 | 186, 137 | |||
| NGC 6701 | 2012-10 | 10.5 | 211, 155 | |||
| NGC 6786 | 2011-09 | 10.5 | 193, 134 | |||
| UGC 11415 | 2011-09 | 10.5 | 192, 134 | |||
| ESO 593-IG008 | 2014-03 | 20.5 | 190, 147 | |||
| NGC 6907 | 2012-10 | 15.5 | 367, 245 | |||
| IRAS 21101+5810 | 2011-09 | 10.5 | 165, 127 | |||
| ESO 602-G025 | 2014-03 | 25.5 | 251, 162 | |||
| UGC 12150 | 2012-10 | 15.5 | 247, 156 | |||
| IRAS F22491-1808 | 2014-03 | 133.0 | 142, 117 | |||
| CGCG 453-062 | 2012-10 | 15.5 | 293, 177 | |||
| 2MASX J23181352+0633267 | 2014-03 | 13.0 | 219, 147 | 7.5‡ | 7.5‡ |
† 13CO line was not observed for these sources due to a non-optimal receiver setup.
‡ To obtain the upper limits for the 12CO and 13CO non-detections, we have assumed a FWZI corresponding to the median of the sample.
| Source name | ||||
|---|---|---|---|---|
| ( K km s-1 pc2) | ( K km s-1 pc2) | () | ||
| (1) | (2) | (3) | (4) | (5) |
| NGC 0034 | ||||
| Arp 256N | ||||
| Arp 256S | ||||
| IC 1623 | ||||
| MCG -03-04-014 | ||||
| IRAS F01364-1042 | ||||
| IC 0214 | ||||
| UGC 01845 | ||||
| NGC 0958 | 2.300.41 | |||
| ESO 550-IG025 | ||||
| UGC 03094 | ||||
| NGC 1797 | ||||
| IRAS F05189-2524 | ||||
| IRAS F05187-1017 | ||||
| IRAS F06076-2139 | ||||
| NGC 2341 | ||||
| NGC 2342 | ||||
| IRAS 07251-0248 | ||||
| IRAS F09111-1007 W | ||||
| IRAS F09111-1007 E | ||||
| UGC 05101 | ||||
| 2MASX J11210825-0259399 | ||||
| CGCG 011-076 | ||||
| IRAS F12224-0624 | ||||
| CGCG 043-099 | ||||
| ESO 507-G070 | ||||
| NGC 5104 | ||||
| IC 4280 | ||||
| NGC 5258 | ||||
| UGC 08739 | ||||
| NGC 5331 | ||||
| CGCG 247-020 | ||||
| IRAS F14348-1447 | ||||
| CGCG 049-057 | ||||
| NGC 5936 | ||||
| IRAS F16164-0746 | ||||
| CGCG 052-037 | ||||
| IRAS F16399-0937 | ||||
| NGC 6285 | ||||
| NGC 6286 | ||||
| IRAS F17138-1017 | ||||
| UGC 11041 | ||||
| CGCG 141-034 | ||||
| IRAS 18090+0130 | ||||
| NGC 6701 | ||||
| NGC 6786 | ||||
| UGC 11415 | ||||
| ESO 593-IG008 | ||||
| NGC 6907 | ||||
| IRAS 21101+5810 | ||||
| ESO 602-G025 | ||||
| UGC 12150 | ||||
| IRAS F22491-1808 | ||||
| CGCG 453-062 | ||||
| 2MASX J23181352+0633267 |
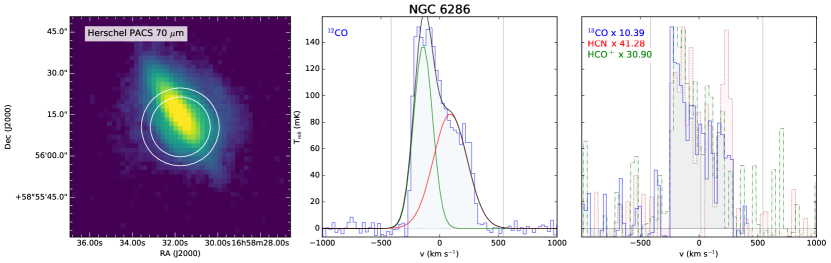
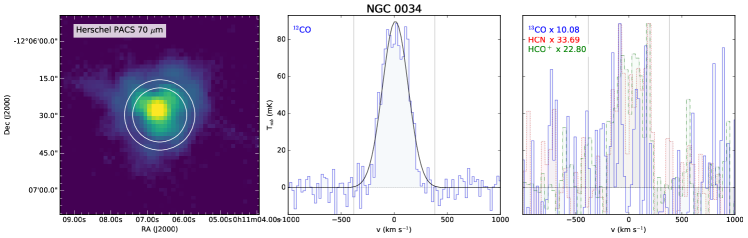
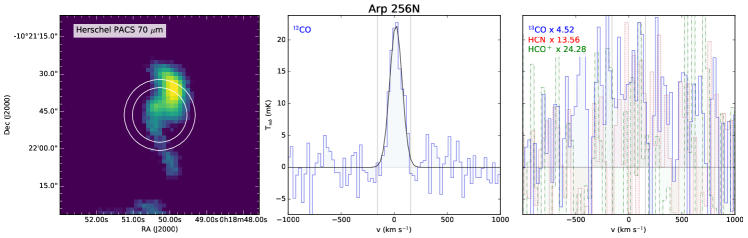
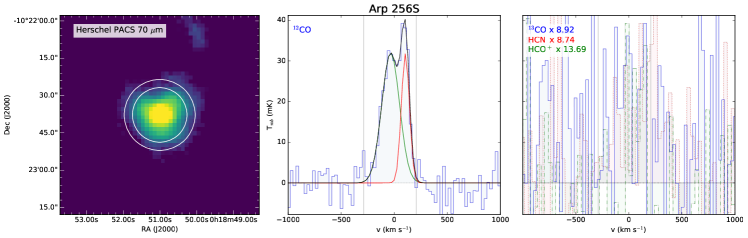
The data were reduced using the Continuum and Line Analysis Single-dish Software (CLASS)555http://iram.fr/IRAMFR/GILDAS/ package. For each scan, gain elevation calibration, platforming correction (when the Fast Fourier Transform Spectrometer (FTS) backend was used), and order one baseline subtraction were performed. Then, the scans for each galaxy were averaged together and the average spectrum was smoothed to km s-1 resolution. A final linear baseline was subtracted over the channels that did not contain line emission. We obtained line fluxes by integrating all channels within the line profile. To account for systematic uncertainties, we added a standard 10% of error in quadrature to the rms of the fluxes, which is the uncertainty for IRAM-30 m data as estimated by the observatory666http://www.iram.fr/GENERAL/calls/s17/30mCapabilities.pdf. Figure 2 contains an example of a resultant spectrum, and the spectra of the remaining galaxies are shown in Appendix A.
4 Results
In Tables 2 and 3 we present the measured and derived properties from the IRAM observations, respectively. From the 55 observed sources we detect 12CO in 53 () and 13CO in 29 (), above a level. The only two sources with no 12CO detection (2MASX J11210825-0259399 and 2MASX J23181352+0633267) are subcomponents of LIRGs and, given the non-detections, were excluded from the analysis. Line intensities and luminosities for 13CO were obtained by integrating over the velocity range corresponding to the 12CO detections. We find that of the sources show a multiple peak profile (see Figs. 2 and 9). For that reason, the full width at half maximum (FWHM) cannot be clearly determined, so we calculate the full width at zero intensity (FWZI), which was obtained as the width where the sum of the fitted Gaussians of each source (see Fig 2) is above 0.5 mK. The FWZI of our sample has a median value of km s-1.
We derived the integrated CO luminosities, measured in K km s-1 pc2, via
| (1) |
(Solomon et al., 1992), where is the velocity integrated flux (Jy km s-1), is the observed frequency (GHz), is the luminosity distance (Mpc), and is the redshift of each source, which was obtained from a visual determination of the center of the spectral profile. We use a point source sensitivity of Jy/K. Considering that and substituting GHz and GHz, we can rewrite Eq. (1) in the useful form
| (2) |
where and .
Three sources in our sample have available archive CO observations (Sanders et al., 1991) with the National Radio Astronomy Observatory (NRAO) 12 m telescope. Their CO flux for IRAS 22491-1808 (( K km s-1 pc2) is compatible with our results. On the other hand, their IRAS F05189-2524 and IRAS F14348-1447 measurements (( and K km s-1 pc2, respectively), although significantly higher, most likely due to extended emission and the larger FWHM of the NRAO 12 m telescope (55 arcsec), are also compatible with our result within . To take the extended emission into account, we have performed aperture photometry as detailed in Sect. 5.1.
We obtained the molecular gas mass () from the integrated CO intensities assuming a constant CO-to-H2 conversion factor, (K km s-1 pc2)-1. The derivation of this factor is also explained in detail in Sect. 5.1.
5 Discussion
The relationship between the molecular gas content and the star formation properties (rate, efficiency, or depletion time) has been thoroughly studied (e.g., Leroy et al., 2008; Daddi et al., 2010; Genzel et al., 2010). Our study allows us to constrain several of these correlations with a large and uniformly observed sample. However, to that end we first need to investigate whether the conversion between CO and H2, , is identical for local spiral galaxies and (U)LIRGs, as is often assumed, and determine its value.
5.1 Gas-to-dust ratio and determination of
There are extensive discussions in the literature over the proper value of to use when deriving molecular gas masses of (U)LIRGs (e.g., Solomon et al., 1997; Downes & Solomon, 1998; Yao et al., 2003; Papadopoulos et al., 2012a; Bolatto et al., 2013). Prior to 1997, the standard was to make use of the value of derived for the Milky Way, (K km s-1 pc2)-1, with the reasoning that the molecular gas was bound in physically distinct, virialized clouds, in which increases (decreases) in the temperature of the gas, , were offset by decreases (increases) in the gas density, ; that is,
| (3) |
(e.g., Scoville & Sanders, 1987). However, arguments based on estimates of dynamical masses in (U)LIRGs led to the hypothesis that was too high for this type of object. That is, the dynamical masses of (U)LIRGs as traced by CO kinematics were lower than the gas masses derived using – and therefore the value of in these extreme starburst galaxies should be at least proportionally lower (e.g., Downes & Solomon, 1998). It was speculated that a primary difference between normal spiral galaxies and (U)LIRGs is that the “inter-cloud” medium regions of the latter population likely contain significant amounts of molecular gas (Solomon et al., 1997); this means that the molecular gas distribution is more uniform within the starburst region, invalidating the Milky Way assumption of discrete molecular clouds.
To address this issue, in this paper we assume that (i) the relative mass fraction of atomic and molecular hydrogen is similar among our galaxies (), and (ii) any observed offset is driven by the physics setting the value of for each population. Therefore, we assume that
| (4) |
where n and L subscripts are used for normal and LIRGs, respectively (see Bolatto et al., 2013, for an extensive discussion of dust-based conversion factor determinations). To proceed, we used for comparison the Key Insights on Nearby Galaxies: a Far-Infrared Survey with Herschel (KINGFISH)777https://www.ast.cam.ac.uk/research/kingfish sample of local spiral galaxies observed with Herschel by Dale et al. (2012) that have pre-existing CO measurements in two surveys: the FCRAO extragalactic CO survey (Young et al., 1995), with 12CO(1-0) measurements, and the HERACLES survey from Leroy et al. (2009), with 12CO(2-1) observations, for which we have used a conversion factor of for the conversion between 12CO(2-1) and 12CO(1-0) as suggested by the authors (Leroy et al., 2009). Both sets of data encompass most of the galaxies’ emission. In particular, the FCRAO sample was observed with a 14 m dish (i.e., FWHM as large as arcsec), while the HERACLES galaxies were spatially mapped with the Heterodyne Receiver Array (HERA) multi-pixel receiver on the IRAM-30 m telescope.
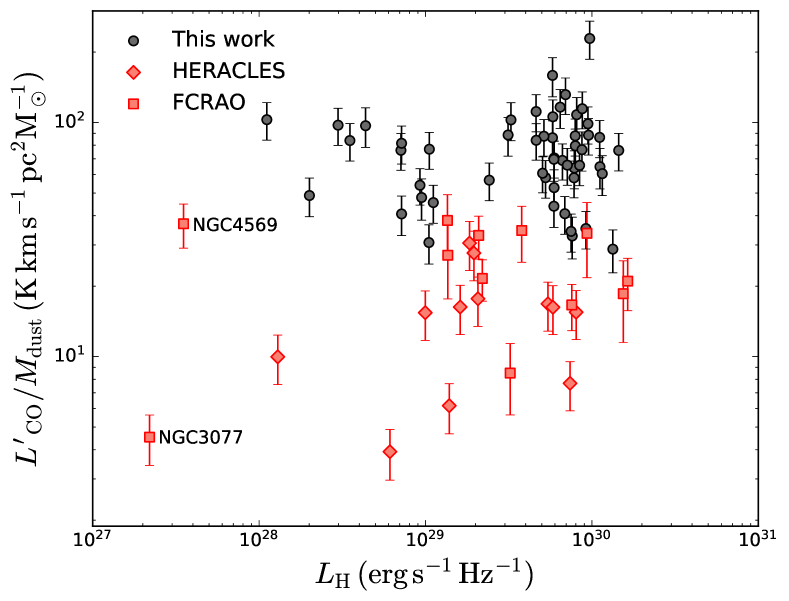
There is a correlation between the gas-to-dust ratio and both the stellar mass (Cortese et al., 2016) and metallicity (e.g., Rémy-Ruyer et al., 2014). These two correlations are likely linked through the mass-metallicity relation (Tremonti et al., 2004). To check whether we expect a variation of gas-to-dust ratios among our samples, we compared with the Two Micron All-Sky Survey (2MASS) H-band luminosity, which is a first order tracer of the stellar mass of galaxies. As shown in Fig. 3, we do not find any trend, either in our sample or in the comparison FCRAO or HERACLES sources, so no stellar mass correction was applied to our derived gas-to-dust ratios. The reason why a clear dependency is not seen in the figure is likely to be in the mass-metallicity relation itself: while we expect a difference in metallicity of dex for a stellar mass variation of two orders of magnitude (the range of GOALS galaxies is ) (Torrey et al., 2018), there is a large scatter between the two magnitudes, of approximately dex. This scatter is the cause of why we do not see variations with the gas-to-dust ratio over the traced range of stellar masses. From Fig. 3 it is also noticeable that two sources from the FCRAO comparison sample (NGC 3077 and NGC 4569) have significantly lower H-band luminosities than any other source in this study. These were excluded from the analysis below, as they are not representative of the global characteristics of both populations.
To obtain the dust properties of the galaxies, both for our sources and for the local comparison samples, we constructed far infrared (FIR) spectral energy distributions (SEDs) using the new Herschel photometric catalog by (Chu et al., 2017) between 70 and 350m in order to perform a model fitting. Although the angular resolution of the IRAM-30 m telescope () is generally sufficient to encompass most of the FIR extension of each galaxy, this is not always the case, as shown in the left panels of the molecular gas observations of Figs. 2 and 9, where we have plotted the IRAM beam sizes over the Herschel m images. In order to compare gas (derived from CO) and dust (derived from FIR) properties, it is essential to consider the same apertures for both datasets. To ensure this, we convolved our Herschel images to the angular resolution of our IRAM-30 m data using Gaussian smoothing, and performed aperture photometry centered in the IRAM-30 m pointing position. We did not smooth our Herschel Spectral and Photometric Imaging Receiver (SPIRE) m images, which already have a resolution () comparable with the 12CO measurements. We excluded our m images due to their coarser resolution than the IRAM-30 m beam.
We then fit each SED to an optically thin modified blackbody to derive the dust temperatures, , and masses, for each galaxy (see Appendix B). To calculate the dust masses, Scoville et al. (2016) argue for the use of a common mass-weighted dust temperature for all sources ( K), instead of that obtained from their individual SED fits, which is more representative from localized warm, luminous regions. In this paper we follow this strategy, so we note that any comparison between samples must take this difference into account. For our sample, the use of a fixed K yields an average 1.53 times higher than when a SED fitted temperature is used.
By integrating below the fitted blackbody we directly obtain the luminosity between 42.5 and 122.5 m, . Additionally, we also calculate the total infrared (TIR) luminosity (between 3 and 1100 m, ), making use of the prescription provided by Dale & Helou (2002):
| (5) |
using the Spitzer Multiband Imaging Photometer (MIPS) data from Mazzarella et al. (in prep.) for our galaxies (after applying the same Gaussian smoothing described above), and the local sample data from Dale et al. (2007, 2009) and Engelbracht et al. (2008). We note that the TIR luminosities are obtained from galaxy-integrated photometry, and thus are not matched to the IRAM beam. All fitted parameters (plus ) are presented in Table 4. For completeness, we provide as well the the galaxy-integrated parameters obtained by using the total flux for each filter (including SPIRE m in this case). Unless specifically mentioned otherwise, throughout this paper we always refer to or use the parameters obtained from the SED fitting to the aperture-matched photometry. For details on the modified blackbody SED fitting, we refer the reader to Appendix B.
| Overall SED fit | Within IRAM-30 m beam | ||||||||
| Source name | |||||||||
| (K) | () | () | (K) | () | () | () | () | ||
| NGC 0034 | |||||||||
| Arp 256N | |||||||||
| Arp 256S | |||||||||
| IC 1623 | |||||||||
| MCG -03-04-014 | |||||||||
| IRAS F01364-1042 | |||||||||
| IC 0214 | |||||||||
| UGC 01845 | |||||||||
| NGC 0958 | |||||||||
| ESO 550-IG025 | |||||||||
| UGC 03094 | |||||||||
| NGC 1797 | |||||||||
| IRAS F05189-2524 | |||||||||
| IRAS F05187-1017 | |||||||||
| IRAS F06076-2139 | |||||||||
| NGC 2341 | |||||||||
| NGC 2342 | |||||||||
| IRAS 07251-0248 | |||||||||
| IRAS F09111-1007 W | |||||||||
| IRAS F09111-1007 E | |||||||||
| UGC 05101 | |||||||||
| 2MASX J11210825-0259399 | |||||||||
| CGCG 011-076 | |||||||||
| IRAS F12224-0624 | |||||||||
| CGCG 043-099 | |||||||||
| ESO 507-G070 | |||||||||
| NGC 5104 | |||||||||
| IC 4280 | |||||||||
| NGC 5258 | |||||||||
| UGC 08739 | |||||||||
| NGC 5331 | |||||||||
| CGCG 247-020 | |||||||||
| IRAS F14348-1447 | |||||||||
| CGCG 049-057 | |||||||||
| NGC 5936 | |||||||||
| IRAS F16164-0746 | |||||||||
| CGCG 052-037 | |||||||||
| IRAS F16399-0937 | |||||||||
| NGC 6285 | |||||||||
| NGC 6286 | |||||||||
| IRAS F17138-1017 | |||||||||
| UGC 11041 | |||||||||
| CGCG 141-034 | |||||||||
| IRAS 18090+0130 | |||||||||
| NGC 6701 | |||||||||
| NGC 6786 | |||||||||
| UGC 11415 | |||||||||
| ESO 593-IG008 | |||||||||
| NGC 6907 | |||||||||
| IRAS 21101+5810 | |||||||||
| ESO 602-G025 | |||||||||
| UGC 12150 | |||||||||
| IRAS F22491-1808 | |||||||||
| CGCG 453-062 | |||||||||
| 2MASX J23181352+0633267 | |||||||||
In Fig. 4 we show the gas-to-dust mass ratio () for both our (U)LIRGs and the local control sample (FCRAO + HERACLES) as a function of the star formation rate (SFR) surface density (; obtained from Leroy et al. (2013) and Díaz-Santos et al. (2017)), showing that the two populations have distinctly different and thus physical conditions (e.g., Díaz-Santos et al., 2017). The top panels of the figure show the gas-to-dust mass ratios obtained by deriving the dust masses based on the fitted 250 m continuum, using a mass absorption coefficient of (see Appendix B for details) and by leaving and as free parameters. The middle panels are the same as the top, but for a fixed emissivity index of (Planck Collaboration et al., 2011). Finally, the bottom panels show the gas-to-dust mass ratios obtained by fixing and assuming a fixed 25 K dust temperature for every source, as proposed by Scoville et al. (2016). For the remainder of the discussion we have adopted the results from the latter method, while we occasionally refer to the results obtained when letting free.
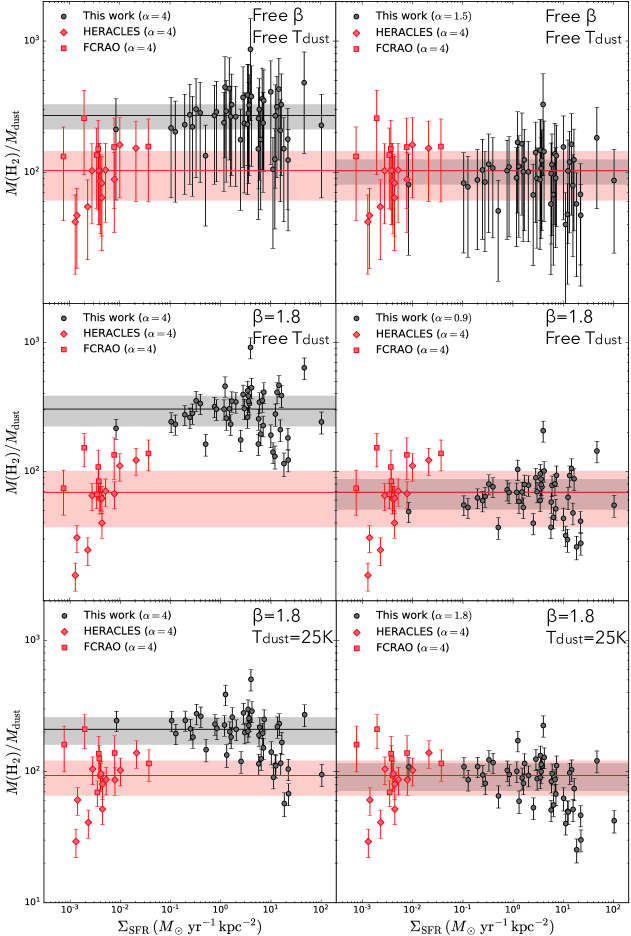
If a Milky Way is adopted for the reference sample of normal star-forming galaxies, we find that in order to match the offset between the median gas-to-dust ratio of (U)LIRGs relative to the reference sample, within their median absolute deviations, it is necessary to adopt a value (K km s-1 pc2)-1, assuming a fixed . If we instead use the dust temperatures from SED fitting to derive the dust masses, we require in order to match the gas-to-dust ratios. Our derived value of is compatible with the values derived by Downes & Solomon (1998) (), Papadopoulos et al. (2012a) (), and Scoville et al. (2015) for the (U)LIRG Arp 220 ().
5.1.1 Impact of varying ISM assumptions
We stress that our derived value of strongly depends on two assumptions: a constant gas-to-dust ratio and a constant relative fraction of atomic to molecular hydrogen gas, . Some studies have claimed evidence of the gas-to-dust ratio of (U)LIRGs being compatible with that of normal galaxies (see, e.g., Wilson et al., 2008). However, these ratios are calibrated based on a lower value of for (U)LIRGs, falling in a circular argument.
In any case, even if either of the two ratios is proven to be different in LIRGs, the following relation derived from Eq. 4 and the offset between samples seen in Fig. 4 should still hold:
| (6) |
We note that if the assumption is made that the gas-to-dust mass ratio and are constant, but instead we vary the relative fraction of atomic to molecular gas between the two samples, the end result would be a decrease in for the (U)LIRGs. In particular, we would get . This equation yields unphysical negative values for any value below . The observed difference in Fig. 4 between the two is unlikely thus to be ascribed solely to a different .
5.2 Star formation efficiencies and gas depletion timescales
Figure 5 shows the FIR (derived from the modified blackbody SED fits) and the TIR (obtained from Eq. 5) luminosities as a function of the for our sample of GOALS galaxies and for the local comparison samples. In optically thick environments, and in the absence of significant dust heating by an active galactic nucleus (AGN), the plot of versus is essentially a comparison between the energy generated by the embedded starburst(s) versus the total reservoir of gas available to form new stars.
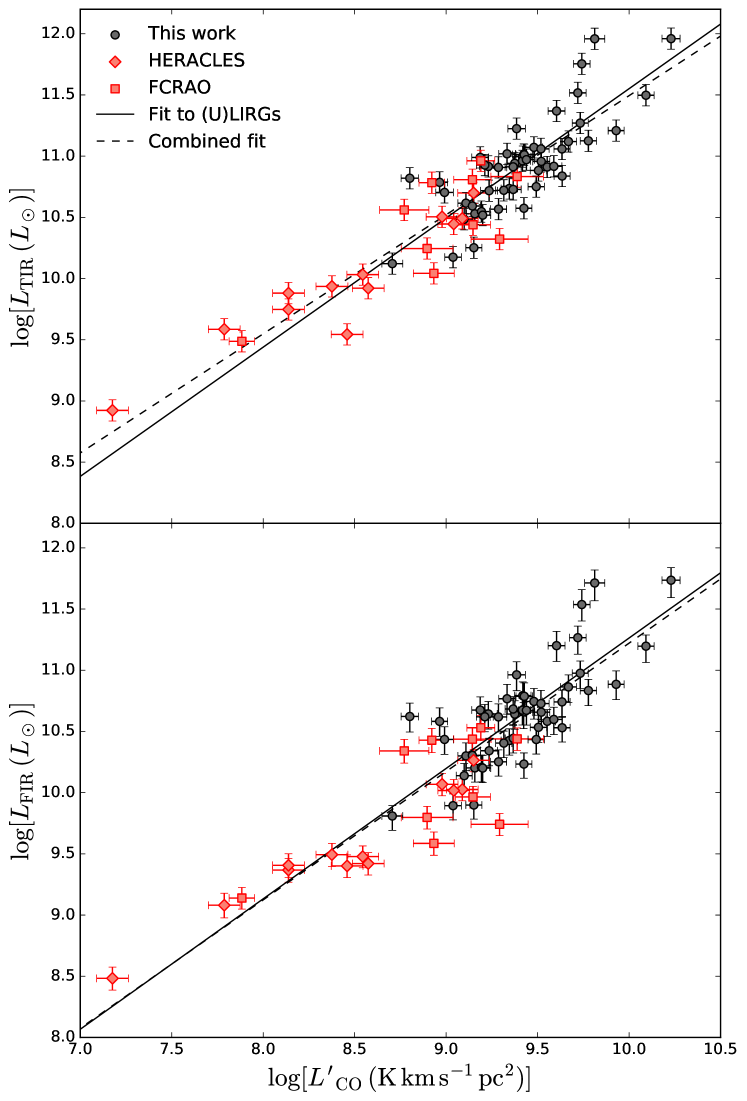
For the purpose of fitting the data, we excluded (U)LIRGs where an AGN contributes to the energy output, where we used the AGN bolometric fractions obtained from the combination of several mid-IR diagnostics (Díaz-Santos et al., 2017). The reason behind this exclusion is to avoid contamination in the estimation of the star formation rates, efficiencies, and gas depletion times, as strong AGN can contribute significantly to the FIR luminosity. These sources were not excluded from the analysis in Sect. 5.1 because there is not a known dependence of gas-to-dust mass ratio with AGN fraction, and our size sample does not allow us to study possible effects on it. No sources were removed from the local comparison sample, which is not dominated by AGN by design.
Three sources were discarded based on the above AGN criterion: NGC 0958, UGC 05101, and IRAS F05189-2524. Furthermore, to avoid the instability of ordinary least-squares fits when both dependent and independent variables have an associated error, we followed the same approach as Greve et al. (2014) and used a Bayesian method to fit the data. Specifically, we used Josh Mayer’s Python port999https://github.com/jmeyers314/linmix/ of the LINMIX_ERR IDL package (Kelly, 2007).
The combined fit (our (U)LIRG sample and the local, normal, star-forming sources) to the data in Fig. 5 has the functional form
| (7) |
with median Pearson correlation coefficients of and , respectively, and a robust statistical significance (-values of and , respectivey). We note that is derived from integrated-galaxy photometry (see Eq. 5), while is obtained from integrating the fit to the aperture-matched SEDs. More luminous galaxies, with warmer dust, will have a larger contribution to the emission from shorter wavelengths (our fit uses ), and thus could be underestimated for those sources. We find, however, that there is no significant difference in the use of or for our sample. By comparison, Greve et al. (2014) derived a linear value for the slope of and for and , respectively. Their luminosity dynamic range was . We also note that their sample included high-z galaxies which, if they had not been included, would have caused the slope to be sub-linear. We only find a very slight steepening in the slope of the fit to the (U)LIRGs with respect to the local comparison sample, but not as pronounced as found by Gao & Solomon (2004), where a clear super-linear slope is derived.
A way of interpreting the relation between infrared and CO luminosities is through the star formation efficiency, which is the ratio of the total energy from young massive stars per unit of star-forming molecular gas, and which is usually represented by . However, the use of can be misleading, as it cannot be directly converted into a estimate without the use of an conversion factor, which we showed to vary between the samples in Sect. 5.1.
We can rework the above in terms of the gas depletion timescales, , where the molecular gas mass is derived using (K km s-1 pc2)-1 for (U)LIRGs (see Sect. 5.1), and the Milky Way value for the local sample. The star formation rate (SFR) is obtained from the infrared and UV luminosity (see Murphy et al., 2011)
| (8) |
where we have used our aperture-matched, SED-derived FIR luminosity, while the UV luminosities (integrated luminosity within the GALEX far ultraviolet (FUV) filter; Å) were obtained from Howell et al. (2010) for the (U)LIRGs, and from the GALEX Ultraviolet Atlas of Nearby Galaxies (Gil de Paz et al., 2007) for the local comparison sample. Most of the UV emission is expected to be inside the IRAM-30 m beam, thus any correction would be within the errors.
Figure 6 presents the variation of as a function of . Fits to the trends considering all three samples combined yield the correlations
| (9) |
with median Pearson correlation coefficients of and , respectively, and p-values of and , showing a moderately strong statistical significance.
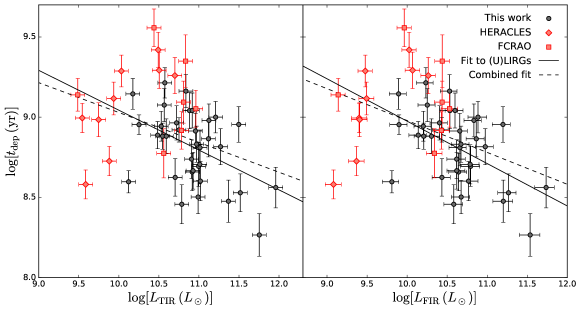
We obtain a median of 1.3 Gyr for the local sample, compared to the 2.1 Gyr from Kennicutt (1998) or 2.35 Gyr from Bigiel et al. (2011). This timescale is obtained assuming there is not gas replenishing and that there is a constant star formation rate. We note that increases by a factor of two to three if interstellar gas recycling is considered (Ostriker & Thuan, 1975; Kennicutt et al., 1994). Nevertheless, the above correlation shows that L⊙ LIRGs would deplete their available gas in Myr, whereas L⊙ ULIRGs would deplete their gas in Myr, a period more than three times shorter than for local normal spiral galaxies. The compression of the molecular gas clouds due to large-scale shocks, which would enhance star formation, has been proposed to account for this difference (Jog & Solomon, 1992; Barnes, 2004; Genzel et al., 2010). However, the quoted depletion times are obtained from the total molecular gas (as traced by 12CO ), and not specifically from the dense gas phase of the molecular medium, which is expected to be more closely associated to regions where star formation is imminent.
We note the strong dependence of depletion time (Eq. 9) with . Indeed, if dust masses were derived using the fitted instead of the fixed 25 K, the relation would be , implying an even larger difference (one order of magnitude) in the depletion time between (U)LIRGs and the comparison local sample.
Finally, if fitted are used to estimate the dust masses, our data also show a clear correlation between the depletion time and the dust temperature as shown in Fig. 7. The fit of the combined data yields
| (10) |
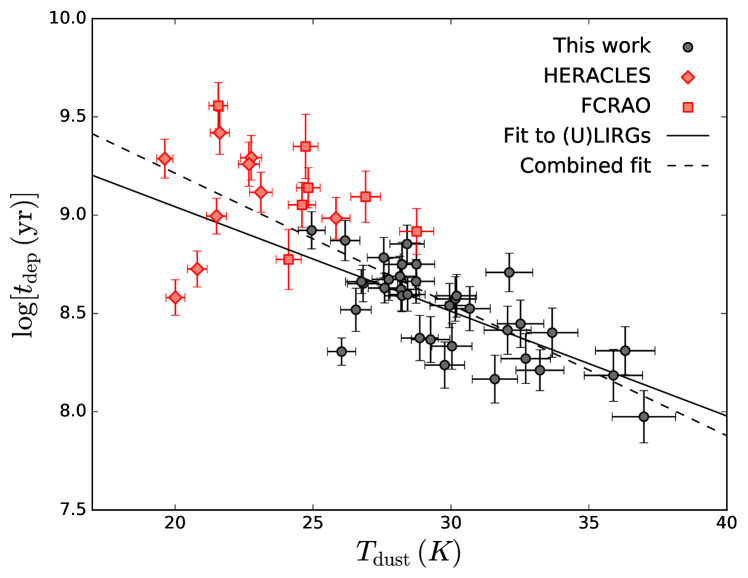
with , and a robust statistical significance (p-value of ). This trend shows a very sensitive variation, with depleting times being one order of magnitude lower with an increase of K. In other words, the star formation efficiency () increases by a factor of ten by such variation in the dust temperature.
5.3 The 12CO / 13CO line intensity ratio
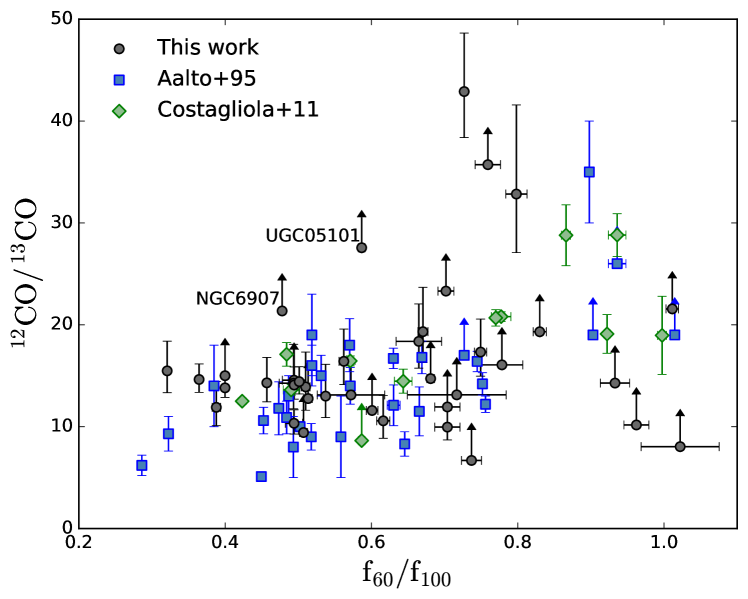
In this sub-section, we examine the relationship between the 12CO /13CO line intensity ratio and the dust temperature. In Fig. 8 we present a plot of 12CO /13CO for the (U)LIRGs in our sample versus the 60 m-to-100 m IRAS flux density ratio , which is used as a proxy for the dust temperature. We do not use here our SED-fit-derived so as to be able to systematically compare with previous studies on LIRGs (for which Herschel photometry is not available). We have confirmed nonetheless the very good correlation between and the derived for our sample, finding . The data from the present study are compared with published results from Aalto et al. (1995) and Costagliola et al. (2011). The former is formed of 31 local spiral galaxies, starbursts, interacting systems, and luminous mergers, while the latter includes a representation of 12 Seyferts, starbursts, and LIRGs. Our results are in agreement with those studies, finding lower values of 12CO/13CO for , and a relatively steep enhancement for . This cutoff point corresponds to K. This general trend is also in agreement with Milky Way measurements of molecular clouds (Barnes et al., 2015). Only two of the sources in our sample present a lower-limit value that seems at odds with this behavior, showing too large 12CO/13CO ratios ( and ) for their FIR color ( and ). These are NGC 6907 and UGC 05101, and they are marked in Fig. 8 with their names.
The above relation can be explained as a result of the decreasing optical depth of the 12CO line with increasing ISM temperature (e.g., Young & Sanders, 1986; Aalto et al., 1995). Increased linewidths in diffuse or turbulent gas may also result in decreased line optical depths and elevated line ratios (see, e.g., Polk et al., 1988; Aalto et al., 1995, 2010; König et al., 2016).
In addition to optical depth effects, the relative 12CO and 13CO abundances ratio will impact the intensity ratio. The less abundant isotopomer of 13CO will become selectively photodissociated in diffuse gas since it cannot self-shield like 12CO . Furthermore, stellar nucleosynthesis will alter the 12C/13C abundance ratio and low-metallicity gas is expected to have high 12C/13C ratios (see, e.g., Casoli et al., 1992; Henkel et al., 2014; Tang et al., 2019). The ejecta of massive stars are also expected to have higher 12C/13C abundance ratios, which means that in the early stages of a starburst 12CO /13CO abundance ratios may be higher. Indeed, there seems to be an enrichment of the ISM due to a young starburst and/or a top-heavy initial mass function (Sliwa et al., 2017).
6 Summary
We observed 55 (U)LIRGs with the IRAM-30 m Telescope. In this work, we have focused on the 12CO transition as a tracer of molecular gas. We summarize our results as follows:
-
1.
We observed 12CO and 13CO simultaneously, in the same band, obtaining detection rates of 96% and 56% for 12CO and 13CO , respectively, as expected from 13CO being much less abundant than 12CO .
-
2.
We have used Herschel data to construct the far infrared SED of the emitting region inside the IRAM-30 m beam for each galaxy in our sample, and fitted the SED to a modified blackbody model, obtaining the dust masses and temperatures, as well as . We also have systematically fitted local galaxies from HERACLES and FCRAO, for which both CO and Herschel data are available, to be used as a local comparison sample. Complementarily, we have used MIPS data to derive the total IR luminosities, , for both samples.
-
3.
We have determined an average CO-to-H2 conversion factor for (U)LIRGs of (K km s-1 pc2)-1, times smaller than the accepted conversion factor for local spiral galaxies, for an assumed constant gas-to-dust mass ratio between the local comparison sample and the (U)LIRGs sample. This value is obtained by assuming a fixed dust temperature of 25 K for every source. If the SED fitted temperatures are used instead, the average value of for (U)LIRGs would be .
-
4.
We confirm the close linear correlation between the CO luminosity and . We have also found an enhancement in the star formation efficiency for more IR-luminous systems. Consequently, the depletion time for these systems is shorter, following a correlation with . However, this effect with is not observed in the higher density phase of molecular gas. When are derived from fitted , the also shows a clear decreasing trend with dust temperature, implying an increase of one order of magnitude in the star formation efficiency per increase of K.
-
5.
We have re-examined the variation between the ratio of 12CO and its isotopologue 13CO with the dust temperature, as traced by the proxy . Our data confirm previous results, with cooler galaxies having lower 12CO / 13CO ratios, with a steep increase above .
Acknowledgements.
We thank the anonymous referee for the useful comments. We also thank Nick Scoville for his discussion and comments on the paper. We are grateful to Manuel González for his help in the preparation of the scripts and during the observations. This work is based on observations carried out under project numbers 099-10, 092-11, 227-11, 076-12, 222-13, and D01-13 with the 30m telescope. IRAM is supported by INSU/CNRS (France), MPG (Germany), and IGN (Spain). We thank the director of IRAM 30m for the approval of the discretionary time requested. RHI, MAPT, and AA acknowledge support from the Spanish MINECO through grants AYA2012-38491-C02-02 and AYA2015-63939-C2-1-P. G.C.P. was supported by a FONDECYT Postdoctoral Fellowship (No. 3150361). T.D.-S. acknowledges support from ALMA-CONICYT project 31130005 and FONDECYT regular project 1151239. This work was supported in part by National Science Foundation grant No. PHYS-1066293 and the hospitality of the Aspen Center for Physics. This research has made use of the NASA/IPAC Extragalactic Database (NED), which is operated by the Jet Propulsion Laboratory, California Institute of Technology, under contract with the National Aeronautics and Space Administration.References
- Aalto et al. (2010) Aalto, S., Beswick, R., & Jütte, E. 2010, A&A, 522, A59
- Aalto et al. (1995) Aalto, S., Booth, R. S., Black, J. H., & Johansson, L. E. B. 1995, A&A, 300, 369
- Armus et al. (2009) Armus, L., Mazzarella, J. M., Evans, A. S., et al. 2009, PASP, 121, 559
- Barnes (2004) Barnes, J. E. 2004, MNRAS, 350, 798
- Barnes et al. (2015) Barnes, P. J., Muller, E., Indermuehle, B., et al. 2015, ApJ, 812, 6
- Bianchi (2013) Bianchi, S. 2013, A&A, 552, A89
- Bigiel et al. (2011) Bigiel, F., Leroy, A. K., Walter, F., et al. 2011, ApJ, 730, L13
- Blain et al. (2003) Blain, A. W., Barnard, V. E., & Chapman, S. C. 2003, MNRAS, 338, 733
- Bolatto et al. (2013) Bolatto, A. D., Wolfire, M., & Leroy, A. K. 2013, ARA&A, 51, 207
- Bryant & Scoville (1999) Bryant, P. M. & Scoville, N. Z. 1999, AJ, 117, 2632
- Carter et al. (2012) Carter, M., Lazareff, B., Maier, D., et al. 2012, A&A, 538, A89
- Casoli et al. (1992) Casoli, F., Dupraz, C., & Combes, F. 1992, A&A, 264, 55
- Chu et al. (2017) Chu, J. K., Sanders, D. B., Larson, K. L., et al. 2017, ArXiv e-prints [arXiv:1702.01756]
- Cortese et al. (2016) Cortese, L., Bekki, K., Boselli, A., et al. 2016, MNRAS, 459, 3574
- Costagliola et al. (2011) Costagliola, F., Aalto, S., Rodriguez, M. I., et al. 2011, A&A, 528, A30
- Crocker et al. (2012) Crocker, A., Krips, M., Bureau, M., et al. 2012, MNRAS, 421, 1298
- Daddi et al. (2010) Daddi, E., Elbaz, D., Walter, F., et al. 2010, ApJ, 714, L118
- Dale et al. (2012) Dale, D. A., Aniano, G., Engelbracht, C. W., et al. 2012, ApJ, 745, 95
- Dale et al. (2009) Dale, D. A., Cohen, S. A., Johnson, L. C., et al. 2009, ApJ, 703, 517
- Dale et al. (2007) Dale, D. A., Gil de Paz, A., Gordon, K. D., et al. 2007, ApJ, 655, 863
- Dale & Helou (2002) Dale, D. A. & Helou, G. 2002, ApJ, 576, 159
- Davies et al. (2012) Davies, J. I., Bianchi, S., Cortese, L., et al. 2012, MNRAS, 419, 3505
- Díaz-Santos et al. (2010) Díaz-Santos, T., Alonso-Herrero, A., Colina, L., et al. 2010, ApJ, 711, 328
- Díaz-Santos et al. (2017) Díaz-Santos, T., Armus, L., Charmandaris, V., et al. 2017, ApJ, 846, 32
- Díaz-Santos et al. (2011) Díaz-Santos, T., Charmandaris, V., Armus, L., et al. 2011, ApJ, 741, 32
- Downes & Solomon (1998) Downes, D. & Solomon, P. M. 1998, ApJ, 507, 615
- Draine & Lee (1984) Draine, B. T. & Lee, H. M. 1984, ApJ, 285, 89
- Engelbracht et al. (2008) Engelbracht, C. W., Rieke, G. H., Gordon, K. D., et al. 2008, ApJ, 678, 804
- Gao & Solomon (2004) Gao, Y. & Solomon, P. M. 2004, ApJ, 606, 271
- Genzel et al. (2010) Genzel, R., Tacconi, L. J., Gracia-Carpio, J., et al. 2010, MNRAS, 407, 2091
- Gil de Paz et al. (2007) Gil de Paz, A., Boissier, S., Madore, B. F., et al. 2007, ApJS, 173, 185
- Greve et al. (2014) Greve, T. R., Leonidaki, I., Xilouris, E. M., et al. 2014, ApJ, 794, 142
- Haan et al. (2011) Haan, S., Surace, J. A., Armus, L., et al. 2011, AJ, 141, 100
- Henkel et al. (2014) Henkel, C., Asiri, H., Ao, Y., et al. 2014, A&A, 565, A3
- Hinshaw et al. (2013) Hinshaw, G., Larson, D., Komatsu, E., et al. 2013, ApJS, 208, 19
- Howell et al. (2010) Howell, J. H., Armus, L., Mazzarella, J. M., et al. 2010, ApJ, 715, 572
- Iwasawa et al. (2011) Iwasawa, K., Sanders, D. B., Teng, S. H., et al. 2011, A&A, 529, A106
- Jog & Solomon (1992) Jog, C. J. & Solomon, P. M. 1992, ApJ, 387, 152
- Kelly (2007) Kelly, B. C. 2007, ApJ, 665, 1489
- Kennicutt (1998) Kennicutt, Jr., R. C. 1998, ARA&A, 36, 189
- Kennicutt et al. (1994) Kennicutt, Jr., R. C., Tamblyn, P., & Congdon, C. E. 1994, ApJ, 435, 22
- Kim et al. (2013) Kim, D.-C., Evans, A. S., Vavilkin, T., et al. 2013, ApJ, 768, 102
- König et al. (2016) König, S., Aalto, S., Muller, S., et al. 2016, A&A, 594, A70
- Leroy et al. (2009) Leroy, A. K., Walter, F., Bigiel, F., et al. 2009, AJ, 137, 4670
- Leroy et al. (2008) Leroy, A. K., Walter, F., Brinks, E., et al. 2008, AJ, 136, 2782
- Leroy et al. (2013) Leroy, A. K., Walter, F., Sandstrom, K., et al. 2013, AJ, 146, 19
- Murphy et al. (2011) Murphy, E. J., Condon, J. J., Schinnerer, E., et al. 2011, ApJ, 737, 67
- Narayanan et al. (2005) Narayanan, D., Groppi, C. E., Kulesa, C. A., & Walker, C. K. 2005, ApJ, 630, 269
- Ostriker & Thuan (1975) Ostriker, J. P. & Thuan, T. X. 1975, ApJ, 202, 353
- Papadopoulos et al. (2012a) Papadopoulos, P. P., van der Werf, P., Xilouris, E., Isaak, K. G., & Gao, Y. 2012a, ApJ, 751, 10
- Papadopoulos et al. (2012b) Papadopoulos, P. P., van der Werf, P. P., Xilouris, E. M., et al. 2012b, MNRAS, 426, 2601
- Petric et al. (2011) Petric, A. O., Armus, L., Howell, J., et al. 2011, ApJ, 730, 28
- Planck Collaboration et al. (2011) Planck Collaboration, Abergel, A., Ade, P. A. R., et al. 2011, A&A, 536, A21
- Polk et al. (1988) Polk, K. S., Knapp, G. R., Stark, A. A., & Wilson, R. W. 1988, ApJ, 332, 432
- Privon et al. (2015) Privon, G. C., Herrero-Illana, R., Evans, A. S., et al. 2015, ArXiv e-prints [arXiv:1509.07512]
- Rémy-Ruyer et al. (2014) Rémy-Ruyer, A., Madden, S. C., Galliano, F., et al. 2014, A&A, 563, A31
- Sanders et al. (2003) Sanders, D. B., Mazzarella, J. M., Kim, D.-C., Surace, J. A., & Soifer, B. T. 2003, AJ, 126, 1607
- Sanders et al. (1991) Sanders, D. B., Scoville, N. Z., & Soifer, B. T. 1991, ApJ, 370, 158
- Scoville et al. (2016) Scoville, N., Sheth, K., Aussel, H., et al. 2016, ApJ, 820, 83
- Scoville et al. (2015) Scoville, N., Sheth, K., Walter, F., et al. 2015, ApJ, 800, 70
- Scoville & Sanders (1987) Scoville, N. Z. & Sanders, D. B. 1987, in Astrophysics and Space Science Library, Vol. 134, Interstellar Processes, ed. D. J. Hollenbach & H. A. Thronson, Jr., 21–50
- Sliwa et al. (2017) Sliwa, K., Wilson, C. D., Aalto, S., & Privon, G. C. 2017, ApJ, 840, L11
- Soifer et al. (1986) Soifer, B. T., Sanders, D. B., Neugebauer, G., et al. 1986, ApJ, 303, L41
- Solomon et al. (1992) Solomon, P. M., Downes, D., & Radford, S. J. E. 1992, ApJ, 398, L29
- Solomon et al. (1997) Solomon, P. M., Downes, D., Radford, S. J. E., & Barrett, J. W. 1997, ApJ, 478, 144
- Stierwalt et al. (2014) Stierwalt, S., Armus, L., Charmandaris, V., et al. 2014, ApJ, 790, 124
- Stierwalt et al. (2013) Stierwalt, S., Armus, L., Surace, J. A., et al. 2013, ApJS, 206, 1
- Tang et al. (2019) Tang, X. D., Henkel, C., Menten, K. M., et al. 2019, arXiv e-prints, arXiv:1906.06638
- Tinney et al. (1990) Tinney, C. G., Scoville, N. Z., Sanders, D. B., & Soifer, B. T. 1990, ApJ, 362, 473
- Torrey et al. (2018) Torrey, P., Vogelsberger, M., Hernquist, L., et al. 2018, MNRAS, 477, L16
- Tremonti et al. (2004) Tremonti, C. A., Heckman, T. M., Kauffmann, G., et al. 2004, ApJ, 613, 898
- Wilson et al. (2008) Wilson, C. D., Petitpas, G. R., Iono, D., et al. 2008, ApJS, 178, 189
- Yao et al. (2003) Yao, L., Seaquist, E. R., Kuno, N., & Dunne, L. 2003, ApJ, 588, 771
- Young & Sanders (1986) Young, J. S. & Sanders, D. B. 1986, ApJ, 302, 680
- Young et al. (1995) Young, J. S., Xie, S., Tacconi, L., et al. 1995, ApJS, 98, 219
Appendix A Observed spectra and fitted Gaussian line components
Figure 9 presents the same results as Fig. 2 for our complete sample. We have also tabulated in Table 5 the Gaussian components that were fitted to the 12CO spectra.
![[Uncaptioned image]](/html/1907.03854/assets/x12.png)
![[Uncaptioned image]](/html/1907.03854/assets/x13.png)
![[Uncaptioned image]](/html/1907.03854/assets/x14.png)
![[Uncaptioned image]](/html/1907.03854/assets/x15.png) \contcaption
\contcaption
continued
![[Uncaptioned image]](/html/1907.03854/assets/x16.png)
![[Uncaptioned image]](/html/1907.03854/assets/x17.png)
![[Uncaptioned image]](/html/1907.03854/assets/x18.png)
![[Uncaptioned image]](/html/1907.03854/assets/x19.png) \contcaption
\contcaption
continued
![[Uncaptioned image]](/html/1907.03854/assets/x20.png)
![[Uncaptioned image]](/html/1907.03854/assets/x21.png)
![[Uncaptioned image]](/html/1907.03854/assets/x22.png)
![[Uncaptioned image]](/html/1907.03854/assets/x23.png) \contcaption
\contcaption
continued
![[Uncaptioned image]](/html/1907.03854/assets/x24.png)
![[Uncaptioned image]](/html/1907.03854/assets/x25.png)
![[Uncaptioned image]](/html/1907.03854/assets/x26.png)
![[Uncaptioned image]](/html/1907.03854/assets/x27.png) \contcaption
\contcaption
continued
![[Uncaptioned image]](/html/1907.03854/assets/x28.png)
![[Uncaptioned image]](/html/1907.03854/assets/x29.png)
![[Uncaptioned image]](/html/1907.03854/assets/x30.png)
![[Uncaptioned image]](/html/1907.03854/assets/x31.png) \contcaption
\contcaption
continued
![[Uncaptioned image]](/html/1907.03854/assets/x32.png)
![[Uncaptioned image]](/html/1907.03854/assets/x33.png)
![[Uncaptioned image]](/html/1907.03854/assets/x34.png)
![[Uncaptioned image]](/html/1907.03854/assets/x35.png) \contcaption
\contcaption
continued
![[Uncaptioned image]](/html/1907.03854/assets/x36.png)
![[Uncaptioned image]](/html/1907.03854/assets/x37.png)
![[Uncaptioned image]](/html/1907.03854/assets/x38.png)
![[Uncaptioned image]](/html/1907.03854/assets/x39.png) \contcaption
\contcaption
continued
![[Uncaptioned image]](/html/1907.03854/assets/x40.png)
![[Uncaptioned image]](/html/1907.03854/assets/x41.png)
![[Uncaptioned image]](/html/1907.03854/assets/x42.png)
![[Uncaptioned image]](/html/1907.03854/assets/x43.png) \contcaption
\contcaption
continued
![[Uncaptioned image]](/html/1907.03854/assets/x44.png)
![[Uncaptioned image]](/html/1907.03854/assets/x45.png)
![[Uncaptioned image]](/html/1907.03854/assets/x46.png)
![[Uncaptioned image]](/html/1907.03854/assets/x47.png) \contcaption
\contcaption
continued
![[Uncaptioned image]](/html/1907.03854/assets/x48.png)
![[Uncaptioned image]](/html/1907.03854/assets/x49.png)
![[Uncaptioned image]](/html/1907.03854/assets/x50.png)
![[Uncaptioned image]](/html/1907.03854/assets/x51.png) \contcaption
\contcaption
continued
![[Uncaptioned image]](/html/1907.03854/assets/x52.png)
![[Uncaptioned image]](/html/1907.03854/assets/x53.png)
![[Uncaptioned image]](/html/1907.03854/assets/x54.png)
![[Uncaptioned image]](/html/1907.03854/assets/x55.png) \contcaption
\contcaption
continued
![[Uncaptioned image]](/html/1907.03854/assets/x56.png)
![[Uncaptioned image]](/html/1907.03854/assets/x57.png)
![[Uncaptioned image]](/html/1907.03854/assets/x58.png)
![[Uncaptioned image]](/html/1907.03854/assets/x59.png) \contcaption
\contcaption
continued
![[Uncaptioned image]](/html/1907.03854/assets/x60.png)
![[Uncaptioned image]](/html/1907.03854/assets/x61.png)
![[Uncaptioned image]](/html/1907.03854/assets/x62.png)
![[Uncaptioned image]](/html/1907.03854/assets/x63.png) \contcaption
\contcaption
continued
| First component | Second component | Third component | |||||||||
| Source name | Position | FWHM | Peak | Position | FWHM | Peak | Position | FWHM | Peak | ||
| (km s-1) | (km s-1) | mK | (km s-1) | (km s-1) | mK | (km s-1) | (km s-1) | mK | |||
| NGC 0034 | |||||||||||
| Arp 256N | |||||||||||
| Arp 256S | |||||||||||
| IC 1623 | |||||||||||
| MCG -03-04-014 | |||||||||||
| IRAS F01364-1042 | |||||||||||
| IC 0214 | |||||||||||
| UGC 01845 | |||||||||||
| NGC 0958 | |||||||||||
| ESO 550-IG025 | |||||||||||
| UGC 03094 | |||||||||||
| NGC 1797 | |||||||||||
| IRAS F05189-2524 | |||||||||||
| IRAS F05187-1017 | |||||||||||
| IRAS F06076-2139 | |||||||||||
| NGC 2341 | |||||||||||
| NGC 2342 | |||||||||||
| IRAS 07251-0248 | |||||||||||
| IRAS F09111-1007 W | |||||||||||
| IRAS F09111-1007 E | |||||||||||
| UGC 05101 | |||||||||||
| 2MASX J11210825-0259399 | |||||||||||
| CGCG 011-076 | |||||||||||
| IRAS F12224-0624 | |||||||||||
| CGCG 043-099 | |||||||||||
| ESO 507-G070 | |||||||||||
| NGC 5104 | |||||||||||
| IC 4280 | |||||||||||
| NGC 5258 | |||||||||||
| UGC 08739 | |||||||||||
| NGC 5331 | |||||||||||
| CGCG 247-020 | |||||||||||
| IRAS F14348-1447 | |||||||||||
| CGCG 049-057 | |||||||||||
| NGC 5936 | |||||||||||
| IRAS F16164-0746 | |||||||||||
| CGCG 052-037 | |||||||||||
| IRAS F16399-0937 | |||||||||||
| NGC 6285 | |||||||||||
| NGC 6286 | |||||||||||
| IRAS F17138-1017 | |||||||||||
| UGC 11041 | |||||||||||
| CGCG 141-034 | |||||||||||
| IRAS 18090+0130 | |||||||||||
| NGC 6701 | |||||||||||
| NGC 6786 | |||||||||||
| UGC 11415 | |||||||||||
| ESO 593-IG008 | |||||||||||
| NGC 6907 | |||||||||||
| IRAS 21101+5810 | |||||||||||
| ESO 602-G025 | |||||||||||
| UGC 12150 | |||||||||||
| IRAS F22491-1808 | |||||||||||
| CGCG 453-062 | |||||||||||
| 2MASX J23181352+0633267 | |||||||||||
Appendix B Modified blackbody model SED fitting
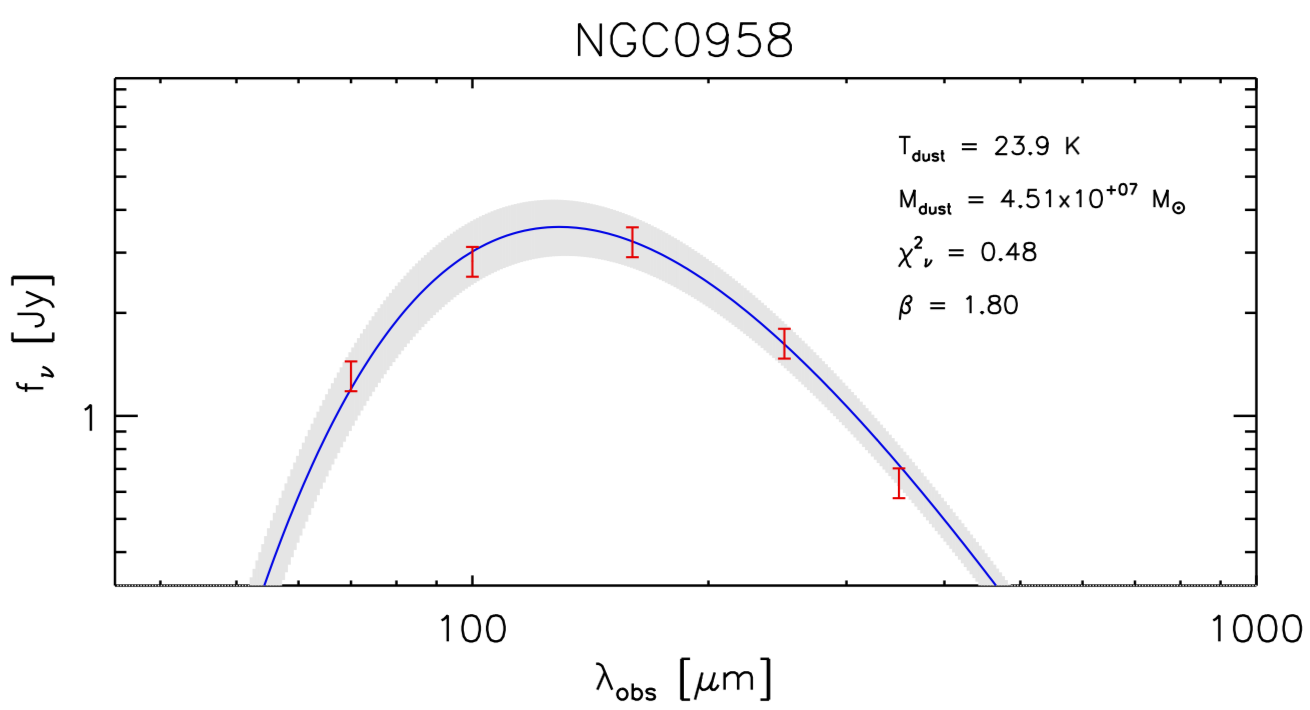
Assuming that all dust grains have the same size and and composition, their emission can be modeled by an optically thin modified blackbody,
| (11) |
where is the flux density, is the emissivity, is the blackbody intensity, and are the number of identical dust particles and their cross section, respectively, and is the distance to the dust cloud.
We have used Herschel data from both PACS (70, 100, and 170 m) and SPIRE (250 and 350 m, excluding 500 m for having a too coarse resolution) to construct the SED of each source. To do so, we smoothed the images to the FWHM of the IRAM-30 m observations, except for the 350 m images, which already have an angular resolution comparable with the IRAM-30 m beam. We then used a minimization method to obtain the best model. The emissivity index (where ) was fixed to a value of , to avoid degeneracies between and in minimization fits (Blain et al. 2003).
We can rewrite Eq. 11 in terms of the dust mass, , as
| (12) |
where is the so-called grain absorption cross section per unit mass or mass absorption coefficient. This parameter is highly uncertain (see, e.g., Draine & Lee 1984; Davies et al. 2012; Bianchi 2013). For our model we have adopted an intermediate value of . Complementary to the dust masses and temperatures, we have derived from direct integration below the fitted curve between 42.5 and 122.5 m. Figure 10 shows an example for the fit in the galaxy NGC 0958.