CHANG-ES XVI: An in-depth view of the cosmic-ray transport in the edge-on spiral galaxies NGC 891 and NGC 4565††thanks: Based on observations with the 100-m telescope of the Max-Planck-Institut für Radioastronomie (MPIfR) at Effelsberg and the Karl G. Jansky Very Large Array (VLA) operated by the NRAO. The NRAO is a facility of the National Science Foundation operated under agreement by Associated Universities, Inc.
Abstract
Context. Cosmic-ray electrons (CREs) originating from the star-forming discs of spiral galaxies frequently form extended radio haloes that are best observable in edge-on galaxies, where their properties can be directly investigated as a function of vertical height above the disc.
Aims. For the present study, we selected two nearby edge-on galaxies from the Continuum Halos in Nearby Galaxies – an EVLA Survey (CHANG-ES), NGC 891 and 4565, which differ largely in their detectable halo extent and their star-formation rates (SFRs). Our aim is to figure out how such differences are related to the (advective and/or diffusive) CRE transport in the disc and in the halo.
Methods. We use wide-band 1.5 and 6 GHz Very Large Array (VLA) observations obtained in the B, C, and D configurations, and combine the 6 GHz images with Effelsberg observations to correct for missing short spacings. After subtraction of the thermal emission, we investigate the spatially resolved synchrotron spectral index distribution in terms of CRE spectral ageing. We further compute total magnetic field strengths assuming equipartition between the cosmic-ray (CR) energy density and the magnetic field, and measure synchrotron scale heights at both frequencies. Based on the fitted vertical profiles of the synchrotron intensity and on the spectral index profile between 1.5 and 6 GHz, we create purely advective and purely diffusive CRE transport models by numerically solving the 1D diffusion–loss equation. In particular, we investigate for the first time the radial dependence of synchrotron and magnetic field scale heights, advection speeds, and diffusion coefficients, whereas previous studies of these two galaxies only determined global values of these quantities.
Results. We find that the overall spectral index distribution of NGC 891 is mostly consistent with continuous CRE injection. In NGC 4565, many of the local synchrotron spectra (even in the disc) feature a break between 1.5 and 6 GHz and are thus more in line with discrete-epoch CRE injection (Jaffe-Perola (JP) or Kardashev-Pacholczyk (KP) models). This implies that CRE injection time-scales are lower than the synchrotron cooling time-scales. The synchrotron scale height of NGC 891 increases with radius, indicating that synchrotron losses are significant. NGC 891 is probably dominated by advective CRE transport at a velocity of . In contrast, NGC 4565 is diffusion-dominated up to kpc or higher, with a diffusion coefficient of .
Conclusions.
1 Introduction
Over the past four decades, evidence has accumulated that the majority of star-forming spiral galaxies show haloes emitting radio continuum, which often extend up to several kpc from the disc in vertical direction. Recently, a study of 35 edge-on galaxies in the framework of Continuum Halos in Nearby Galaxies – an EVLA Survey (CHANG-ES, Irwin et al. 2012) showed that spiral galaxies without significant extraplanar radio emission are, if anything, a rare exception (Wiegert et al. 2015). Still, the brightness and vertical extent of radio haloes vary considerably between individual galaxies.
Radio continuum emission in haloes is primarily synchrotron radiation of cosmic-ray electrons (and hence a tracer of extraplanar magnetic fields), which have been accelerated to relativistic energies in shock fronts of supernova (SN) remnants in the disc. That galactic haloes are closely related to star-forming activity in the underlying disc was first indicated by the discovery of an extraplanar diffuse ionised gas component in several star-forming galaxies (Rand et al. 1990; Dettmar 1992; Dahlem et al. 1994, 1995; Rossa & Dettmar 2003a, b). Since then, disc–halo interactions have largely been investigated by considering models describing the blowout of SN-generated superbubbles in the interstellar medium (ISM) (Mac Low & Ferrara 1999), galactic chimneys (Norman & Ikeuchi 1989), and galactic fountains, in which the blown-out material eventually condenses and falls back to the disc (Shapiro & Field 1976). For radio-continuum emission in particular, the connection to star formation is evident from the far-infrared (FIR)–radio correlation (Murphy et al. 2006, 2008; Li et al. 2016), as SN progenitors (i.e. massive stars) are also prominent sources of dust heating.
In spite of substantial evidence for a disc–halo connection via star formation, the vertical scale height of a radio continuum halo is not directly linked to star-forming activity (Dumke & Krause 1998; Krause 2009, 2011; Krause et al. 2018). On the other hand, Krause et al. (2018) found for a CHANG-ES sub-sample of 13 galaxies that the halo scale height increases linearly with the diameter of the radio disc. The average scale heights they obtained are kpc at 1.5 GHz and kpc at 6 GHz. The total magnetic field strength is usually highest in the central regions of galaxies, implying higher synchrotron loss rates of cosmic-ray electrons (CREs) at small galactocentric radii. A common consequence of this are dumbbell-shaped radio haloes, a prime example of which is that of NGC 253 (Heesen et al. 2009).
Since the cosmic rays (CRs) are bound to the magnetic field lines and are coupled via the so-called streaming instability to the ionised gas (Kulsrud & Pearce 1969), in disc–halo outflows all three components are to a certain degree transported together by advection. In addition, diffusion of CRs is possible along or across magnetic field lines (e.g. Buffie et al. 2013). The brightness and shape of radio continuum haloes is influenced considerably by the relative amounts of advective and diffusive vertical cosmic-ray electron (CRE) transport. In advection-dominated galaxies, outflow speeds are typically of the order of several hundred (Heesen et al. 2018). If the advection speed exceeds the escape velocity of the galaxy, the outflowing gas leaves the gravitational potential of the galactic disc as a galactic wind (along with the CRs), rather than circulating in a galactic fountain flow.
The idea that CRs could in fact be the driving force in galactic winds was initially brought up by Ipavich (1975). Hanasz et al. (2013) demonstrated that an energy deposit of from type II supernovae into the ISM as cosmic rays can trigger the local formation of a strong low-density galactic wind driving and maintaining vertically open magnetic field lines at least in star-forming high-redshift galaxies. Analytical models (e.g. Breitschwerdt et al. 1991; Zirakashvili et al. 1996; Socrates et al. 2008; Dorfi & Breitschwerdt 2012; Jacob et al. 2018) and numerous (magneto-) hydrodynamic simulations (e.g. Jubelgas et al. 2008; Uhlig et al. 2012; Hanasz et al. 2013; Girichidis et al. 2016; Pakmor et al. 2016; Pfrommer et al. 2017; Jacob et al. 2018) of galactic outflows indicate that the formation of a CR-driven wind is possible in star-forming galaxies under a variety of physical conditions in the disc. A CR-driven wind seems to be more effective than a thermal wind, at least at larger distances from the disc (Girichidis et al. 2018; Jacob et al. 2018). Owing to the coupling between the CREs and the ionised gas, such a wind is expected to remove considerable amounts of mass, energy, and angular momentum (Ptuskin et al. 1997; Jacob et al. 2018) and can thus significantly influence galactic evolution, for example in terms of altered metallicity gradients and star-formation rates (SFRs). Galactic winds are furthermore being debated as a possible mechanism of magnetisation of the intergalactic medium (Kronberg et al. 1999; Hanasz et al. 2013; Farber et al. 2018). Evidence of how far magnetic fields in galaxy haloes extend into the intergalactic medium is, however, observationally limited by the energy losses of CREs.
A detailed investigation of CRE transport in galaxy haloes requires multi-frequency observations of edge-on galaxies with high spatial resolution. The nearby galaxies NGC 891 and NGC 4565 are ideal targets for this purpose. In this paper, we discuss CHANG-ES observations of NGC 891 and 4565 at 1.5 and 6 GHz.
Our paper is structured as follows: The galaxies are introduced in Sect. 2. In Sect. 3 we describe the observational setup and the basic data reduction procedure. We present and discuss the morphologies in the total intensity images in Sect. 4, while in Sect. 5 we provide an estimate for the spatial distribution of thermal free–free emission. Sect. 6 deals with the spatially resolved total and non-thermal spectral index distribution. In Sect. 7 we determine the vertical radio scale heights at 1.5 and 6 GHz and their radial distributions, and model the vertical emission distribution by solving the diffusion–loss equation in Sect. 8. We discuss the implications of our results in Sect. 9, followed by a summary and outlook in Sect. 10.
| NGC 891 | Ref. | NGC 4565 | Ref. | |
|---|---|---|---|---|
| RA (J2000) | 02h 22m 33s.41 | (1) | 12h 36m 20s.78 | (1) |
| DEC (J2000) | +42°20′ 56′′.9 | (1) | +25°59′ 15′′.6 | (1) |
| [Mpc] | 9.1 | (2) | 11.9 | (2) |
| Morph. type | SBb | (3) | SB(r)b | (4) |
| Inclination [] | 89.8 | (5) | 86.3 | (6) |
| Position angle [] | 23.25 | (5) | 44.5 | (6) |
| [′] | 12.2 | (1) | 16.2 | (1) |
| SFR [] | 3.3 / 1.55 | (7)/(8) | 1.3 / 0.74 | (7)/(8) |
| [] | 3.13 | (8) | 0.73 | (8) |
| [] | 225 | (9) | 245 | (10) |
| Total atomic gas massb [] | 5.6 | (11) | 9.9 | (12) |
a Observed blue diameter at the 25th mag arcsec-2 isophote.
b Includes multiplication by a factor of 1.36 to account for neutral He.
References: (1) Irwin et al. (2012), (2) Radburn-Smith et al. (2011), (3) Garcia-Burillo & Guelin (1995), (4) Kormendy & Barentine (2010), (5) Kregel & van der Kruit (2005), (6) this work, (7) Krause (2011), (8) Wiegert et al. (2015), (9) Swaters et al. (1997), (10) Heald et al. (2011), (11) Oosterloo et al. (2007), (12) Zschaechner et al. (2012)
2 The galaxies
2.1 NGC 891
NGC 891 has been repeatedly dubbed as a twin of the Milky Way, due to its similar optical luminosity (van der Kruit & Searle 1981) and rotation velocity (, Rupen 1991; Swaters et al. 1997). Depending on methodology, the SFR is found to lie within values of (Wiegert et al. 2015) and (Krause 2011). NGC 891 contains approximately twice the amount of CO gas as in the Milky Way (Scoville et al. 1993), therefore it is very likely to have a higher SFR than our Galaxy. Owing to its similarities to our Galaxy, its almost perfectly edge-on inclination, and its easily detectable extraplanar emission in various wavelength regimes, NGC 891 is a preferred target for investigations of halo properties and the disc–halo connection, and arguably the most extensively studied edge-on galaxy to date. Basic physical parameters of NGC 891 are listed in Table 1.
Early observations of NGC 891 at 610 MHz, 1.4 GHz, and 5 GHz with the Westerbork Synthesis Radio Telescope (WSRT) by Allen et al. (1978) allowed for the first time to separate the radio continuum emission of a galaxy into a thin disc (or just ‘disc’) and a thick disc (or halo) component. On the other hand, the vertical spectral index profiles turned out too steep to be explained by basic CRE transport models (Strong 1978). Observations with the Effelsberg 100-m telescope at 8.7 GHz (Beck et al. 1979) and at 10.7 GHz (Klein et al. 1984) showed that a lack of large-scale structure in the 5 GHz map of Allen et al. (1978) due to missing short-spacings was responsible for this inconsistency. Later, Hummel et al. (1991b) observed NGC 891 at 327 and 610 MHz with the WSRT and at 1.49 GHz with the Karl G. Jansky Very Large Array (VLA). The observed vertical extent of the halo at each frequency and the resulting spectral index profiles showed first indications of consistency with the theoretical models for disc–halo advection flows by Lerche & Schlickeiser (1982). Dumke & Krause (1998) for the first time combined interferometric (VLA) and single-dish (Effelsberg) data of NGC 891 (at 4.85 GHz) and measured average exponential scale heights of 0.27 kpc for the disc and 1.82 kpc for the halo.
Recently, NGC 891 was observed with the Low Frequency Array (LOFAR) at 146 MHz (Mulcahy et al. 2018) and is hence the first edge-on galaxy investigated with LOFAR. The scale height of the non-thermal halo emission at 146 MHz varies between 1.6 and 3.6 kpc, increasing with decreasing magnetic field strengths, which is a signature of dominating synchrotron losses of CREs. Comparison with the CHANG-ES data at 1.5 GHz gave discrepant results whether CRE propagation in the halo is diffusive or advective.
The geometry of the magnetic field is known to be plane-parallel in the disc (Sukumar & Allen 1991; Dumke et al. 1995), while in the halo it is X-shaped (Krause 2009, 2011). Using a depolarisation model, Hummel et al. (1991a) estimated an average magnetic field scale height of 3.6 kpc for the halo. Substantial extraplanar emission has further been detected from neutral hydrogen (H i) (Oosterloo et al. 2007), diffuse ionised gas (e.g. Dettmar & Schulz 1992; Rand 1998), dust (e.g. Hughes et al. 2014), polycyclic aromatic hydrocarbons (PAHs) (Whaley et al. 2009), and X-ray emitting hot ionised gas (e.g. Li & Wang 2013b).
| Frequencya | 1.5 GHz (L-band) | 6 GHz (C-band) | |||||
|---|---|---|---|---|---|---|---|
| Configuration | B | C | D | B+C+D | C | D | C+D |
| Obs. date | 2012/06/24 | 2012/02/11 | 2011/12/16 | N/A | 2012/02/06–07 | 2011/12/09 | N/A |
| 2012/04/01 | 2013/03/17 | 2011/12/18 | |||||
| Obs. timeb | 121 min | 47 min | 30 min | N/A | 368 min | 79 min | N/A |
| Primary calibrator | 3C 48 | 3C 48 | 3C 48 | N/A | 3C 48 | 3C 48 | N/A |
| Secondary calibrator | J0230+4032 | J0314+4314 | J0314+4314 | N/A | J0251+4315 | J0230+4032 | N/A |
| []c | 3.16 | 10.64 / 12.00 | 36.42 | 4.09 / 12.00 | 2.77 | 9.00 / 12.00 | 3.88 |
| []c | 2.90 | 9.66 / 12.00 | 32.48 | 3.73 / 12.00 | 2.61 | 8.81 / 12.00 | 3.50 |
| Beam position angle [] | 54.22 | 88.06 | 50.65 | 85.93 | 80.49 | ||
| Pixel size [] | 0.5 | 2.5 | 5 | 0.5 | 0.5 | 2.5 | 0.5 |
| Scales for MS-CLEAN [] | 0, 6, 15 | 0, 10, 20, 40 | 0, 20, 100, 200 | 0, 6, 15, | 0, 6, 14 | 0, 10, 20, 40 | 0, 6, 15 |
| 50, 100, 200 | |||||||
| Self-calibration | 1x phase | no | no | N/Ad | 1x amp+phase | 1x amp+phase | N/Ad |
| Outer -taper [k] | 30 | 34 | |||||
| Noise rms [Jy beam-1] | 16 | 28 | 60 | 14.5 / 24e | 3.1 | 6.5 / 5.9e | 2.7 |
a The central frequency of the respective band is given. The total bandwidth is 512 MHz for L-band and 2.048 GHz for C-band.
b On-source time (before flagging)
c Major- and minor-axis FWHM of the synthesised beam (the intermediate-resolution maps were smoothed to FWHM after deconvolution).
d N/A in this case means that the specified self-calibrations were already applied to the single-array data sets before producing the combined-array images.
e Noise rms before and after smoothing the map to FWHM
| Frequencya | 1.5 GHz (L-band) | 6 GHz (C-band) | |||||
|---|---|---|---|---|---|---|---|
| Configuration | B | C | D | B+C+D | C | D | C+D |
| Obs. date | 2012/06/02–03 | 2012/04/02 | 2011/12/30 | N/A | 2012/04/16 | 2011/12/29 | N/A |
| Obs. timeb | 125 min | 43 min | 19 min | N/A | 356 min | 76 min | N/A |
| Primary calibrator | 3C 286 | 3C 286 | 3C 286 | N/A | 3C 286 | 3C 286 | N/A |
| Secondary calibrator | J1221+2813 | J1221+2813 | J1221+2813 | N/A | J1221+2813 | J1221+2813 | N/A |
| []c | 3.31 | 10.49 / 12.00 | 34.50 | 10.16 / 12.00 | 2.63 | 9.02 / 12.00 | 3.57 |
| []c | 3.01 | 10.01 / 12.00 | 32.32 | 9.40 / 12.00 | 2.59 | 8.82 / 12.00 | 3.52 |
| Beam position angle [] | 45.50 | 64.64 | 47.75 | 85.48 | |||
| Pixel size [] | 0.5 | 2.5 | 5 | 0.5 | 0.5 | 2.5 | 0.5 |
| Scales for MS-CLEAN [] | 0, 6, 15 | 0, 10, 20 | 0, 35, 80 | 0, 6, 15, | 0, 5, 13 | 0, 10, 40 | 0, 5, 13 |
| 35, 70, 105 | |||||||
| Self-calibration | no | 1x amp+phase | 1x phase | N/Ad | 1x phase | no | N/Ad |
| Outer -taper [k] | 50 | 34 | |||||
| Noise rms [Jy beam-1] | 14 | 20.5 | 34 | 20 | 3.2 | 7.4 / 7.0e | 2.5 |
a The central frequency of the respective band is given. The total bandwidth is 512 MHz for L-band and 2.048 GHz for C-band.
b On-source time (before flagging)
c Major- and minor-axis FWHM of the synthesised beam (the intermediate-resolution maps were smoothed to FWHM after deconvolution).
d N/A in this case means that the specified self-calibrations were already applied to the single-array data sets before producing the combined-array images.
e Noise rms before and after smoothing the map to FWHM
2.2 NGC 4565
Compared with NGC 891, NGC 4565 has a distinctly lower SFR (, Krause 2011; or even as low as , Wiegert et al. 2015) and, at , is somewhat less inclined. Further basic properties of the galaxy are given in Table 1.
The first radio continuum detection of NGC 4565 (WSRT at 610 MHz and 1.4 GHz, Hummel et al. 1984), indicated the presence of a thick radio disc, with follow-up observations (Broeils & Sancisi 1985) allowing for a tentative detection of a thin disc. From combined VLA and Effelsberg data at 4.85 GHz, Dumke & Krause (1998) determined average exponential scale heights of 0.28 kpc for the thin disc and 1.68 kpc for the thick disc or halo, which is similar to what they measured for NGC 891, in spite of the considerably smaller minor to major axis ratio (not only at radio wavelengths) of NGC 4565.
NGC 4565 does not have a particularly massive or extended H i halo (Zschaechner et al. 2012), suggesting that there is no significantly strong disc–halo interaction. H imaging by Rand et al. (1992) showed that the H ii content of the galaxy is basically limited to the compact star-forming regions in the disc plane and hence does not include any notable extraplanar diffuse ionised gas component. This appears to be consistent with its low SFR and its low extraplanar H i content.
3 Observations and data reduction
3.1 VLA
The CHANG-ES observations were carried out with the VLA, using the L-band (1.5 GHz) and C-band (6 GHz) receivers, with bandwidths of 512 MHz and 2.048 GHz, respectively. In order to probe a variety of spatial scales, the B-, C-, and D-array configurations were used at 1.5 GHz, and the C- and D-array configurations at 6 GHz. The FWHM of the VLA primary beam is at 1.5 GHz and at 6 GHz. Therefore, the C-band observations of all CHANG-ES galaxies with (which includes both NGC 891 and 4565) were performed with two pointings, which were placed on the major axis on either side of the galaxy centre, separated by . Observational parameters specific to each array configuration and frequency band are given in Tables 2 and 3.
We carried out most of the basic data reduction as described comprehensively in Irwin et al. (2013) and Wiegert et al. (2015), using the Common Astronomy Software Applications (CASA) package (McMullin et al. 2007). After applying standard procedures for RFI excision and calibration, we imaged the data in total intensity (Stokes ) with the multi-scale multi-frequency synthesis algorithm (MS–MFS CLEAN, Rau & Cornwell 2011) in wide-field mode (Cornwell et al. 2008). For MFS we used two Taylor terms, to take account of the spectral behaviour and produce maps of the spectral index (we will refer to these as in-band spectral index maps throughout this paper). Briggs robust-0 weighting (Briggs 1995), which results in a good compromise between angular resolution and sensitivity, was applied to the visibility data before imaging. Self-calibration was done in those cases where it improved the image quality (see Tables 2 and 3).
All maps were corrected for primary-beam (PB) attenuation, including a correction of the maps for the frequency dependence of the PB. As we discuss in Sect. 6.1.2, the NRAO-supplied PB model at 6.0 GHz turned out to be unsuitable for the correction of our C-band D-array maps. Here, we could achieve more accurate results by using PB models at 6.25–6.6 GHz instead.
In addition to imaging each array configuration separately, images were also produced from a combination of the (B-), C- and D-array data for each frequency band. Tables 2 and 3 contain a summary of the imaging parameters for each data set. To obtain images at a common angular resolution at both frequencies, we produced C-band D-array, L-band C-array, and L-band B+C+D-array total intensity and spectral index maps with a beam full-width at half-maximum (FWHM) of .
| NGC 891 | NGC 4565a | |
| L-band B-array | ||
| L-band C-array | ||
| L-band B+C+D-array | ||
| L-band B+C+D-array merged with D-array | ||
| L-band D-array | ||
| Thermal (1.5 GHz) | ||
| Non-thermalb (1.5 GHz) | ||
| C-band C-array | ||
| C-band C+D-array | ||
| C-band D-array | ||
| C-band D-array merged with 6 GHz Effelsberg | ||
| C-band C+D-array merged with 6 GHz Effelsberg | ||
| 6 GHz Effelsberg | ||
| Thermal (6 GHz) | ||
| Non-thermalb (6 GHz) |
a Flux densities of NGC 4565 were determined after subtracting the central source of the galaxy from the VLA images.
b For each galaxy, to obtain the non-thermal map at 1.5 GHz, the thermal map was subtracted from the combination of the L-band D-array and B+C+D-array maps. At 6 GHz, the thermal map was subtracted from the combination of the C-band D-array and Effelsberg maps.
3.2 Effelsberg
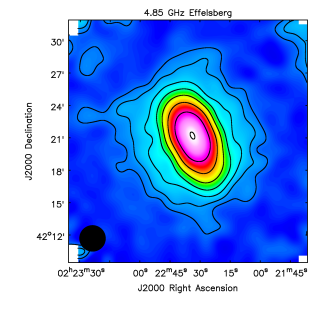
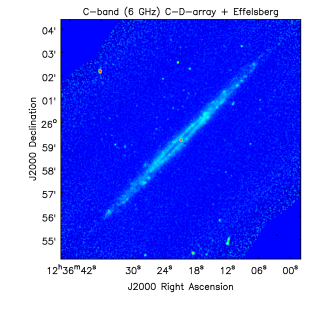
To fill in missing short spacings111The largest angular size scale detectable by the VLA (D-array) is at 1.5 GHz and at 6 GHz. at 6 GHz, we used observations with the Effelsberg 100-m telescope at 4.85 and 8.35 GHz. The 4.85 GHz map of NGC 4565 was already published by Dumke (1997), the 8.35 GHz map of NGC 891 by Krause (2009). The observations of NGC 4565 at 8.35 GHz and of NGC 891 at 4.85 GHz are published here for the first time, and are shown in Fig. 1.
NGC 891 was observed in 2014 at 4.85 GHz using the dual-beam receiver. We took 21 coverages, with a final map size of . The 8.35 GHz observations of NGC 4565 were performed in 2003 with 31 coverages and a total scanned area of , orientated along the major axis of the galaxy. In both cases, the data reduction was performed with the NOD3 software package (Müller et al. 2017). Flux calibration was done based on 3C 286 and the flux density scale of Baars et al. (1977).
3.3 Short-spacing corrections
Using the Effelsberg observations, a map of the spectral index between 4.85 and 8.35 GHz was computed for each galaxy (after smoothing the 8.35 GHz map to the resolution at 4.85 GHz, i.e. ). Based on this spectral index map, we rescaled the 4.85 GHz map to 6 GHz, and combined the rescaled map with the VLA C-band D-array map.
No single-dish observations at (or near) 1.5 GHz with sufficient sensitivity are presently available for either galaxy. On the other hand, we expect that the D-array data are not too severely affected by missing short spacings, since the largest angular scale (LAS) we can recover is , which is not exceeded by our galaxies. However, at higher resolutions (even when combining B- and/or C-array with D-array data), it turned out impossible to achieve the same integrated flux density as in the D-array maps, even if large MS-CLEAN scales are used (see Table 4). At 1.5 GHz therefore, we used the D-array maps to at least partly correct for missing short-spacings in the combined B+C+D-array maps. We keep in mind that the missing spacings problem is possibly still present to some degree in these maps, and will discuss its possible effects on our science results where appropriate.
The short-spacing corrections at both 1.5 and 6 GHz were performed in the image domain, using the ImMerge task in NOD3. This program convolves the interferometric image with the beam of the single-dish observation and subtracts this convolved map from the single-dish map. The resulting difference map, which is essentially a map of the large-scale emission missing from the interferometric observation, is normalised to the interferometric resolution by multiplication with the ratio of the solid angles of the two observing beams . The normalised difference map is then added to the interferometric map to yield the short-spacing corrected image.
 a)
a) 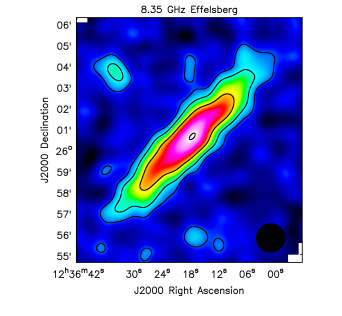 b)
b)
 a)
a) 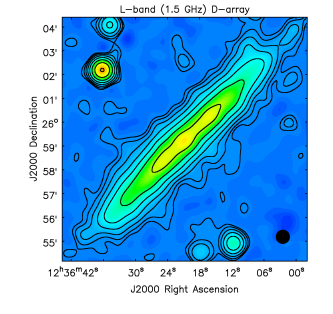 b)
b)
3.4 Ancillary data
To estimate the contribution of thermal radio continuum emission (Sect. 5), we use H images taken at the Kitt Peak National Observatory (KPNO, see Heald et al. 2011). We prepared the maps by first removing foreground stars, interpolating the surrounding intensities across the removed areas. The maps were smoothed to a resolution of FWHM and clipped below the level, with defined as the average noise rms in emission-free regions of the map.
To allow correction of the H maps for internal extinction, we make use of Spitzer Multiband Imaging Photometer (MIPS) images at 24 . We smoothed these maps, which have a FWHM point-spread function (PSF), to a Gaussian beam of FWHM, using the appropriate convolution kernel provided by Aniano et al. (2011). According to these authors, the application of this kernel lies between a ‘moderate’ and a ‘very safe’ convolution, meaning that not too much energy is moved from the wings of the original PSF into the Gaussian core, which would possibly amplify any potential image artefacts. The smoothed images were clipped at in case of NGC 891 and at in case of NGC 4565.
4 Morphology of the total radio continuum emission
4.1 NGC 891
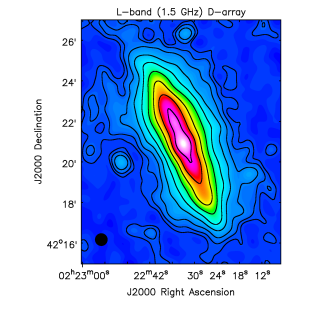
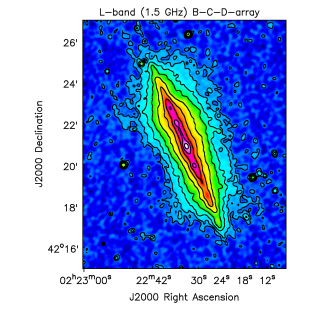
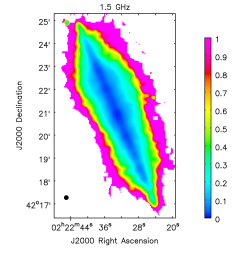
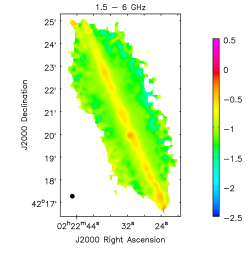
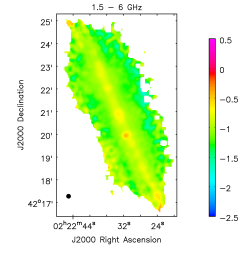
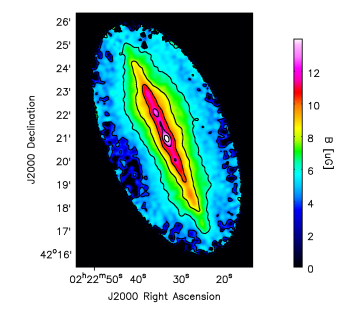
Figure 2 a shows the total intensity distribution of NGC 891 at our lowest resolution VLA map (1.5 GHz, D-configuration), while short-spacing corrected 1.5 and 6 GHz maps at intermediate and high angular resolution are displayed in Fig. 3. The large extent of the radio halo emission of NGC 891 is best visible in the Effelsberg single-dish observations at 4.85 GHz in Figure 1 a and in L-band D-array. While the inner radio emission in all images roughly follows the asymmetric distribution observed in H (cf. Dahlem et al. 1994), it becomes more peanut- or dumbbell-shaped towards larger heights in the L-band D-array map. A more quantitative description of the shape of the halo will be provided in Sect. 7.
The integrated flux density for each map is given in Table 4. In L-band D-array, the flux density is in close agreement with the value found by Hummel et al. (1991b). As single-dish-based flux density measurements of NGC 891 of sufficient sensitivity at this frequency range do not exist in the literature (e.g. White & Becker (1992) measured only 658 mJy at 1.4 GHz), the true total flux density of the galaxy in this frequency range remains uncertain.
 a)
a) 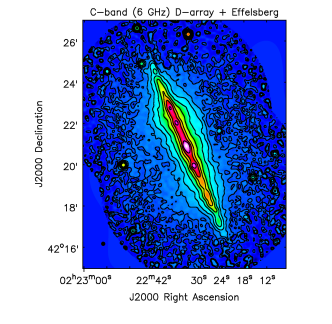 b)
b)
4.2 NGC 4565
 a)
a) 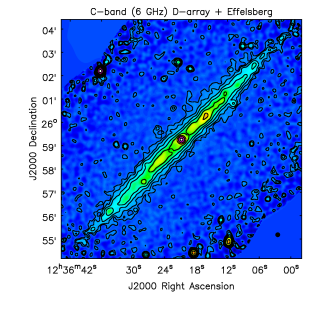 b)
b)
 c)
c) 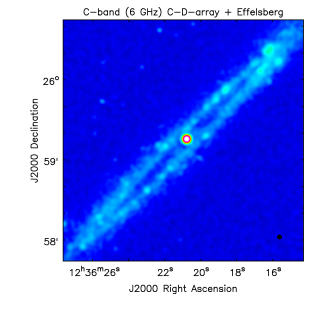 d)
d)
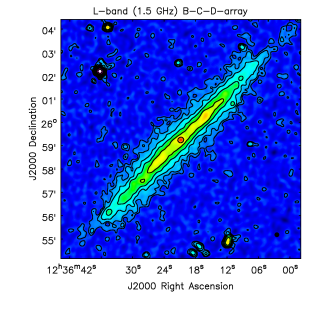
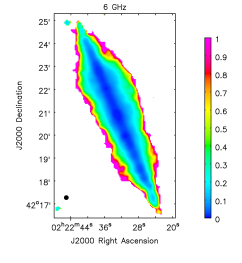
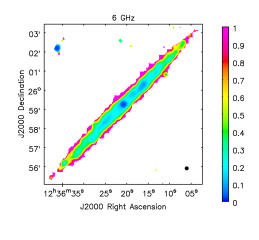
The L-band D-array total intensity map of NGC 4565 is displayed in Fig. 2 b, and short-spacing corrected images are shown in Fig. 4. In each image, the ratio of vertical to radial extent of the radio emission is much lower than for NGC 891, and has not significantly increased compared with earlier observations. Moreover, even after applying the short-spacing correction at 6 GHz (Figs. 4 b–d), practically all of the added large-scale emission still falls below the level. Hence, at least in the high-resolution maps, only emission from the disc of the galaxy is detected.
The combination of an earlier VLA observation with the Effelsberg map at 4.85 GHz (Dumke 1997), which had been obtained using the Astronomical Image Processing System222http://www.aips.nrao.edu/index.shtml (AIPS) task IMERG, shows dumbbell-like vertical extensions of the otherwise narrow halo component, most prominently on the south-eastern side of the galaxy. No such feature is visible in any of the images presented here. Errors in any of the merging procedures cannot be ruled out. However, after testing different merging routines on both NGC 891 and 4565 (Schmidt 2016), we found that IMERG is more likely to produce filamentary, often dumbbell-shaped, extraplanar features than the corresponding routines in CASA or NOD3.
In the lower-resolution maps (Figs. 1 b and 2 b) we detect an extended source 4′ south of the centre of NGC 4565. This source is bright in X-ray emission (see Fig. 4 Cv in Li & Wang 2013a) and hence is probably the radio relic of a background cluster.
 a)
a) 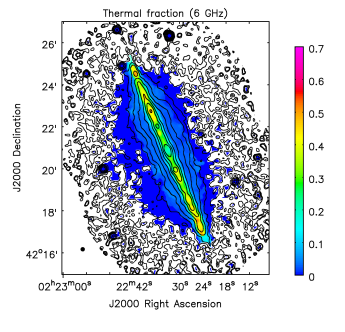 b)
b)
 c)
c) 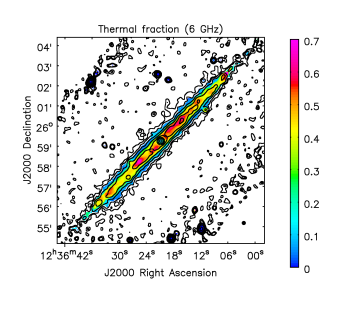 it d)
it d)
4.3 The radio ring of NGC 4565
NGC 4565 is known to have a prominent ring of dust emission with a radius of 5.5 kpc (Laine et al. 2010; Kormendy & Barentine 2010), coinciding with a ring of molecular gas (Sofue & Nakai 1994; Neininger et al. 1996; Yim et al. 2014). Our 6 GHz C-array observations (as included in Fig. 4 c and d) are the first to resolve this ring at radio frequencies. The observed axis ratio of the ring in radio continuum implies an inclination of for this galaxy.
We estimate the width and thickness of the ring based on the level of the (short-spacing corrected) combined-array C-band image. If is the total extent of the ring along the major axis, its observed minor axis extent is , where corresponds to its projected vertical thickness. With , , , and a distance of Mpc, one obtains a vertical thickness of . From the projected width of the near or far side of the ring along its minor axis, one can determine its width in the galactic plane: . The typical width of the contour (excluding the nuclear radio source) near the minor axis of the ring is found to be , which results in . However, we note that the results are highly sensitive to the assumed inclination. For our lower error limit in inclination, that is , we obtain and , while using the upper limit of implies and . Hence, in case the ring has a vertical thickness comparable to the thin disc scale height of the Milky Way (), it has to be relatively narrow for the near and far side to be clearly resolved from each other; otherwise they must be notably flatter than the disc of our Galaxy.
Near the centre of the ring, we also observe emission that is much fainter and slightly more extended than the bright nuclear point source. This emission is most likely related to the central bar, kinematical proof of which was found by Neininger et al. (1996) and Zschaechner et al. (2012), and which is oriented mainly along the line of sight (Kormendy & Barentine 2010). Since bars are usually connected to spiral arms or rings, the bar hence might be up to 11 kpc long (the diameter of the ring), in which case it would constitute a substantial part of the disc.
5 Thermal radio emission
We produced maps of the thermal radio continuum emission using the H and m-data mentioned in Sect. 3.4. For the dust ext inction correction of observed H emission, Calzetti et al. (2007) and Kennicutt et al. (2009) established linear relations (each based on a large sample of nearby galaxies) of the form
| (1) |
where and are the bolometric lumiosities of the observed and extinction-corrected H emission, respectively, and and are the frequency and monochromatic luminosity at 24 . Initially, we tried to correct for internal extinction adopting a 24 scaling coefficient of where (as found by Calzetti et al. 2007), and (Kennicutt et al. 2009) otherwise. We then followed Tabatabaei et al. (2007) to obtain the brightness temperature distribution of the thermal radio emission from the extinction-corrected H maps (assuming an electron temperature of K). Finally, we converted the brightness temperatures to intensities at and following (Pacholczyk 1970).
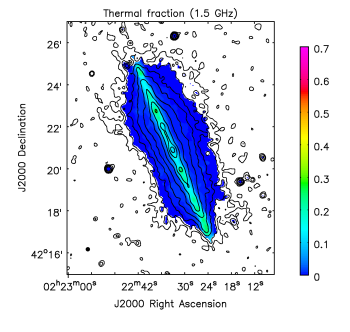
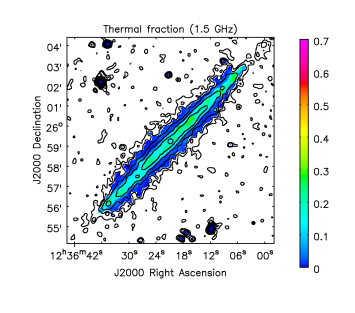
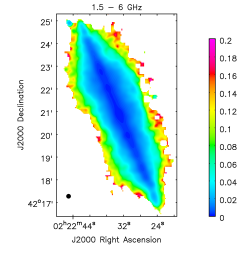
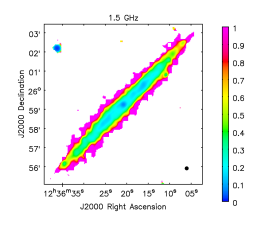
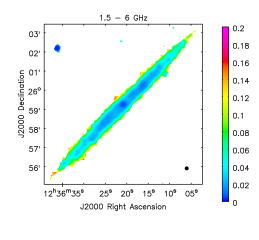
Applying the above scaling coefficients for the extinction correction turned out to severely underpredict the thermal emission in NGC 891, as the resulting non-thermal spectral indices along the disc plane (after creating non-thermal spectral index maps as described in Sect. 6) were still considerably flatter at 6 GHz () than at 1.5 GHz (). To obtain a more reasonable estimate for the thermal contribution, we modified the scaling factor for such that the global thermal fractions agree with those found by Dumke (1997) and, for NGC 4565, by Niklas et al. (1997). This was realised by the choice of for NGC 891 and for NGC 4565. We present the resulting thermal fraction maps at 1.5 and 6 GHz in Fig. 5. In NGC 891 we find maximum thermal fractions of 27% at 1.5 GHz and 49% at 6 GHz, while in NGC 4565 the maximum is 28% at 1.5 GHz and 65% at 6 GHz.
| NGC 891 | NGC 4565 | |
|---|---|---|
| [%] | ||
| [%] | ||
In Table 5 we present global values of the thermal fractions and of the total and non-thermal spectral index between the two observing frequencies ( and ). The error we adopted in each case for the thermal fraction and non-thermal spectral index corresponds to the difference to the value obtained using for the disc.
Meanwhile, Vargas et al. (2018) published a slightly different method to determine the thermal contribution, and derived a scaling coefficient of as a typical value for their sub-sample of CHANG-ES galaxies (including NGC 891). The thermal fractions they obtained for NGC 891 agree with our results within the errors.
6 Spectral index distribution
Before we can reliably interpret spectral index measurements from wide-band radio continuum data, a number of corrections and amendments during and after deconvolution need to be applied, which are not part of the standard imaging procedure described in Sect. 3.1. In the first part of this section, we outline each of the necessary correction methods and their specific application to our data. We afterwards investigate our final results for the non-thermal spectral index distribution for consistency with the standard spectral ageing models. In what follows, we restrict ourselves to the spectral index maps at intermediate resolution (), as the signal-to-noise ratio (S/N) of the high-resolution maps is insufficient to study extraplanar CRE propagation. Another reason is that the angular resolution of our far-infrared data is not matched to these high-resolution maps and we thus cannot correct for the thermal contribution.
6.1 Post-imaging corrections
6.1.1 Inner -cutoff
For wide-band interferometric observations of extended sources, the lowest spatial frequencies (up to the lower bound at the highest frequency ) are only covered by a fraction of the frequency band, such that at large spatial scales there is progressively more flux missing as one moves to higher frequencies (see Rau & Cornwell 2011). This artificially steepens the spectrum measured at these scales. To avoid this bias towards steeper in-band spectral indices, we performed additional imaging runs excluding data at spatial frequencies below at .333The fraction of visibility data lost in this way was less than in each case. Spatial frequency cutoffs at in L-band and at in C-band were thus applied for the in-band spectral index computation.
6.1.2 Revised primary-beam correction
In case of the C-band (D-array) observations, we found that the intensity and spectral index maps of the two separate pointings still showed major differences within their overlap region after primary-beam (PB) correction (cf. Wiegert et al. 2015). We were able to improve the matching between the pointings by using the PB model at 6.25 GHz (6.6 GHz in case of the spectral index map of NGC 891) instead of the centre frequency of 6.0 GHz.
6.1.3 Short-spacing corrections
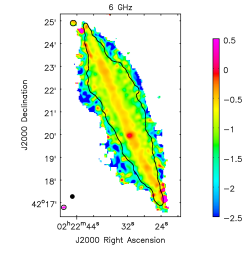
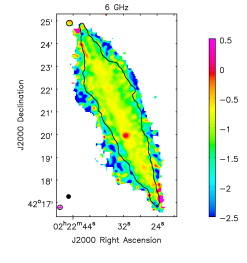
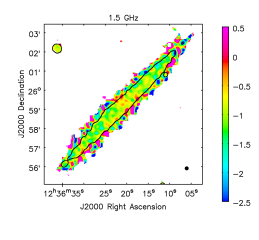
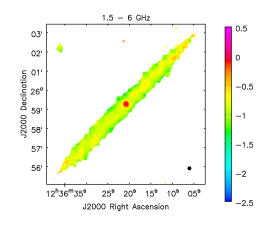
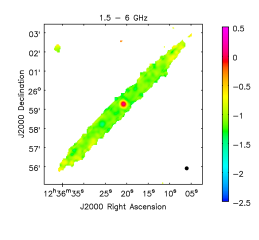
We computed ‘classical’ (i.e. two-point) spectral index maps between 1.5 and 6 GHz () from the short-spacing corrected 1.5 and 6 GHz total intensity maps, and accordingly between their non-thermal counterparts. These are shown in panels g and h of Figs. 6 and 7.
Also, we performed short-spacing corrections of the in-band maps obtained by MFS imaging. In L-band, we performed the merging of B+C+D-array with D-array-only data (as described in Sect. 3.3) for both Taylor-term images, to obtain short-spacing corrected maps of (Figs. 6–7 a). The corresponding maps (Figs. 6–7 b) were computed as
| (2) |
where is the short-spacing corrected second Taylor-term map, and are the thermal and short-spacing corrected non-thermal intensity maps, respectively, and .
As our Effelsberg data have a much narrower bandwidth than the VLA C-band observations, it is not possible to combine them during MFS imaging to produce short-spacing corrected in-band spectral index maps at 6 GHz. Instead, we used MFS to image the C-band data at the beginning (5 GHz) and end (7 GHz) of the frequency band (applying the -cutoff), and merged the resulting total intensity maps444That is, after PB correction. Following the approach outlined in Sect. 6.1.2, we used the PB models at 5.1 GHz and 7.5 GHz, which resulted in the best agreement between the two pointings in total intensity. with the Effelsberg maps scaled to 5 and 7 GHz, respectively555We note that this results in different sizes of the gap in the ‘-coverage’ at the two frequencies, since the re-scaled Effelsberg maps have the same angular resolution and hence different effective dish diameters.. From the short-spacing corrected 5 and 7 GHz maps, we computed two-point maps, which we adopt as the ‘in-band’ distribution (Figs. 6–7 d). The same was done for the non-thermal emission maps, after computing maps at 5 and 7 GHz (Figs. 6–7 e).
6.2 Spectral index maps
6.2.1 NGC 891
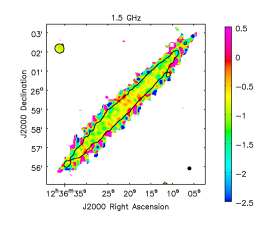
NGC 891 shows the overall pattern typically observed in edge-on galaxies, that is rather flat mid-plane spectral indices and (on average) steepening of the spectra with vertical height (Fig. 6, left column). The angular resolution is sufficient to observe a relatively sharp transition between flat and steep spectral indices in the disc–halo interface region. An outstanding feature in the and maps is the radio supernova SN 1986J (van Gorkom et al. 1986) at , (Bietenholz et al. 2010), with a spectral index at its centre of at 6 GHz and at 1.5 GHz. In the mid-plane region of NGC 891, is considerably flatter than , due to the larger thermal contribution at 6 GHz.
Around the edges, all in-band maps are dominated by either extremely steep, extremely flat, or even positive values, which are artefacts arising from instabilities of the spectral fit in regions of too low S/N. We were able to exclude these edge artefacts from our further analysis to a satisfactory extent by clipping the in-band maps at the level.
After our thorough error consideration (see also Schmidt 2016), the corrections described in Sect. 6.1.1 to Sect. 6.1.3, and the high clipping level applied to our data we conclude that the fluctuations seen in the in-band spectral index maps (Figs. 6 a, b, d, and e) are real. Around the mid-plane, turns out to be in close agreement at both frequencies, which indicates that we found a realistic estimate of the thermal contribution in the disc.
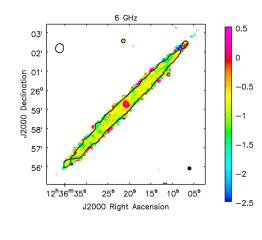
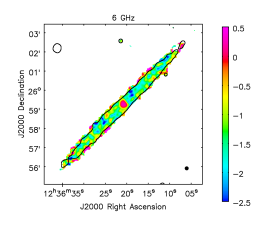
6.2.2 NGC 4565
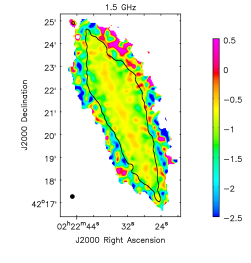
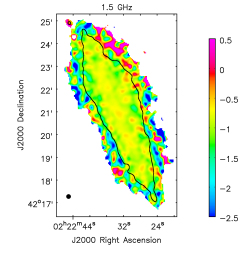
Contrary to NGC 891, where a relatively clear distinction between disc and halo is visible in the distribution, only a very small portion of the halo is covered by our maps of NGC 4565 (Fig. 7), because here low S/N values are reached already at much lower heights. While in the the disc still shows a relatively homogeneous distribution of values around (total emission) and (non-thermal), the in-band maps are characterised by stronger fluctuations on small scales, similar to the halo of NGC 891. Still, the ring-shaped structure seen in total intensity is also clearly identifiable in the map (and to a lesser degree in ), in the form of elongated flat-spectrum regions.
Overall, both total and non-thermal spectra in NGC 4565 are found to be steeper than in the disc of NGC 891. In particular, in NGC 4565 is considerably steeper than after subtracting the thermal contribution, whereas in the disc of NGC 891 we measure similar non-thermal spectral indices at both frequencies. Even the map shows values as steep as in the lower halo () over a large portion of the disc. These remarkable differences between the non-thermal spectra of the two galaxies appear to be a direct consequence of their very different SFR surface densities, as we will discuss further below.
NGC 891 (1.5 GHz)
NGC 891 (6 GHz)
NGC 4565 (1.5 GHz)
NGC 4565 (6 GHz)
7 Synchrotron scale heights
7.1 Fitting the vertical intensity profiles
We determined scale heights of the total and non-thermal (synchrotron) radio emission of NGC 891 and 4565 by least-squares fitting of vertical (-direction) intensity profiles (Dumke et al. 1995; Krause et al. 2018). As input data we used the short-spacing corrected 1.5 and 6 GHz images at FWHM resolution, from which we removed background sources close to the galaxies, as well as SN 1986J in NGC 891 and the central source of NGC 4565. The NOD3 task BoxModels (Müller et al. 2017) was used to fit profiles at different positions along the major axis of each galaxy. BoxModels computes the mean intensity within boxes of galactocentric radial width as projected onto the major-axis and vertical height interval . To take the inclination of the galaxies into account and thus obtain deprojected scale heights, an effective beam size is automatically determined at each specified major-axis position.
In both galaxies, we sampled the vertical intensity distribution in steps of , corresponding to 0.22 kpc at the distance of NGC 891 and 0.29 kpc in case of NGC 4565. To investigate the radial behaviour of scale heights for NGC 891, we used seven strips of width kpc, while for NGC 4565, due to its much lower S/N, we chose five strips with kpc. The emission of NGC 891 appears to be superimposed on a plateau of extended low-level emission. We consider this plateau to be an artefact that may have been caused by inaccuracies in interpolating the Effelsberg map from 4.85 to 6 GHz. We excluded it from our fitting because it would have otherwise systematically broadened our model profiles.
Describing the vertical emission distribution clearly requires two-component models (disc and halo) for NGC 891, while for NGC 4565 the situation is somewhat ambiguous, as we discuss below. As known from the studies of Dahlem et al. (1994) and Dumke & Krause (1998), we found the profiles of NGC 891 to be better represented by two-component exponentials than by two-component Gaussians. For NGC 4565, we found exponential and Gaussian models to provide similarly good fits. To enable the comparison of our scale heights to those of other edge-on galaxies, we adopt the results of the exponential fits for most of the subsequent analysis and discussion. However, we will also consider the Gaussian results for NGC 4565 in the CRE transport modelling (Sect. 8.2).
 a)
a) 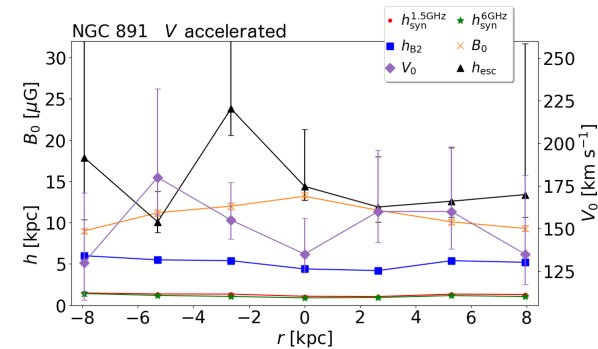 b)
b)
 c)
c) 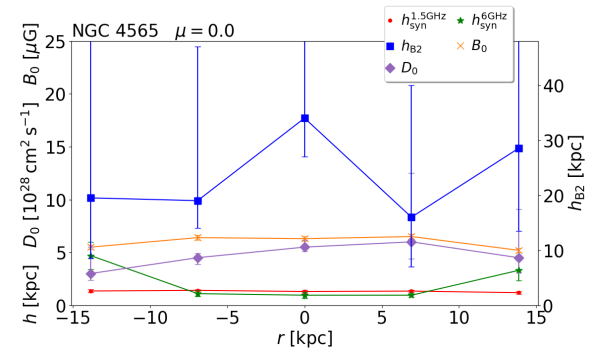 d)
d)
 a)
a) 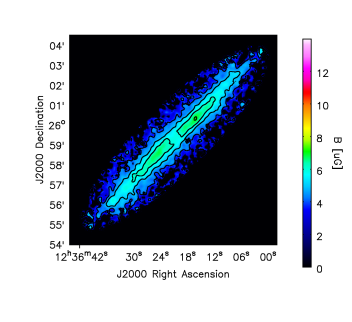 b)
b)
7.2 Results
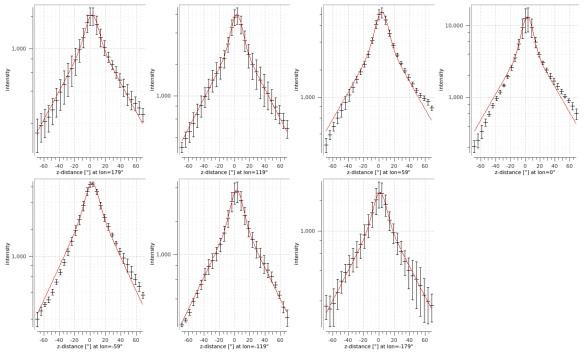
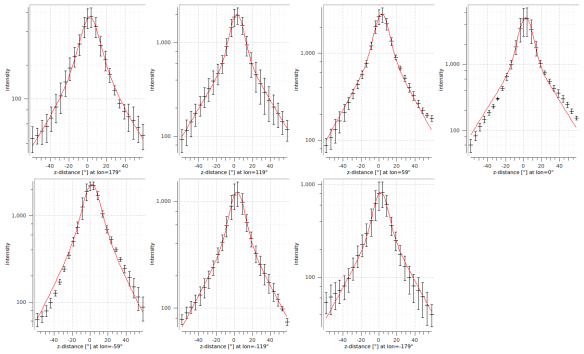
The measured intensity profiles (including the first ever results for the non-thermal scale heights of each galaxy666For brevity, we only present the non-thermal profiles here.), along with the best-fitting models, are displayed in Figs. 8 and 9. The error of each data point is the average standard deviation within the single horizontal rows of pixels in the respective box. This is to avoid the effect of intensity gradients in on the errors. The resulting scale heights of the total and non-thermal emission in disc and halo, and , are presented in Appendix C. Corresponding plots of the non-thermal halo scale height versus galactocentric radius as projected onto the major-axis are shown in Fig. 10. For each strip, we attempted to fit a single profile to both sides above () and below () the mid-plane. For NGC 4565 this type of fit was not always successful. In these cases, we performed separate fits for the northern and southern side and adopted the average scale height, replacing the formal fit errors by half the difference between the northern and southern value. The scale heights determined in this way are especially marked (see Appendix C for the values). The large reduced values for NGC 891 in the central strips are most probably resulting from the east–west asymmetry of its intensity distribution, that is from the different shapes of the profile on each side of the major axis. We found that separate fits for each side achieve much lower reduced values in the central strips for this galaxy, but yield average scale heights consistent with the single-fit results.
As evident from Figs. 10 a and b, the dumbbell shape of the halo of NGC 891 is reflected in the radial behaviour of its synchrotron scale heights. In line with the north–south asymmetry in total intensity, the scale heights are on average somewhat larger in the northern halo. The radial dependence of the scale heights in NGC 891 is very similar at both frequencies. In NGC 4565, on the other hand, there is a strong radial increase of the scale height at 6 GHz (with large uncertainties, however) that is not observed at 1.5 GHz.
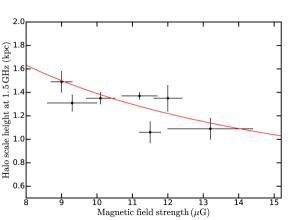
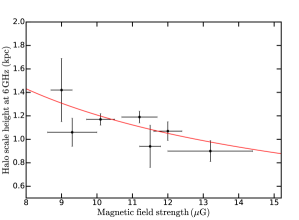
The non-thermal halo scale heights of NGC 891 increase from the central disc, where the total magnetic field strength in the mid-plane is largest, towards the outer disc with smaller values of . The relation at 1.5 and 6 GHz is shown in Fig. 16. The fitted lines have slopes of at 1.5 GHz and at 6 GHz. For NGC 4565, no significant relation between and is found at either frequency.
The non-thermal halo scale heights at 1.5 GHz are consistently larger than those at 6 GHz in both galaxies. The average ratio between the halo scale heights of the non-thermal emission at the two frequencies is for the seven strips of NGC 891 and for the three inner strips of NGC 4565 that have acceptable uncertainties. These results indicate that energy losses of the CRE depend on magnetic field strength and on frequency, such as synchrotron losses (see Sect. 9.3 for a discussion).
While in NGC 891 the total and non-thermal scale heights are basically identical, the values for NGC 4565 show substantial differences in this respect, which at least at 6 GHz can be explained by its higher thermal fractions. Furthermore, in NGC 4565 we measure extremely low values of , which are hardly believable, since such small scales (20 pc) are far from being resolved by our observations. On the other hand, a reliable measurement of using our highest-resolution data is not possible due to the resolved ring structure of the inner disc.
In the south-eastern half of NGC 4565, we obtain unusually large non-thermal disc scale heights at 6 GHz. It is possible that these have been fitted erroneously, as here the non-thermal disc emission is not well aligned with the mid-plane from a radius of kpc onwards. In addition, the relatively large disc scale heights at the centre are probably induced by the partially resolved ring pattern. The signature of the ring is visible in the central profiles ( in Fig. 9) as a flattening of the peak region, which makes it difficult to fit these profiles accurately. It should be noted that in these subplots the simultaneous fit of both sides of the major axis is displayed, even though in these cases we adopted as scale height the average result of the northern- and southern-side fits. Furthermore, we observe the position of the peak to shift from the mid-plane to negative galactic latitudes on the east side of the galaxy and to positive ones on the west side. This is likewise caused by the ring or spiral arm structure, as already noted by Broeils & Sancisi (1985).
The average halo scale height of the total emission of NGC 4565 at 6 GHz (1.6 kpc) is in agreement with the global value found by Dumke & Krause (1998). For NGC 891, however, we measure only 1.1 kpc, whereas Dumke & Krause (1998) measured 1.8 kpc. This discrepancy certainly arises from the fact that these authors averaged over regions that extend out to a larger radius, while at the same time the central region was excluded. In addition, a slightly different inclination and distance were assumed in this study.
8 Cosmic-ray transport in the halo
8.1 Total magnetic field strength distribution
A crucial input to CRE transport modelling is the total magnetic field strength in the disc. We assume equipartition between the energy densities of cosmic rays and magnetic fields. This assumption is valid in star-forming galaxies at spatial scales of more than about 1 kpc (Seta & Beck 2019). Using the revised equipartition relation of Beck & Krause (2005), we generated maps of the total field strength from the non-thermal 1.5 GHz intensity maps and the non-thermal spectral index maps formed between 1.5 and 6 GHz (all short-spacing corrected). We assumed a constant number-density ratio of CRE protons to CRE electrons of that is valid in the energy range relevant for the observed synchrotron emission. 777This value is consistent with the expectation from CR acceleration models and also with direct observations in the local neighborhood (see Beck & Krause 2005, for details). Even a large uncertainty of leads to a relatively small uncertainty of the magnetic field strength. It is reasonable to assume for the disc, but this value yields only a lower limit for in the halo. CR protons propagating into the halo are much less affected by energy losses than CR electrons, so that is expected to increase with . To estimate the pathlength through the galaxies, we assumed in both cases the geometry of an oblate spheroid with semi-major axis length and semi-minor axis length , and hence with a pathlength of . This is strictly valid only for an inclination of , but still serves as a reasonable approximation for nearly edge-on galaxies such as NGC 891 and 4565. Here, and were determined for each galaxy from the levels in the L-band D-array map, with being chosen as the average between the maximum and minimum extent above the central region. We obtained kpc and kpc for NGC 891, and kpc and kpc for NGC 4565.
The resulting maps of the (line-of-sight averaged) total magnetic field strength are presented in Fig. 11. Except for a few edge artefacts in the map of NGC 891 caused by low S/N and the region where we had subtracted the nucleus of NGC 4565, decreases monotonically with . The maximum magnetic field strength (averaged within the beam) is found in the disc with G in NGC 891 and G in NGC 4565, while the averaged disc field strength is G in NGC 891 and G in NGC 4565. Averaged over the regions in which we determined the scale heights, we obtain field strengths of G and G for NGC 891 and 4565, respectively. NGC 891 thus features rather typical field strengths for normal galaxies, while those in NGC 4565 are comparatively weak.
We used a Monte–Carlo method to estimate the magnetic field strength uncertainties, based on the rms noise in the input intensity maps (see Basu & Roy 2013). Uncertainties of the pathlength were not taken into account, since depends only weakly on the pathlength, and hence these errors ( kpc) do not make a significant contribution. The uncertainty in the proton-to-electron ratio contributes a systematic error. In the disc of NGC 891, we find that the rms error of is typically 3.5%, while at kpc it raises to 21%. For NGC 4565, typical rms errors are 3.6% in the mid-plane and 28% at kpc.
8.2 Cosmic-ray transport modelling
In what follows, we assume that the CREs are injected at and apply one-dimensional models describing either purely advective or purely diffusive vertical CRE transport. This is accomplished by numerically solving the 1D diffusion–loss equation using the SPectral INdex Numerical Analysis of K(c)osmic-ray Electron Radio-emission (SPINNAKER)888https://www.github.com/vheesen/Spinnaker software (Heesen et al. 2016). We follow the modelling procedure described in Heesen et al. (2018), which we summarise here, indicating case-specific choices of model parameters where applicable.
8.2.1 Parametrisation of advection and diffusion models
In one dimension, the steady-state diffusion–loss equation (e.g. Lerche & Schlickeiser 1980) for purely advective CRE transport at a constant speed is
| (3) |
In case of no streaming, the advection speed is equivalent to the wind speed. Otherwise, adding the Alfvén velocity would not increase with respect to the general uncertainty of our model, although sometimes super-Alfvénic streaming is assumed as well (Farber et al. 2018). For simplicity, we leave out this complication here and just study the advection speed. While cosmic ray-driven winds are expected to accelerate with height, they do so by less than an order of magnitude even within several kpc (Everett et al. 2008; Breitschwerdt et al. 2012). Assuming a constant advection speed is hence worth considering as a first simple approximation. In addition to , we also model linearly accelerated velocity profiles of the form
| (4) |
with launch velocity and velocity scale height . Such a linearisation is a useful approximation for the expected velocity profiles of pressure-driven wind models that go through a critical point.
For pure diffusion, the transport equation is given by
| (5) |
where the diffusion coefficient depends on the energy as . While Strong et al. (2007) found from modelling CRE propagation in the Milky Way, and Murphy et al. (2012) found (for a star-forming region in the Large Magellanic Cloud) a strong energy dependence of for CRs between 3 and 70 GeV, there are recent indications that the energy dependence may not be significant for CRE energies GeV (Recchia et al. 2016b; Mulcahy et al. 2016). We therefore fitted for using different choices of , as stated below.
Here, is the combined rate of synchrotron, IC, and (in case of advection) adiabatic losses999The contribution of ionisation and bremsstrahlung losses can be neglected, as we show in Appendix B. of a single CRE:
| (6) |
where is the Thomson cross section and and are the radiation field and magnetic energy density, respectively, which we calculated as described in Appendix A. For the numerical integration of Eq. (3) or (5), we use the boundary condition at of , where is the injection value of the CRE energy spectral index.
Motivated by the shape of the vertical intensity profiles observed for most galaxies (e.g. Krause et al. 2017; Heesen et al. 2018), a two-component exponential distribution of the total magnetic field strength is assumed:
| (7) |
where and are the magnetic field scale heights of the disc and halo component, is the total magnetic field strength in the mid-pane (at ), and is the difference between and the amplitude of the halo field component.
CRE transport by advection and diffusion may occur simultaneously in the halo. Some models predict that advection dominates over diffusion soon after the CREs break out of the disc (Ptuskin et al. 1997; Recchia et al. 2016a). Here we only consider either pure advection or pure diffusion models.


8.2.2 Fitting procedure
For each galaxy, we attempted to fit both advection and diffusion models. To study the radial behaviour of advection speed, diffusion coefficient, and magnetic field scale height, we modelled the CRE transport at the same major-axis positions for which the synchrotron scale heights were determined.
As input data for each vertical strip, we used the (two-point) spectral index profile derived from the non-thermal intensity profiles at both frequencies, as well as the intensity model profiles at 1.5 GHz as computed in Sect. 7. We prefer using the model profiles over fitting directly to the data as the former are deconvolved from the effective beam and thus have a resolved disc component. The error bars of these intensity values were derived from the amplitude and scale height uncertainties. In all cases, we use the 1.5 GHz intensity profiles, as their amplitudes and scale heights (hereafter ) are constrained better than those at 6 GHz due to the higher S/N in the 1.5 GHz maps.
Since the observed spectral index distributions are not symmetric with respect to the mid-plane, we produced separate models for the northern and southern side of each galaxy. Moreover, we restricted the fitting of the spectral index profiles to the halo regime ( pc for NGC 891 and pc for NGC 4565), as the effective beam cannot be deconvolved from these profiles.
As the above-mentioned plateau of faint emission in the 6 GHz data of NGC 891 would artificially flatten the outer parts of the spectral index profiles, we performed the overall modelling only out to kpc for this galaxy. For NGC 4565, we omitted the data point at in the intensity profiles, as the scale heights of the (mostly) extremely thin disc component modelled in Sect. 7 are smaller than the FWHM of the synthesised beam by more than an order of magnitude. We thus only fitted a single intensity component for NGC 4565, which, for consistency, we keep referring to as the halo component.
To obtain the mid-plane total magnetic field strength at each radial position, we ran BoxModels on the map and adopted the average value within the central box of each respective strip. We then performed a simultaneous fit of the spectral index profile and the intensity profile, varying the parameters (or ), , , (or , s.b.), and until we found a reasonable initial guess model. As the fit of the intensity profile depends mainly on the magnetic field profile, and conversely the fit of the spectral index profile depends almost exclusively on the advection speed or diffusion coefficient, the parameters could be constrained very well by the simultaneous fitting in most cases. For each model, and were kept fixed at the initial guess value (for NGC 4565 we set both to zero for the reasons given above). We then probed a range of values for (or ) and to find the minimum for the intensity and spectral index fits. For the accelerated advection models (Eq. 4), we kept fixed at the expected equipartition value (assuming an average of in the halo of NGC 891 and for NGC 4565) and varied and .101010Similar to the behaviour of and in the constant-velocity models, the choice of mostly affects the spectral index profile, while (at a fixed ) mostly affects the intensity profile. In each case, the set of parameters which minimises the sum of both reduced values () was adopted as the best-fitting solution.
For , we enforced an upper limit in that we did not allow values steeper than the lower error margin of the innermost fitted spectral index data point in each case. However, we did allow values that may be steeper than the true injection spectral index (i.e. ), as the disc contains CREs of various spectral ages, with older populations occurring in inter-arm regions (e.g. Tabatabaei et al. 2013) and possibly in superbubbles (Heesen et al. 2015).
While for the diffusion models of NGC 891 the best fits were achieved using the commonly assumed energy exponent of , NGC 4565 could also be fitted with lower values of . Hence, for comparison we additionally modelled this galaxy with and . Diffusion produces approximately Gaussian intensity profiles whereas advection leads to exponential ones. Therefore, since the synchrotron emission of NGC 4565 is described equally well by Gaussian and exponential profiles, we used the former for modelling diffusion and the latter for modelling advection. For each model, we adopted the range of (or ), and (or ) values for which both and as their upper and lower error margins.
8.2.3 Results
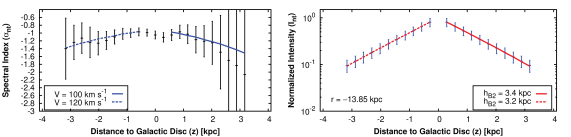
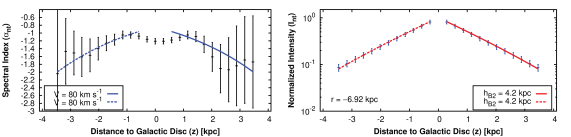
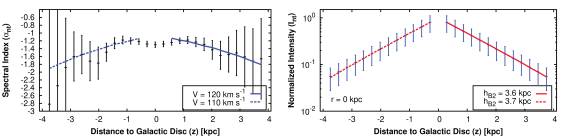
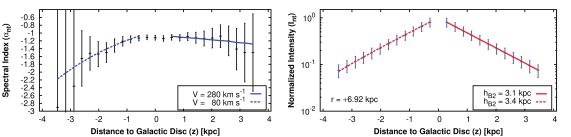
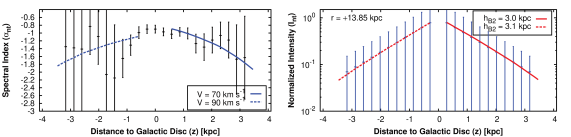
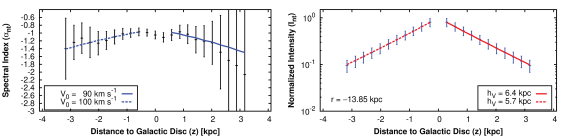
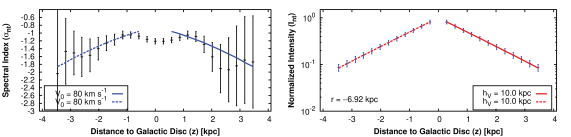
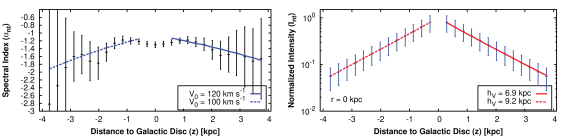
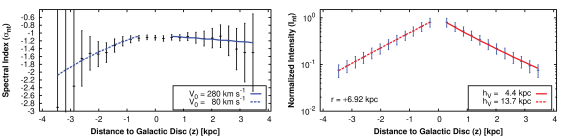
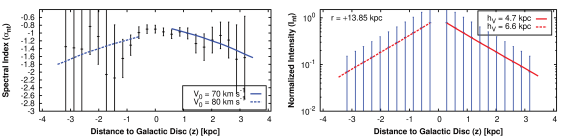
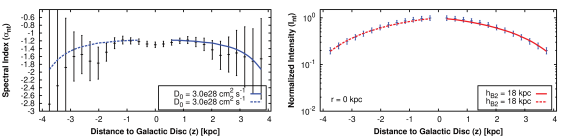
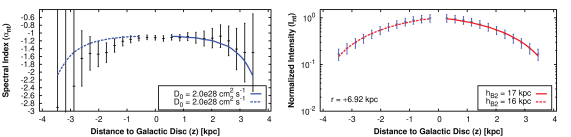
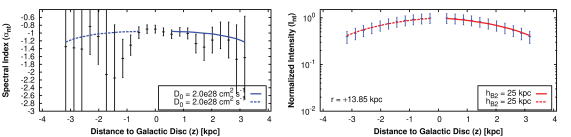
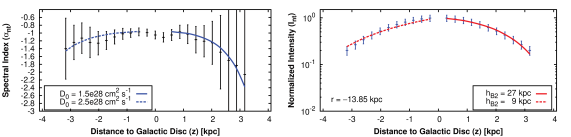
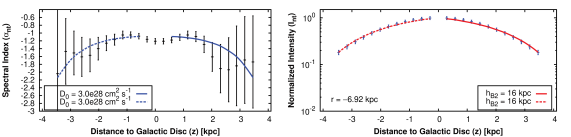
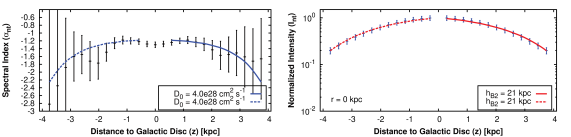
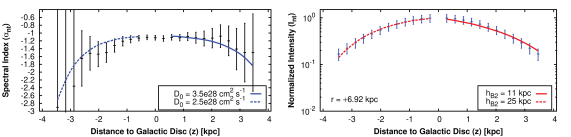
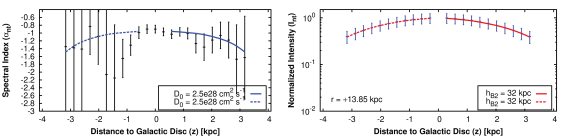
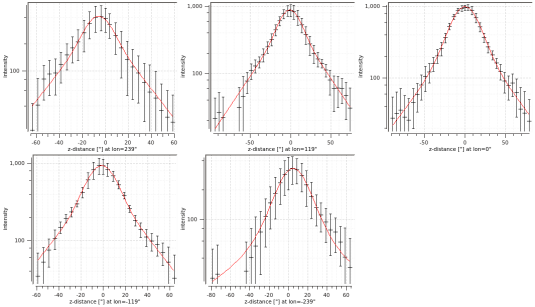
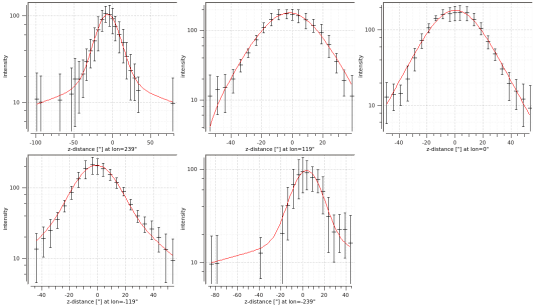
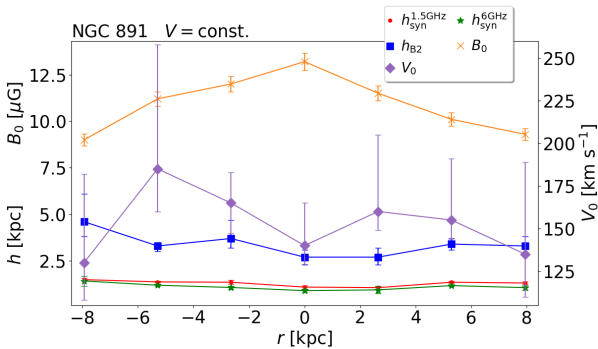
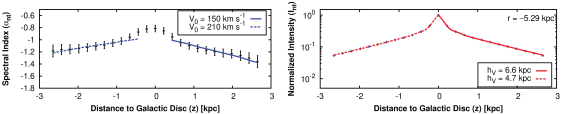
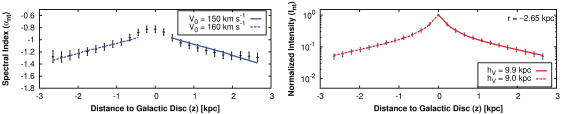
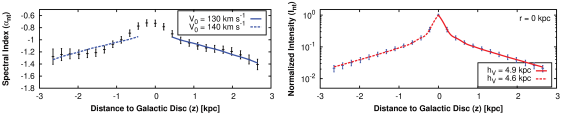
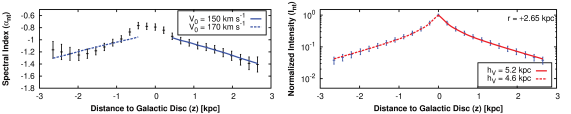
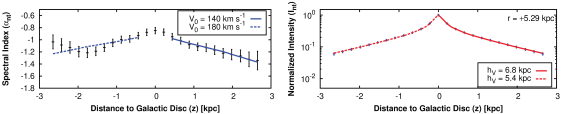
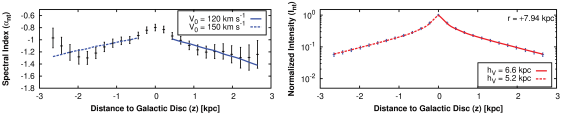
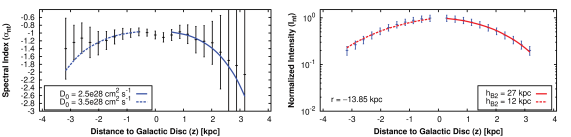
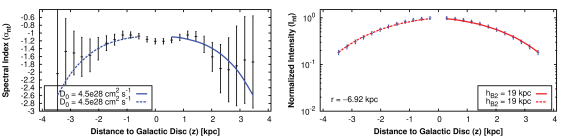
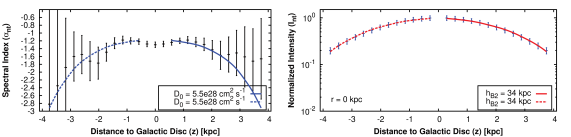
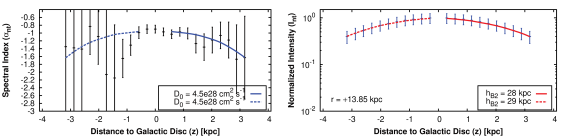
We present the vertical profiles of the non-thermal spectral index and the non-thermal intensity at each major-axis position, along with our best-fitting advection and diffusion models, in Figs. 12 and 13 for our preferred solutions. The remaining models are presented in Appendix D, where we also list the key parameters for all models. In order to illustrate the dependence with galactocentric radius, we present radial profiles of these parameters for a subset of models in Fig. 10.
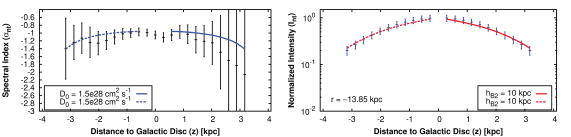
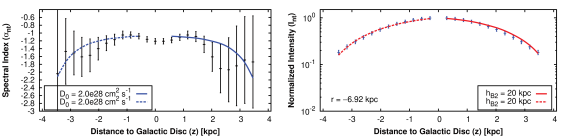
For NGC 891, advection is clearly favoured over diffusion, mainly because the data are more consistent with the linear spectral index profiles produced by advection. We find advection speeds consistently around 150 , with a tendency towards high upper error limits at large radii. For both advection and diffusion, the halo magnetic field scale height shows a similar behaviour to the synchrotron scale heights, however with a stronger increase at the eastern edge ( kpc), where it reaches about twice the value at the centre. The diffusion models for NGC 891 fit the data considerably worse than the advection models (as evident in particular on the south side of the central strip, where the best achievable is 3.6), as they predict a shape of the profile opposite to what is observed: our data show a rather steep decline of in the lower halo, followed by a more shallow profile at high (with the tendency to flatten out in most cases), whereas diffusion results in a shallow decline at low , followed by a steep one towards the outer halo. Apart from this, we do obtain reasonable diffusion coefficients of .
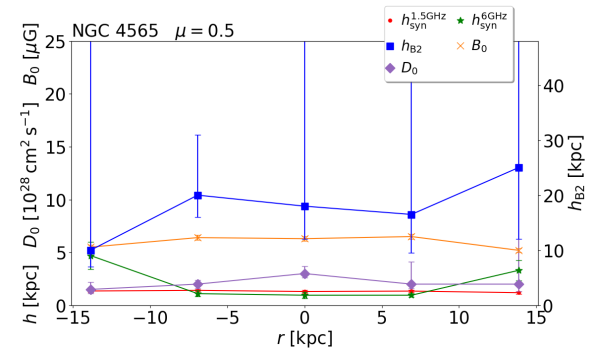
In the case of NGC 4565, we find that all of our models yield reasonable fits in terms of constantly low . However, for diffusion with , this is mainly due to the large spectral index uncertainties for kpc. From kpc onwards, the profiles steepen more rapidly than predicted by these models, so that for diffusion the best-fitting solutions are rather found with (and in some cases ). The lower the assumed energy dependence of , the higher needs to be to fit the profiles. For , still turns out to be in a realistic range (up to ; except for the northern halo at kpc, where we find ). For advection, turns out to be rather constant with radius, as for NGC 891, however with values of only around 90 (again with the exception of the northern side at kpc, where the spectral index remains comparatively flat for some reason). The corresponding values are radially constant as well (around 3.5 kpc), but would have increased at the disc edges if we had fitted to the profiles instead (cf. Fig. 10). Still, our upper error limits for are highest at the edges. For diffusion, the values are much higher than for advection, since here we used the Gaussian models. They are, however, badly constrained in this case, as above a certain value, increasing has a negligible effect on fitting the intensity profiles. In several cases, the intensity error bars are in fact large enough to allow for the magnetic field strength to be practically constant in .
In case of accelerated advection, the initial velocities for both galaxies are either equal to or marginally lower than the velocities in the respective constant-advection models. On the other hand, various amounts of acceleration (controlled by ) are required to fit the intensity profiles.
9 Discussion
 a) NGC 891
 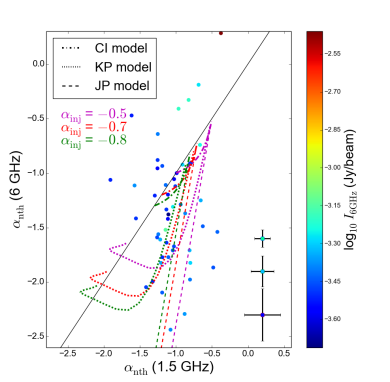 b) NGC 4565
9.1 CRE injection and spectral ageing
Cosmic rays are injected into the ISM with a power-law spectrum in energy that leads to a power-law spectrum of synchrotron intensity with radio frequency (). For diffusive shock acceleration (see e.g. Caprioli 2015), an initial radio spectral index between and is expected. At radio frequencies of typically GHz, synchrotron and inverse-Compton (IC) losses are expected to induce a break in the local CRE emission spectrum. The shape of this spectral break (and its evolution with time) depends on the CRE injection process (i.e. and injection time-scale) and their energy loss rate, which in turn depends on the magnetic field strength and on the distribution of their pitch angles with respect to the magnetic field lines. Here, the standard theory distinguishes between two models for a discrete epoch of particle injection: according to the Kardashev–Pacholczyk (KP) model (Kardashev 1962; Pacholczyk 1970), the individual electrons maintain their original pitch angles and the spectrum declines as a power law with spectral index , whereas in the Jaffe–Perola (JP) model (Jaffe & Perola 1973) an isotropic distribution of pitch angles is generated, causing the spectrum to cut off exponentially. For continuous injection (CI) of CREs (at a constant injection rate), the spectrum above the break frequency is a power law with spectral index (and thus less steep than for the discrete-epoch injection models).111111The JP model is consistent with the SPINNAKER advection model, where the CREs are injected in the disc which is equivalent to a discrete-epoch injection model. Further, an isotropic pitch angle distribution of the CREs is assumed.
We note that the above loss mechanisms, especially described by JP and KP models, are valid for the scenario when cosmic rays are injected on time-scales significantly larger than the typical CRE energy loss time-scales. Moreover, when large volumes of galaxies are averaged by the telescope beam, a combination of loss mechanisms and spatially varying CRE lifetimes are encompassed, resulting in strong spectral fall-offs to become smoother. The injection time-scale of cosmic rays is similar to the rate of supernovae of massive stars (). Assuming a Kroupa-type initial mass function (Kroupa 2001) and a typical SFR surface density of up to for edge-on galaxies, the injection times-scale of CREs is . Therefore, at the angular resolution of our investigation, equating to spatial resolutions of 530 and 700 pc in NGC 891 and 4565, respectively, we expect that JP- or KP-type models for CRE energy loss are applicable. However, recent relativistic electromagnetic particle simulation by Holcomb & Spitkovsky (2018) demonstrates that interaction of cosmic rays with self-generated Alfvén waves results in pitch angle scattering, suggesting the KP model to be a less likely model for CRE energy loss.
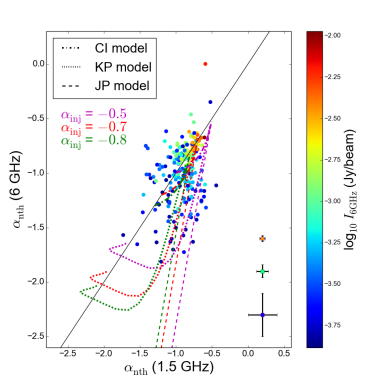
Having determined the spatially resolved non-thermal spectral index distribution at two well-separated frequencies, it is possible to put constraints on the shape of the spectrum for a given line of sight. In Fig. 14 we show scatter plots of vs. for both galaxies. The maps were first clipped below (NGC 891) and (NGC 4565) in total intensity, to reduce the effect of noise-based edge artefacts. Each point represents a beam-averaged value and is colour-coded based on , so that red (NGC 891) or light-blue (NGC 4565) data points are associated with the disc, while dark-blue points represent the halo.
To help interpreting these plots, we constructed synthetic KP, JP, and CI spectra for different choices of break frequency and injection spectral index (also see Basu et al. 2015). In both panels of Fig. 14 we show the trajectories in the - plane that the different models predict for an injection spectral index of , , and . Moving from flatter to steeper values of and along these trajectories corresponds to a decrease in and hence a forward movement in time; in turn an expected increase in for edge-on galaxies.
As for the CI model a maximum difference between and is reached at , we find for both galaxies that the majority of data points below the 1:1 line cannot be explained by a continuous injection process, but are reproduced well by the KP and JP models. For NGC 891, the maximum steepening among the plotted data points corresponds to for the JP model and for the KP model. In NGC 4565, of the three models only the JP model matches the points of maximum steepening, which are found at .
In NGC 891, spectral indices steeper than above the level seem hardly plausible (at least at 1.5 GHz), as we pointed out above on the basis of the map. If we ignore all values steeper than in Fig. 14 a , the remaining data points are within their errors roughly consistent with the CI model, with lying in the typically expected range between and . When ignoring only , most of the remaining points at steeper are still found in that same range of if a KP or JP model is considered. We note that the error bars plotted in Fig. 14 are based on the maps, which represent only statistical errors and thus do not account for any systematic errors related to short-spacing corrections or uncertainties in estimating the thermal contribution.
Even though for NGC 4565 the noise-induced spectral index errors are quite large, a clear trend towards stronger steepening between the two frequencies than in NGC 891 is seen, especially considering that all data points shown in Fig. 14 b are still located in the disc of the galaxy. As previously indicated, this trend is already evident by comparing the maps of the two galaxies, which are affected much less by uncertainties than the corresponding in-band maps. As a consequence of the strong spectral steepening, the data points in the scatter plot of NGC 4565 predominantly conform to the JP and KP models. We will briefly get back to discussing spectral ageing effects in Sect. 9.4.
| Galaxy | [kpc] | [kpc] | [kpc] | [kpc] | [kpc] | [kpc] |
|---|---|---|---|---|---|---|
| NGC 891 (1.5 GHz) | 0.17 0.02 | 1.28 0.14 | 0.19 0.03 | 1.29 0.15 | 4.64 0.69 | |
| NGC 891 (6 GHz) | 0.17 0.04 | 1.09 0.10 | 0.20 0.06 | 1.11 0.16 | 4.10 0.56 | |
| NGC 4565 (1.5 GHz) | 0.02 0.01 | 1.60 0.17 | 0.05 0.07 | 1.35 0.06 | 3.40 0.50 | |
| NGC 4565 (6 GHz) | 0.08 0.13 | 1.36 0.39 | 0.41 0.20 | 1.00 0.09 | 3.11 0.94 |
9.2 Normalised scale heights
Krause et al. (2018) found that the halo scale height of the total emission from a galaxy primarily depends on its (radio) disc diameter. In order to eliminate this diameter dependence of halo scale heights, they defined a normalised scale height as , where is the radio diameter at a given frequency. We determined the radio diameters of both galaxies at each frequency from the contour in the respective total emission maps that were used for the scale height measurements. To calculate , we used the average total emission scale height , where for NGC 4565 we averaged only over the three inner strips at both frequencies. The resulting diameters and normalised scale heights are listed in Table 6.
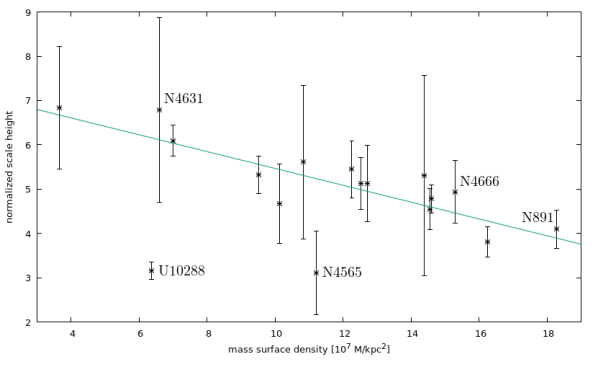
Moreover, Krause et al. (2018) observed a tight anti-correlation between and the total mass surface density , which indicates that a gravitational deceleration of the vertical CRE transport occurs. To check how NGC 891 and 4565 relate to the tight anti-correlation we computed the latter as ), where is the total mass (taken from Irwin et al. 2012) and is the blue-light radius (calculated from the blue diameter as given in Table 1). We obtained Mkpc-2 for NGC 891 and Mkpc-2 for NGC 4565. Figure 15 shows that on the one hand NGC 891 fulfills the anti-correlation, which strengthens the evidence for a gravitational deceleration, since with this galaxy we have extended the sample of Krause et al. (2018) to higher mass surface densities.
On the other hand, with NGC 4565 we have determined a second outlier besides UGC 10288, both having rather low normalised scale heights but no exceptionally high mass durface densities. Notably, both NGC 4565 and UGC 10288 have a significantly lower average total magnetic field strength (6 G) than the rest of the sample. This suggests that either the – anti-correlation breaks down for galaxies with weak magnetic fields, or that there is a similar anti-correlation for this type of galaxy, with an offset regarding the normalised scale heights.
9.3 NGC 891: Accelerated advection flow
The analysis in Sect. 8 has shown that the CRE transport in the halo of NGC 891 is advection-dominated. However, models with constant advection speeds find , which is below the escape velocity near the mid-plane (where kpc is the radial extent of the flat part of the rotation curve; Oosterloo et al. 2007). This would imply that the galaxy does not host a galactic wind. Heesen et al. (2018) found a much higher value of , mainly because their larger beam size restricted the fit of the spectral index profile to kpc. Another finding of our models that deserves closer attention is that with a constant advection speed the halo magnetic field scale heights are systematically lower (mostly by 35%) than what is expected for energy equipartition; in contrast, the diffusion models are mostly consistent with .
In case the magnetic field and CREs are coupled to the ionised gas, the scale height of the X-ray emission relates to the CRE scale height as . For equipartition, we expect and hence and . For NGC 891, Li & Wang (2013a) found globally kpc, which is consistent with our average values of . The result of Li & Wang (2013a) is possibly biased by the inclusion of the bulge component and may therefore even underestimate the X-ray scale height of the halo (Hodges-Kluck & Bregman 2013). This suggests that we underestimated by enforcing and hence equipartition in the halo cannot be ruled out.
As mentioned above, models with fixed equipartition scale heights for the halo can indeed be fitted by assuming an accelerated advection flow. Then the values for (i.e. ) can be considered lower limits, as the CRE gas is progressively diluted due to the acceleration resulting in adiabatic energy loss of the CREs, which lowers the synchrotron intensity at high . To compensate for this effect, a larger magnetic field scale height is required to fit the intensity profile.
For the accelerated advection model, the height at which the advection speed exceeds the escape velocity, , is plotted in Fig. 10 as function of galactocentric radius as projected onto the major axis (see Appendix D for tabulated values). We find that this occurs in the upper halo, mostly at heights of .
The observed increase of the halo scale height with decreasing (disc) field strength (see Fig. 16) indicates that synchrotron losses indeed play an important role in NGC 891. A likely scenario is that the CREs suffer from synchrotron losses in the inner halo, causing the steepening of the spectral index and the dependence of scale height on field strength, whereas the accelerating wind causes the observed flattening of the spectral index profile towards the outer halo (where adiabatic expansion losses possibly dominate over synchrotron losses).
Based on an observation with the Low Frequency Array (LOFAR) at 146 MHz and our CHANG-ES data at 1.5 GHz, Mulcahy et al. (2018) found an average ratio of the scale heights of the non-thermal halo emission of , which gives a scaling with frequency as with . This points towards dominating synchrotron losses together with diffusive CR propagation, for which is expected if the diffusion coefficient is not energy dependent. On the other hand, the vertical spectral index profile they measured is almost linear (like in our case) and therefore indicates advective propagation.
As far as scale heights are concerned, a more suitable indicator of CR transport mode is the ratio of the normalised scale heights, since these have been corrected for their diameter dependence. A reliable correction (normalisation) for the diameter dependence of the scale height is difficult at 146 MHz because the LOFAR map of Mulcahy et al. (2018) is less sensitive (lower S/N) than the VLA maps. Between 1.5 and 6 GHz, we found a ratio of scale heights of the non-thermal emission of (see Sect. 7.2) and a ratio of normalised scale heights of , which means that and scale with frequency as with and with , respectively. These values suggest synchrotron losses with diffusive propagation with an energy-dependent diffusion coefficient ( expected for ). Alternatively, the data may be explained by a mixture of escape losses () and synchrotron losses with advective propagation ().
The observed relation between the non-thermal halo scale heights and total magnetic field strengths with exponents of at 1.5 GHz, at 6 GHz (Fig. 16), and at 146 MHz (Mulcahy et al. 2018), is consistent with either (1) synchrotron losses with advective propagation (), or (2) synchrotron losses with diffusive propagation with or without energy-dependent diffusion ( expected for and for ). While the significant dependence of halo scale height on magnetic field strength supports that synchrotron losses of the CRE are dominating, the uncertainties do not allow us to further constrain the type of CRE propagation. Most notably, the relatively weak frequency dependence of the halo scale heights appears to be in conflict with our above results from modelling that advection dominates the CR transport and that an accelerating wind is present. However, our modelling allows that a mixture of synchrotron and escape losses is occurring and diffusion may still make a significant contribution. What we possibly observe is a mixture of regions with substantially different magnetic field strengths and advection speeds within a given resolution element and line-of-sight. In this scenario – which is also suggested by the observed radial variations in and – both synchrotron-loss- and escape-loss-dominated regions may be present in NGC 891, and likewise the predominance of advective or diffusive CRE transport may regionally vary throughout the galaxy.
9.4 NGC 4565: Advection or diffusion?
The model results for NGC 4565 are somewhat ambigious as to whether diffusion or advection is the dominant CR transport process. This allows to consider the possibility that NGC 4565 is actually an intermediate case, where both mechanisms make a significant contribution in the halo. During its lifetime a CRE can travel to a distance either by diffusion, , or by advection, . Hence, advection will take over from diffusion at a certain height as the dominating transport process for a non-zero advection speed. The critical height above which advection takes over diffusion can be estimated by equating the diffusive and advective time-scales (e.g. Recchia et al. 2016a):
| (8) |
with being the diffusion coefficient in units of and the advection speed in units of 100 . Inserting our average fit values of (for ) and results in kpc, which is equal to the average at 1.5 GHz. The velocity scale heights in our accelerated advection models () are quite large by comparison, therefore would not change significantly in this case. The rather constant profiles up to kpc suggest that diffusion indeed dominates at least up to this height. Therefore, the advection speeds we obtained have to be considered as upper limits. However, given the large spectral index uncertainties in the halo, we are unable to formally distinguish between advective and diffusive CRE transport at kpc.
The ratio of scale heights of the non-thermal emission between 1.5 and 6 GHz is (Sect. 7.2) and the ratio of normalised scale heights is . Hence, and scale with frequency with exponents and , respectively, suggesting synchrotron losses with diffusive propagation, with or without an energy-dependent diffusion coefficient ( between and for between 0 and 0.5).
As in the case of NGC 891, is 30% lower than for advection at a constant speed. Contrary for diffusion, is even higher (on average by a factor of 3.5) than the equipartition values derived from the Gaussian synchrotron scale heights; this suggests that the galaxy might be advection-dominated from a certain height onwards. The X-ray scale heights measured by Li & Wang (2013a) would predict kpc (north), kpc (south), which is loosely compatible with the expected of 5–6 kpc. Hence, we again assume equipartition in the following considerations.
To study whether a galactic wind may be present in case of advection, we again determined the heights where the escape velocity of is reached (see Appendix D). Except on the north side at kpc, is an order of magnitude larger than the detected vertical halo extent, therefore the presence of a wind can be safely ruled out for this galaxy.
We recall that NGC 4565 is the only galaxy besides UGC 10288 known to fall outside the – anti-correlation found by Krause et al. (2018), and that both galaxies have in common a low total magnetic field strength. Notably, all galaxies from the Krause et al. (2018) sample except UGC 10288 seem to be in agreement with an advection-dominated halo, which suggests that a certain minimum magnetic field strength may be required for a strong advection flow and hence for a galactic wind.
The absence of a wind as well as the absence of a bright and extended halo also appears to be plausible in view of our findings regarding the CRE injection in the disc (Sect. 6). Considering the low of , and unless we severely overestimated the thermal emission component, it is very likely that in this galaxy the CRE injection rates are lower than the synchrotron loss rates, which would explain why the spectra are best described by models for discrete-epoch injection (JP or KP). These low injection rates are apparently not sufficient to produce a strong advection flow.
A scenario that might explain the strong spectral steepening we observe in NGC 4565 is that it is currently in a quiescent phase following a former period of higher star-forming activity. To investigate whether SN rates are indeed low enough to cause significant spectral ageing, they need to be compared to the CRE energy loss rates. However, determining how SN rates locally influence the observed CRE spectra in an edge-on galaxy is not straightforward due to the long lines of sight through the disc.
10 Summary and conclusions
In this paper, we used wide-band VLA radio continuum observations at 1.5 and 6 GHz to study the CRE propagation in the edge-on galaxies NGC 891 and 4565. We corrected the total emission for the thermal contribution estimated from H and IR data and applied short-spacing corrections at 6 GHz using Effelsberg observations. Then we analyzed the spectral index distribution between the two observing frequencies as well as within each frequency band and compared these data to standard models of CRE spectral ageing. Further, we determined radio scale heights at various galactocentric radii as projected onto the major axis – for the first time also for the non-thermal radio continuum emission –, and generated maps of the total magnetic field strength assuming energy equipartition between the CREs and the magnetic field. Finally, we modelled advective and diffusive CRE transport by solving the 1D diffusion–loss equation. This was again done at different major-axis positions, to study the radial dependence of advection speeds, diffusion coefficients, and synchrotron and magnetic field scale heights. Our main findings are the following:
-
•
The non-thermal spectral index in NGC 4565 is consistently steeper than in NGC 891. Between and 6 GHz, the disc-averaged non-thermal spectral index is in NGC 891 and in NGC 4565.
-
•
The overall non-thermal spectral index distribution of NGC 891 is mostly consistent with continuous CRE injection. In NGC 4565, most of the local synchrotron spectra (also in the disc) feature a break between 1.5 and 6 GHz and are thus more in line with discrete-epoch injection (JP or KP models). This implies low CRE injection rates (as expected due to the low SFR and ), which are possibly lower than the synchrotron loss rates.
-
•
We detect a thin radio ring associated with the previously known ring of molecular gas and dust. The ring has a vertical thickness of pc and a width in the galactic plane of kpc.
-
•
The synchrotron halo scale heights of NGC 891 increase with radius, which is in line with the dumbbell shape of its radio continuum halo and indicates significant synchrotron losses of the CREs. Still, there may be regions where CRE escape losses dominate.
-
•
Assuming energy equipartition, the average (maximum) total magnetic field strength in the disc of NGC 891 is 10 G (15 G). In the disc of NGC 4565 we measure 6 G (7 G).
-
•
The CRE transport in the halo of NGC 891 is probably dominated by advection. This advection flow is an accelerated galactic wind of velocity near the mid-plane, and reaches the escape velocity at a height of 9 to 17 kpc, depending on major-axis position. Moreover, this wind is likely to coexist with diffusion-dominated regions. Vertical emission gradients are dominated by the dilution of the CRs resulting from the adiabatic expansion, while synchrotron losses cause a steepening of the spectral index with height.
-
•
NGC 4565 is diffusion-dominated at least to heights of kpc (and probably throughout the halo to even larger heights), with a diffusion coefficient .
-
•
The results for NGC 4565 indicate that at CRE energies of a few GeV the diffusion coefficient is only weakly energy-dependent ( with ).
-
•
Our results for NGC 891 are compatible with energy equipartition if the advection flow is accelerated. For NGC 4565 this is the case as well if both advection and diffusion make a significant contribution to the CRE transport in the halo.
Our analysis demonstrates that the data quality currently provided by the VLA is sufficient for studying the spatial and spectral behaviour of various key quantities related to CRE propagation in galactic discs and haloes. Future work could examine how common dumbbell-shaped haloes are among galaxies, and how the presence of a dumbbell shape correlates with synchrotron-loss- and escape-dominated haloes and with diffusive and advective CRE transport. Related to this, it is still unclear if and how scale heights, advection speeds, and diffusion coefficients depend on the local and within a galaxy.
A step forward in answering such open questions would be to apply the methods presented here to the remaining galaxies in the CHANG-ES sample. This should also include the spectral ageing analysis for each galaxy, to test whether the expected correlation of spectral steepening with SFR, advection speed, and halo extent holds true. We plan to extend our study to a higher number of observing frequencies (with low frequency data being provided by for instance LOFAR) and thus properly sample the spatially resolved CRE spectral energy distribution. This would allow us to test more sophisticated spectral evolution models than those considered in this work. Making use of multi-frequency data may also help to distinguish better between advective and diffusive CRE transport in cases such as NGC 4565, and to put better constraints on magnetic field scale heights. The latter is feasible in particular if the full polarisation information of the CHANG-ES observations is utilised. An upcoming comprehensive study of the extraplanar rotation measures (RMs) in all CHANG-ES galaxies is expected to provide valuable information on the 3D magnetic field structure in galactic haloes.
Acknowledgements.
We thank Hans-Rainer Klöckner for his valuable comments on the manuscript. We thank Fatemeh Tabatabaei for the reduction of the 8.35 GHz Effelsberg data. The KPNO H maps were provided to us with the kind permission of Maria Patterson.This research has used the Karl G. Jansky Very Large Array operated by the National Radio Astronomy Observatory (NRAO). NRAO is a facility of the National Science Foundation operated under co-operative agreement by Associated Universities, Inc. Moreover, this research is partly based on observations with the 100-m telescope of the MPIfR (Max-Planck-Institut für Radioastronomie) at Effelsberg. We thank the operators for their help during the observations.
References
- Allen et al. (1978) Allen, R. J., Sancisi, R., & Baldwin, J. E. 1978, A&A, 62, 397
- Aniano et al. (2011) Aniano, G., Draine, B. T., Gordon, K. D., & Sandstrom, K. 2011, PASP, 123, 1218
- Baars et al. (1977) Baars, J. W. M., Genzel, R., Pauliny-Toth, I. I. K., & Witzel, A. 1977, A&A, 61, 99
- Basu et al. (2015) Basu, A., Beck, R., Schmidt, P., & Roy, S. 2015, MNRAS, 449, 3879
- Basu & Roy (2013) Basu, A. & Roy, S. 2013, MNRAS, 433, 1675
- Beck et al. (1979) Beck, R., Biermann, P., Emerson, D. T., & Wielebinski, R. 1979, A&A, 77, 25
- Beck & Krause (2005) Beck, R. & Krause, M. 2005, Astronomische Nachrichten, 326, 414
- Bietenholz et al. (2010) Bietenholz, M. F., Bartel, N., & Rupen, M. P. 2010, ApJ, 712, 1057
- Breitschwerdt et al. (2012) Breitschwerdt, D., de Avillez, M. A., Baumgartner, V., & Dogiel, V. A. 2012, in EAS Publications Series, Vol. 56, EAS Publications Series, ed. M. A. de Avillez, 333–342
- Breitschwerdt et al. (1991) Breitschwerdt, D., McKenzie, J. F., & Voelk, H. J. 1991, A&A, 245, 79
- Briggs (1995) Briggs, D. S. 1995, in Bulletin of the American Astronomical Society, Vol. 27, American Astronomical Society Meeting Abstracts, 112.02
- Broeils & Sancisi (1985) Broeils, A. H. & Sancisi, R. 1985, A&A, 153, 281
- Buffie et al. (2013) Buffie, K., Heesen, V., & Shalchi, A. 2013, ApJ, 764, 37
- Calzetti et al. (2007) Calzetti, D., Kennicutt, R. C., Engelbracht, C. W., et al. 2007, ApJ, 666, 870
- Caprioli (2015) Caprioli, D. 2015, in International Cosmic Ray Conference, Vol. 34, 34th International Cosmic Ray Conference (ICRC2015), ed. A. S. Borisov, V. G. Denisova, Z. M. Guseva, E. A. Kanevskaya, M. G. Kogan, A. E. Morozov, V. S. Puchkov, S. E. Pyatovsky, G. P. Shoziyoev, M. D. Smirnova, A. V. Vargasov, V. I. Galkin, S. I. Nazarov, & R. A. Mukhamedshin, 8
- Cornwell et al. (2008) Cornwell, T. J., Golap, K., & Bhatnagar, S. 2008, IEEE Journal of Selected Topics in Signal Processing, 2, 647
- Dahlem et al. (1994) Dahlem, M., Dettmar, R.-J., & Hummel, E. 1994, A&A, 290, 384
- Dahlem et al. (1995) Dahlem, M., Lisenfeld, U., & Golla, G. 1995, ApJ, 444, 119
- Dettmar (1992) Dettmar, R. J. 1992, FCPH, 15, 143
- Dettmar & Schulz (1992) Dettmar, R. J. & Schulz, H. 1992, A&A, 254, L25
- Dorfi & Breitschwerdt (2012) Dorfi, E. A. & Breitschwerdt, D. 2012, A&A, 540, A77
- Draine (2011) Draine, B. T. 2011, Physics of the Interstellar and Intergalactic Medium
- Dumke (1997) Dumke, M. 1997, PhD thesis, Universität Bonn
- Dumke & Krause (1998) Dumke, M. & Krause, M. 1998, in Lecture Notes in Physics, Berlin Springer Verlag, Vol. 506, IAU Colloq. 166: The Local Bubble and Beyond, 555–558
- Dumke et al. (1995) Dumke, M., Krause, M., Wielebinski, R., & Klein, U. 1995, A&A, 302, 691
- Everett et al. (2008) Everett, J. E., Zweibel, E. G., Benjamin, R. A., et al. 2008, ApJ, 674, 258
- Farber et al. (2018) Farber, R., Ruszkowski, M., Yang, H.-Y. K., & Zweibel, E. G. 2018, ApJ, 856, 112
- Garcia-Burillo & Guelin (1995) Garcia-Burillo, S. & Guelin, M. 1995, A&A, 299, 657
- Girichidis et al. (2018) Girichidis, P., Naab, T., Hanasz, M., & Walch, S. 2018, MNRAS, 479, 3042
- Girichidis et al. (2016) Girichidis, P., Naab, T., Walch, S., et al. 2016, ApJ, 816, L19
- Hanasz et al. (2013) Hanasz, M., Lesch, H., Naab, T., et al. 2013, ApJ, 777, L38
- Heald et al. (2011) Heald, G., Józsa, G., Serra, P., et al. 2011, A&A, 526, A118
- Heesen et al. (2009) Heesen, V., Beck, R., Krause, M., & Dettmar, R.-J. 2009, A&A, 494, 563
- Heesen et al. (2015) Heesen, V., Brinks, E., Krause, M. G. H., et al. 2015, MNRAS, 447, L1
- Heesen et al. (2016) Heesen, V., Dettmar, R.-J., Krause, M., Beck, R., & Stein, Y. 2016, MNRAS, 458, 332
- Heesen et al. (2018) Heesen, V., Krause, M., Beck, R., et al. 2018, MNRAS
- Hodges-Kluck & Bregman (2013) Hodges-Kluck, E. J. & Bregman, J. N. 2013, ApJ, 762, 12
- Holcomb & Spitkovsky (2018) Holcomb, C. & Spitkovsky, A. 2018, arXiv e-prints
- Hughes et al. (2014) Hughes, T. M., Baes, M., Fritz, J., et al. 2014, A&A, 565, A4
- Hummel et al. (1991a) Hummel, E., Beck, R., & Dahlem, M. 1991a, A&A, 248, 23
- Hummel et al. (1991b) Hummel, E., Dahlem, M., van der Hulst, J. M., & Sukumar, S. 1991b, A&A, 246, 10
- Hummel et al. (1984) Hummel, E., Sancisi, R., & Ekers, R. D. 1984, A&A, 133, 1
- Ipavich (1975) Ipavich, F. M. 1975, ApJ, 196, 107
- Irwin et al. (2012) Irwin, J., Beck, R., Benjamin, R. A., et al. 2012, AJ, 144, 43
- Irwin et al. (2013) Irwin, J., Krause, M., English, J., et al. 2013, AJ, 146, 164
- Jacob et al. (2018) Jacob, S., Pakmor, R., Simpson, C. M., Springel, V., & Pfrommer, C. 2018, MNRAS, 475, 570
- Jaffe & Perola (1973) Jaffe, W. J. & Perola, G. C. 1973, A&A, 26, 423
- Jubelgas et al. (2008) Jubelgas, M., Springel, V., Enßlin, T., & Pfrommer, C. 2008, A&A, 481, 33
- Kardashev (1962) Kardashev, N. S. 1962, SvA, 6, 317
- Kennicutt et al. (2009) Kennicutt, Jr., R. C., Hao, C.-N., Calzetti, D., et al. 2009, ApJ, 703, 1672
- Klein et al. (1984) Klein, U., Wielebinski, R., & Beck, R. 1984, A&A, 133, 19
- Kormendy & Barentine (2010) Kormendy, J. & Barentine, J. C. 2010, ApJ, 715, L176
- Krause (2009) Krause, M. 2009, in Revista Mexicana de Astronomia y Astrofisica Conference Series, Vol. 36, Revista Mexicana de Astronomia y Astrofisica Conference Series, 25–29
- Krause (2011) Krause, M. 2011, ArXiv e-prints
- Krause et al. (2017) Krause, M., Irwin, J., Wiegert, T., et al. 2017, ArXiv e-prints
- Krause et al. (2018) Krause, M., Irwin, J., Wiegert, T., et al. 2018, A&A, 611, A72
- Kregel & van der Kruit (2005) Kregel, M. & van der Kruit, P. C. 2005, MNRAS, 358, 481
- Kronberg et al. (1999) Kronberg, P. P., Lesch, H., & Hopp, U. 1999, ApJ, 511, 56
- Kroupa (2001) Kroupa, P. 2001, MNRAS, 322, 231
- Kulsrud & Pearce (1969) Kulsrud, R. & Pearce, W. P. 1969, ApJ, 156, 445
- Laine et al. (2010) Laine, S., Appleton, P. N., Gottesman, S. T., Ashby, M. L. N., & Garland, C. A. 2010, AJ, 140, 753
- Lerche & Schlickeiser (1980) Lerche, I. & Schlickeiser, R. 1980, ApJ, 239, 1089
- Lerche & Schlickeiser (1982) Lerche, I. & Schlickeiser, R. 1982, A&A, 107, 148
- Li et al. (2016) Li, J.-T., Beck, R., Dettmar, R.-J., et al. 2016, MNRAS, 456, 1723
- Li & Wang (2013a) Li, J.-T. & Wang, Q. D. 2013a, MNRAS, 428, 2085
- Li & Wang (2013b) Li, J.-T. & Wang, Q. D. 2013b, MNRAS, 435, 3071
- Mac Low & Ferrara (1999) Mac Low, M.-M. & Ferrara, A. 1999, ApJ, 513, 142
- McMullin et al. (2007) McMullin, J. P., Waters, B., Schiebel, D., Young, W., & Golap, K. 2007, in Astronomical Society of the Pacific Conference Series, Vol. 376, Astronomical Data Analysis Software and Systems XVI, ed. R. A. Shaw, F. Hill, & D. J. Bell, 127
- Mulcahy et al. (2016) Mulcahy, D. D., Fletcher, A., Beck, R., Mitra, D., & Scaife, A. M. M. 2016, A&A, 592, A123
- Mulcahy et al. (2018) Mulcahy, D. D., Horneffer, A., Beck, R., et al. 2018, A&A, 615, A98
- Müller et al. (2017) Müller, P., Krause, M., Beck, R., & Schmidt, P. 2017, A&A, 606, A41
- Murphy (2009) Murphy, E. J. 2009, ApJ, 706, 482
- Murphy et al. (2006) Murphy, E. J., Braun, R., Helou, G., et al. 2006, ApJ, 638, 157
- Murphy et al. (2008) Murphy, E. J., Helou, G., Kenney, J. D. P., Armus, L., & Braun, R. 2008, ApJ, 678, 828
- Murphy et al. (2012) Murphy, E. J., Porter, T. A., Moskalenko, I. V., Helou, G., & Strong, A. W. 2012, ApJ, 750, 126
- Neininger et al. (1996) Neininger, N., Guelin, M., Garcia-Burillo, S., Zylka, R., & Wielebinski, R. 1996, A&A, 310, 725
- Niklas et al. (1997) Niklas, S., Klein, U., & Wielebinski, R. 1997, A&A, 322, 19
- Norman & Ikeuchi (1989) Norman, C. A. & Ikeuchi, S. 1989, ApJ, 345, 372
- Oosterloo et al. (2007) Oosterloo, T., Fraternali, F., & Sancisi, R. 2007, AJ, 134, 1019
- Pacholczyk (1970) Pacholczyk, A. G. 1970, Radio astrophysics. Nonthermal processes in galactic and extragalactic sources
- Pakmor et al. (2016) Pakmor, R., Pfrommer, C., Simpson, C. M., & Springel, V. 2016, ApJ, 824, L30
- Pfrommer et al. (2017) Pfrommer, C., Pakmor, R., Schaal, K., Simpson, C. M., & Springel, V. 2017, MNRAS, 465, 4500
- Ptuskin et al. (1997) Ptuskin, V. S., Voelk, H. J., Zirakashvili, V. N., & Breitschwerdt, D. 1997, A&A, 321, 434
- Radburn-Smith et al. (2011) Radburn-Smith, D. J., de Jong, R. S., Seth, A. C., et al. 2011, ApJ, 195, 18
- Rand (1998) Rand, R. J. 1998, ApJ, 501, 137
- Rand et al. (1990) Rand, R. J., Kulkarni, S. R., & Hester, J. J. 1990, ApJ, 352, L1
- Rand et al. (1992) Rand, R. J., Kulkarni, S. R., & Hester, J. J. 1992, ApJ, 396, 97
- Rau & Cornwell (2011) Rau, U. & Cornwell, T. J. 2011, A&A, 532, A71
- Recchia et al. (2016a) Recchia, S., Blasi, P., & Morlino, G. 2016a, MNRAS, 462, 4227
- Recchia et al. (2016b) Recchia, S., Blasi, P., & Morlino, G. 2016b, MNRAS, 462, L88
- Rossa & Dettmar (2003a) Rossa, J. & Dettmar, R.-J. 2003a, A&A, 406, 493
- Rossa & Dettmar (2003b) Rossa, J. & Dettmar, R.-J. 2003b, A&A, 406, 505
- Rupen (1991) Rupen, M. P. 1991, AJ, 102, 48
- Sanders et al. (2003) Sanders, D. B., Mazzarella, J. M., Kim, D.-C., Surace, J. A., & Soifer, B. T. 2003, AJ, 126, 1607
- Schmidt (2016) Schmidt, P. 2016, PhD thesis, Universität Bonn, urn:nbn:de:hbz:5n-44886
- Scoville et al. (1993) Scoville, N. Z., Thakkar, D., Carlstrom, J. E., & Sargent, A. I. 1993, ApJ, 404, L59
- Seta & Beck (2019) Seta, A. & Beck, R. 2019, arXiv e-prints
- Shapiro & Field (1976) Shapiro, P. R. & Field, G. B. 1976, ApJ, 205, 762
- Socrates et al. (2008) Socrates, A., Davis, S. W., & Ramirez-Ruiz, E. 2008, ApJ, 687, 202
- Sofue & Nakai (1994) Sofue, Y. & Nakai, N. 1994, PASJ, 46, 147
- Stein et al. (2019) Stein, Y., Dettmar, R. J., Irwin, J., et al. 2019, A&A, 623, A33
- Strong (1978) Strong, A. W. 1978, A&A, 66, 205
- Strong et al. (2007) Strong, A. W., Moskalenko, I. V., & Ptuskin, V. S. 2007, Annual Review of Nuclear and Particle Science, 57, 285
- Sukumar & Allen (1991) Sukumar, S. & Allen, R. J. 1991, ApJ, 382, 100
- Swaters et al. (1997) Swaters, R. A., Sancisi, R., & van der Hulst, J. M. 1997, ApJ, 491, 140
- Tabatabaei et al. (2007) Tabatabaei, F. S., Beck, R., Krügel, E., et al. 2007, A&A, 475, 133
- Tabatabaei et al. (2013) Tabatabaei, F. S., Schinnerer, E., Murphy, E. J., et al. 2013, A&A, 552, A19
- Uhlig et al. (2012) Uhlig, M., Pfrommer, C., Sharma, M., et al. 2012, MNRAS, 423, 2374
- van der Kruit & Searle (1981) van der Kruit, P. C. & Searle, L. 1981, A&A, 95, 116
- van Gorkom et al. (1986) van Gorkom, J., Rupen, M., Knapp, G., et al. 1986, IAU Circ., 4248
- Vargas et al. (2018) Vargas, C. J., Mora-Partiarroyo, S. C., Schmidt, P., et al. 2018, ApJ, 853, 128
- Whaley et al. (2009) Whaley, C. H., Irwin, J. A., Madden, S. C., Galliano, F., & Bendo, G. J. 2009, MNRAS, 395, 97
- White & Becker (1992) White, R. L. & Becker, R. H. 1992, ApJ, 79, 331
- Wiegert et al. (2015) Wiegert, T., Irwin, J., Miskolczi, A., et al. 2015, AJ, 150, 81
- Yim et al. (2014) Yim, K., Wong, T., Xue, R., et al. 2014, AJ, 148, 127
- Zirakashvili et al. (1996) Zirakashvili, V. N., Breitschwerdt, D., Ptuskin, V. S., & Voelk, H. J. 1996, A&A, 311, 113
- Zschaechner et al. (2012) Zschaechner, L. K., Rand, R. J., Heald, G. H., Gentile, G., & Józsa, G. 2012, ApJ, 760, 37
Appendix A Energy densities
To quantify synchrotron and IC losses in our CRE transport models (see Eq. 6), we need an estimate of the following two quantities: While synchrotron losses depend on the magnetic energy density , is the energy density of the radiation that is relevant for inverse-Compton scattering. The energy density of the interstellar radiation field (IRF), in turn, can be expressed as the sum of the stellar and dust radiation fields, .
can be determined from the total far-infrared luminosity and the radial extent of the galaxy, which we determined in the previous section. We used the values from Sanders et al. (2003) after scaling them for each galaxy by the squared ratio between our assumed distance and the distance these authors used. Moreover, we assumed , as found for the solar neighbourhood (Draine 2011), and thus . With (at redshift 0), we obtain global radiation energy densities of for NGC 891 and for NGC 4565. Using the average equipartition field strengths specified in Sect.8.1 yields and , respectively. Hence, for NGC 891 , and for NGC 4565 , which means that on average synchrotron losses are clearly dominating over IC losses in both galaxies.
Appendix B CRE energy losses
We calculate the combined synchrotron and IC loss rate as (e.g. Heesen et al. 2016)
| (9) |
In addition, ionisation losses occur on a time-scale of (Murphy 2009)
| (10) |
as well as bremsstrahlung losses, the time-scale of which is given by
| (11) |
where is the average particle number density of neutral gas in the ISM, and the CRE energy can be written as . We estimate in both galaxies from the total atomic gas masses given in Table 1, assuming that this amount of gas is distributed in an oblate spheroid of radius as given in Sect. 8.1 and semi-minor axis length corresponding to the H i disc scale height of kpc for NGC 891 (Oosterloo et al. 2007) and kpc for NGC 4565 (Zschaechner et al. 2012). Assuming for simplicity that all atoms are hydrogen nuclei ( g), we find for NCG 891 and for NGC 4565. Further, we use the maximum total magnetic field strengths of G and G, respectively (as determined in Sect. 8.1). In the case of NGC 891, we thus have yr, yr, yr, yr, and yr. For NGC 4565 we obtain yr, yr, yr, yr, and yr. Thus, in both galaxies, ionisation loss rates are at least one order of magnitude lower than those of synchrotron and IC losses, and can hence be neglected. The same is true for bremsstrahlung losses in NGC 891, while in NGC 4565 bremsstrahlung losses may have a minor effect on the spectrum at 1.5 GHz.
Appendix C Radio continuum scale heights
In this appendix, we present the scale heights in the individual strips in both NGC 891 and 4565. In each strip, we have measured scale heights in the thin disc and thick disc (halo), fitting two-component exponential functions to the vertical intensity profiles. Scale heights are presented for both and 6 GHz, separately for the total and non-thermal radio continuum emission. Tables 7 and 8 contain the exponential scale heights of NGC 891 and 4565, respectively. Table 9 contains the Gaussian scale heights of NGC 4565. In each strip, we have measured Gaussian scale heights in the thin disc and thick disc (halo), fitting two-component Gaussian functions to the vertical intensity profiles.
| 1.5 GHz, total | 1.5 GHz, non-thermal | ||||||
| [kpc] | [kpc] | [kpc] | [kpc] | [kpc] | |||
| 0.20 0.03 | 1.47 0.08 | 0.28 | 0.23 0.04 | 1.49 0.09 | 0.24 | ||
| 0.14 0.01 | 1.36 0.03 | 0.13 | 0.15 0.01 | 1.37 0.03 | 0.11 | ||
| 0.18 0.03 | 1.34 0.12 | 4.58 | 0.20 0.04 | 1.35 0.11 | 3.95 | ||
| 0 | 0.14 0.02 | 1.08 0.09 | 11.06 | 0.14 0.03 | 1.09 0.09 | 10.07 | |
| 2.65 | 0.19 0.04 | 1.06 0.09 | 6.45 | 0.21 0.06 | 1.06 0.09 | 5.58 | |
| 5.29 | 0.17 0.02 | 1.35 0.06 | 1.16 | 0.19 0.02 | 1.35 0.05 | 0.86 | |
| 7.94 | 0.17 0.02 | 1.30 0.14 | 0.08 | 0.21 0.03 | 1.31 0.07 | 0.07 | |
| average | 0.17 0.02 | 1.28 0.14 | 0.19 0.03 | 1.29 0.15 | |||
| 6 GHz, total | 6 GHz, non-thermal | ||||||
| [kpc] | [kpc] | [kpc] | [kpc] | [kpc] | |||
| 0.20 0.01 | 1.21 0.09 | 0.25 | 0.33 0.06 | 1.42 0.27 | 0.25 | ||
| 0.14 0.01 | 1.16 0.03 | 0.01 | 0.16 0.01 | 1.19 0.05 | 0.02 | ||
| 0.16 0.01 | 1.05 0.09 | 1.94 | 0.18 0.02 | 1.07 0.08 | 1.54 | ||
| 0 | 0.13 0.01 | 0.88 0.09 | 11.69 | 0.14 0.02 | 0.90 0.09 | 10.39 | |
| 2.65 | 0.25 0.04 | 1.08 0.29 | 4.77 | 0.25 0.05 | 0.94 0.18 | 4.34 | |
| 5.29 | 0.17 0.01 | 1.17 0.05 | 0.28 | 0.20 0.01 | 1.17 0.05 | 0.33 | |
| 7.94 | 0.15 0.01 | 1.05 0.09 | 0.15 | 0.17 0.04 | 1.06 0.12 | 0.17 | |
| average | 0.17 0.04 | 1.09 0.10 | 0.20 0.06 | 1.11 0.16 | |||
| 1.5 GHz, total | 1.5 GHz, non-thermal | ||||||
| [kpc] | [kpc] | [kpc] | [kpc] | [kpc] | |||
| 0.02 0.01 | 1.50 0.16 | 0.13 | 0.02 0.11 | 1.35 0.12 | 0.09 | ||
| 0.02 0.01 | 1.70 0.21 | 0.29 | 0.02 0.09 | 1.41 0.08 | 0.21 | ||
| 0 | 0.03 0.13⋆ | 1.41 0.13⋆ | 0.18 | 0.18 0.11⋆ | 1.30 0.15⋆ | 0.16 | |
| 6.92 | 0.02 0.01 | 1.70 0.22 | 0.52 | 0.02 0.09 | 1.34 0.11 | 0.19 | |
| 13.85 | 0.02 0.01 | 1.36 0.21 | 0.16 | 0.02 0.01 | 1.19 0.11 | 0.12 | |
| average | 0.02 0.01 | 1.60 0.17 | 0.05 0.07 | 1.35 0.06 | |||
| 6 GHz, total | 6 GHz, non-thermal | ||||||
| [kpc] | [kpc] | [kpc] | [kpc] | [kpc] | |||
| 0.02 0.010 | 2.13 0.40 | 0.21 | 0.53 0.09 | 4.70 1.30 | 0.13 | ||
| 0.04 0.20 | 0.92 0.16 | 0.24 | 0.57 0.16 | 1.10 0.28 | 0.22 | ||
| 0 | 0.32 0.10⋆ | 1.64 0.41⋆ | 0.23 | 0.52 0.06⋆ | 0.95 0.30⋆ | 0.26 | |
| 6.92 | 0.02 0.04⋆ | 1.53 0.29⋆ | 0.51 | 0.02 0.32 | 0.95 0.18 | 0.25 | |
| 13.85 | 0.02 0.08 | 2.47 1.07 | 0.23 | 0.40 0.12 | 3.30 0.96 | 0.22 | |
| average | 0.08 0.13 | 1.36 0.39 | 0.41 0.20 | 1.00 0.09 | |||
Notes. Only the inner three strips were used to compute the scale heights of the halo emission.
⋆Average values of the separately determined scale heights on the northern and southern side of the mid-plane.
| 1.5 GHz, total | 1.5 GHz, non-thermal | ||||||
| [kpc] | [kpc] | [kpc] | [kpc] | [kpc] | |||
| 0.01 0.01 | 2.76 0.42 | 0.13 | 0.02 0.01 | 2.50 0.09 | 0.08 | ||
| 0.02 0.01 | 3.05 0.21 | 0.18 | 0.02 0.16 | 2.65 0.12 | 0.13 | ||
| 0 | 0.29 0.10 | 2.87 0.22 | 0.13 | 0.58 0.06 | 2.95 0.16 | 0.10 | |
| 6.92 | 0.01 0.02 | 3.34 0.80 | 0.59 | 0.02 0.02 | 2.59 0.29 | 0.26 | |
| 13.85 | 0.03 0.01 | 2.84 0.40 | 0.16 | 0.67 0.13 | 3.30 0.59 | 0.12 | |
| average | 0.07 0.11 | 2.97 0.21 | 0.26 0.30 | 2.80 0.29 | |||
| 6 GHz, total | 6 GHz, non-thermal | ||||||
| [kpc] | [kpc] | [kpc] | [kpc] | [kpc] | |||
| 0.02 0.27 | 4.56 0.64 | 0.16 | 0.70 0.07 | 6.16 1.24 | 0.06 | ||
| 0.13 0.10 | 1.71 0.38 | 0.12 | 1.03 0.10 | 5.50 1.13 | 0.16 | ||
| 0 | 0.59 0.07 | 3.35 1.06 | 0.24 | 1.06 0.15 | 1.13 0.21 | 0.23 | |
| 6.92 | 0.20 0.12⋆ | 2.73 0.19⋆ | 0.09 | 0.28 0.23⋆ | 2.13 0.36⋆ | 0.03 | |
| 13.85 | 0.02 0.15 | 7.39 2.82 | 0.17 | 0.57 0.14 | 9.61 1.54 | 0.16 | |
| average | 0.19 0.21 | 3.95 1.95 | 0.73 0.29 | 4.92 3.03 | |||
Notes.
⋆ Average values of the separately determined scale heights on the northern and southern side of the mid-plane.
Appendix D CR transport models
D.1 NGC 891
In this appendix, we present the best-fitting advection and diffusion cosmic-ray transport models in the individual strips in NGC 891. In Table 10, the best-fitting parameters are presented for a constant advection speed; the corresponding best-fitting intensity and spectral index profiles are presented in Fig. 17. In Table 11 we present the best-fitting parameters for advection with a linearly accelerating advection velocity; the corresponding best-fitting intensity and spectral index profiles are presented in Fig. 12. In Table 12 we present the best-fitting parameters for diffusion with an energy dependent diffusion coefficient assuming ; the corresponding best-fitting intensity and spectral index profiles are presented in Fig. 18.
D.2 NGC 4565
In this appendix, we present the best-fitting advection and diffusion cosmic-ray transport models in the individual strips in NGC 4565. In Table 13, the best-fitting parameters are presented for a constant advection speed; the corresponding best-fitting intensity and spectral index profiles are presented in Fig. 19. In Table 14 we present the best-fitting parameters for advection with a linearly accelerating advection velocity; the corresponding best-fitting intensity and spectral index profiles are presented in Fig. 20. In Table 15 we present the best-fitting parameters for diffusion with an energy dependent diffusion coefficient assuming ; the corresponding best-fitting intensity and spectral index profiles are presented in Fig. 21. In Table 16 we present the best-fitting parameters for diffusion with an energy dependent diffusion coefficient assuming ; the corresponding best-fitting intensity and spectral index profiles are presented in Fig. 22. In Table 17 we present the best-fitting parameters for diffusion with an energy independent diffusion coefficient; the corresponding best-fitting intensity and spectral index profiles are presented in Fig. 13.
| [kpc] | [] | [G] | [kpc] | [kpc] | |||
|---|---|---|---|---|---|---|---|
| N | 110 | 9.0 | 0.30 | 0.34 | 5.0 | 0.83 | 1.22 |
| S | 150 | 9.0 | 0.30 | 0.34 | 4.1 | 0.68 | 0.41 |
| N | 160 | 11.2 | 0.20 | 0.35 | 3.4 | 0.62 | 0.30 |
| S | 210 | 11.2 | 0.20 | 0.35 | 3.2 | 0.58 | 0.26 |
| N | 160 | 12.0 | 0.30 | 0.39 | 3.7 | 0.69 | 1.00 |
| S | 170 | 12.0 | 0.30 | 0.39 | 3.6 | 0.67 | 0.16 |
| 0 N | 140 | 13.2 | 0.20 | 0.38 | 2.7 | 0.61 | 0.29 |
| 0 S | 140 | 13.2 | 0.20 | 0.38 | 2.7 | 0.61 | 1.14 |
| 2.65 N | 150 | 11.5 | 0.30 | 0.37 | 2.7 | 0.64 | 0.07 |
| 2.65 S | 170 | 11.5 | 0.30 | 0.37 | 2.6 | 0.62 | 1.30 |
| 5.29 N | 140 | 10.1 | 0.25 | 0.35 | 3.5 | 0.65 | 0.18 |
| 5.29 S | 170 | 10.1 | 0.25 | 0.35 | 3.2 | 0.59 | 1.36 |
| 7.94 N | 130 | 9.3 | 0.25 | 0.31 | 3.3 | 0.63 | 0.36 |
| 7.94 S | 140 | 9.3 | 0.25 | 0.31 | 3.2 | 0.62 | 1.36 |
Notes. ”N” denotes north of the mid-plane, ”S” denotes south of the mid-plane; : advection speed; : mid-plane magnetic field strength; : scale height of the disc magnetic field; : scale height of the halo magnetic field; : scale height of the disc or halo magnetic field if energy equipartition is assumed; : reduced of the fit to the intensity profile; : reduced of the fit to the spectral index profile.
| [kpc] | [] | [G] | [kpc] | () [kpc] | [kpc] | [kpc] | ||
|---|---|---|---|---|---|---|---|---|
| N | 110 | 9.0 | 0.30 | 0.34 | 6.0 | 20.0 | 58.0 | 1.20 |
| S | 150 | 9.0 | 0.30 | 0.34 | 6.0 | 9.6 | 17.9 | 0.44 |
| N | 150 | 11.2 | 0.20 | 0.35 | 5.5 | 6.6 | 14.3 | 0.28 |
| S | 210 | 11.2 | 0.20 | 0.35 | 5.5 | 4.7 | 5.9 | 0.28 |
| N | 150 | 12.0 | 0.30 | 0.39 | 5.4 | 9.9 | 25.9 | 0.84 |
| S | 160 | 12.0 | 0.30 | 0.39 | 5.4 | 9.0 | 21.6 | 0.19 |
| 0 N | 130 | 13.2 | 0.20 | 0.38 | 4.4 | 4.9 | 15.6 | 0.29 |
| 0 S | 140 | 13.2 | 0.20 | 0.38 | 4.4 | 4.6 | 13.2 | 1.21 |
| 2.65 N | 150 | 11.5 | 0.30 | 0.37 | 4.2 | 5.2 | 13.6 | 0.09 |
| 2.65 S | 170 | 11.5 | 0.30 | 0.37 | 4.2 | 4.6 | 10.1 | 1.26 |
| 5.29 N | 140 | 10.1 | 0.25 | 0.35 | 5.4 | 6.8 | 16.3 | 0.12 |
| 5.29 S | 180 | 10.1 | 0.25 | 0.35 | 5.4 | 5.4 | 8.9 | 1.20 |
| 7.94 N | 120 | 9.3 | 0.25 | 0.31 | 5.2 | 6.6 | 17.0 | 0.30 |
| 7.94 S | 150 | 9.3 | 0.25 | 0.31 | 5.2 | 5.2 | 9.7 | 1.20 |
Notes. ”N” denotes north of the mid-plane, ”S” denotes south of the mid-plane; : initial advection speed in the mid-plane; : mid-plane magnetic field strength; : scale height of the disc magnetic field; : scale height of the halo magnetic field; : scale height of the disc or halo magnetic field if energy equipartition is assumed; : height where ; : height where ; : reduced of the fit to the intensity profile; : reduced of the fit to the spectral index profile.
| [kpc] | [] | [G] | [kpc] | [kpc] | |||
|---|---|---|---|---|---|---|---|
| N | 2.5 | 9.0 | 0.40 | 0.43 | 8.0 | 1.33 | 1.35 |
| S | 2.0 | 9.0 | 0.40 | 0.43 | 8.7 | 1.45 | 0.84 |
| N | 2.0 | 11.2 | 0.25 | 0.42 | 6.0 | 1.09 | 2.49 |
| S | 2.5 | 11.2 | 0.25 | 0.42 | 5.2 | 0.95 | 1.03 |
| N | 2.5 | 12.0 | 0.25 | 0.31 | 4.6 | 0.85 | 2.86 |
| S | 2.5 | 12.0 | 0.25 | 0.31 | 4.6 | 0.85 | 1.06 |
| 0 N | 2.5 | 13.2 | 0.20 | 0.36 | 3.7 | 0.84 | 0.31 |
| 0 S | 1.5 | 13.2 | 0.20 | 0.36 | 3.8 | 0.86 | 3.63 |
| 2.65 N | 2.0 | 11.5 | 0.35 | 0.42 | 4.8 | 1.14 | 0.59 |
| 2.65 S | 2.5 | 11.5 | 0.35 | 0.42 | 4.0 | 0.95 | 2.15 |
| 5.29 N | 2.0 | 10.1 | 0.30 | 0.39 | 6.1 | 1.13 | 0.63 |
| 5.29 S | 3.5 | 10.1 | 0.30 | 0.39 | 3.9 | 0.72 | 1.43 |
| 7.94 N | 2.0 | 9.3 | 0.35 | 0.42 | 5.8 | 1.12 | 0.55 |
| 7.94 S | 2.5 | 9.3 | 0.35 | 0.42 | 5.1 | 0.98 | 1.54 |
Notes. ”N” denotes north of the mid-plane, ”S” denotes south of the mid-plane; : diffusion coefficient []; : mid-plane magnetic field strength; : scale height of the disc magnetic field; : scale height of the halo magnetic field; : scale height of the disc or halo magnetic field if energy equipartition is assumed; : reduced of the fit to the intensity profile; : reduced of the fit to the spectral index profile.
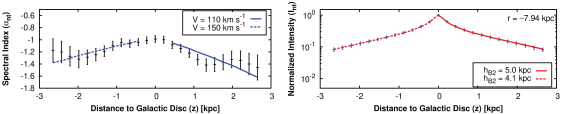
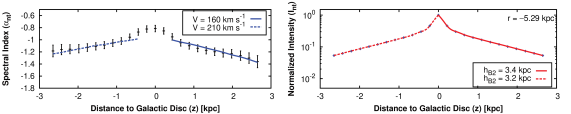
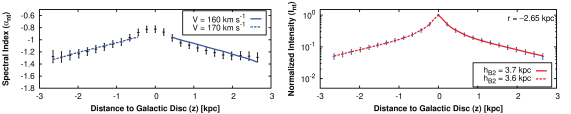
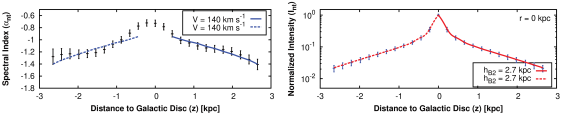
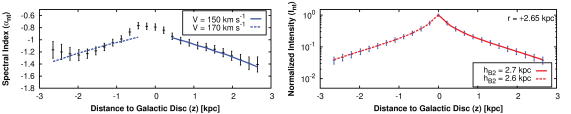
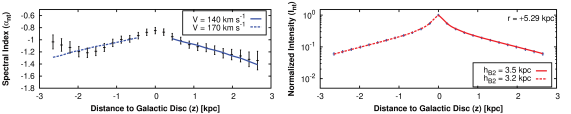
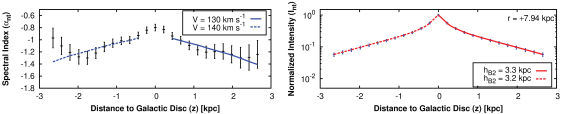
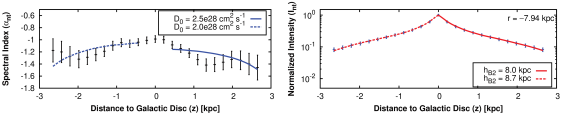
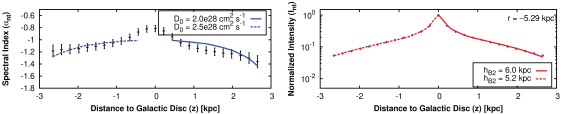
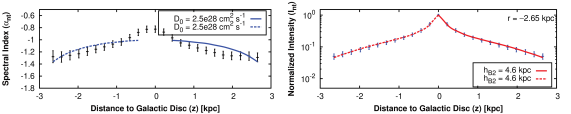
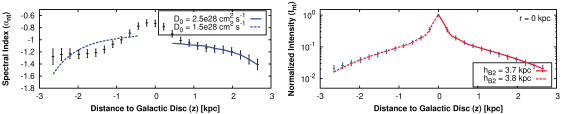
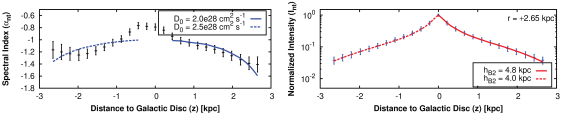
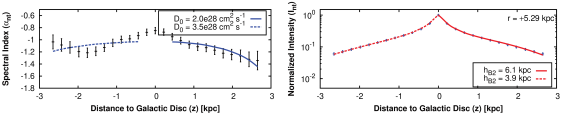
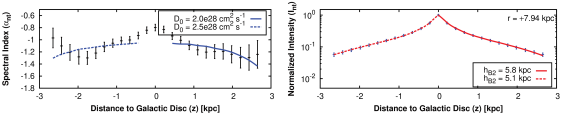
| [kpc] | [] | [G] | [kpc] | ||
|---|---|---|---|---|---|
| N | 100 | 5.5 | 3.4 | 0.61 | 0.05 |
| S | 120 | 5.5 | 3.2 | 0.57 | 0.06 |
| N | 80 | 6.4 | 4.2 | 0.72 | 0.46 |
| S | 80 | 6.4 | 4.2 | 0.72 | 0.17 |
| 0 N | 120 | 6.3 | 3.6 | 0.67 | 0.07 |
| 0 S | 110 | 6.3 | 3.7 | 0.69 | 0.20 |
| 6.92 N | 280 | 6.5 | 3.1 | 0.55 | 0.08 |
| 6.92 S | 80 | 6.5 | 4.4 | 0.79 | 0.05 |
| 13.85 N | 70 | 5.2 | 3.0 | 0.61 | 0.31 |
| 13.85 S | 90 | 5.2 | 3.1 | 0.63 | 0.41 |
Notes. ”N” denotes north of the mid-plane, ”S” denotes south of the mid-plane; : advection speed; : mid-plane magnetic field strength; : scale height of the disc magnetic field; : scale height of the halo magnetic field; : scale height of the disc or halo magnetic field if energy equipartition is assumed; : reduced of the fit to the intensity profile; : reduced of the fit to the spectral index profile.
| [kpc] | [] | [G] | () [kpc] | [kpc] | [kpc] | |
|---|---|---|---|---|---|---|
| N | 90 | 5.5 | 5.6 | 6.4 | 24.7 | 0.05 |
| S | 100 | 5.5 | 5.6 | 5.7 | 19.2 | 0.07 |
| N | 80 | 6.4 | 5.8 | 10.0 | 55.5 | 0.42 |
| S | 80 | 6.4 | 5.8 | 10.0 | 55.5 | 0.09 |
| 0 N | 120 | 6.3 | 5.4 | 6.9 | 23.2 | 0.09 |
| 0 S | 100 | 6.3 | 5.4 | 9.2 | 39.0 | 0.22 |
| 6.92 N | 280 | 6.5 | 5.6 | 4.4 | 3.8 | 0.11 |
| 6.92 S | 80 | 6.5 | 5.6 | 13.7 | 76.0 | 0.05 |
| 13.85 N | 70 | 5.2 | 4.9 | 4.7 | 24.7 | 0.27 |
| 13.85 S | 80 | 5.2 | 4.9 | 6.6 | 29.5 | 0.40 |
Notes. ”N” denotes north of the mid-plane, ”S” denotes south of the mid-plane; : initial advection speed in the mid-plane; : mid-plane magnetic field strength; : scale height of the disc magnetic field; : scale height of the halo magnetic field; : scale height of the disc or halo magnetic field if energy equipartition is assumed; : height where ; : height where ; : reduced of the fit to the intensity profile; : reduced of the fit to the spectral index profile.
| [kpc] | [] | [G] | [kpc] | ||
|---|---|---|---|---|---|
| N | 1.5 | 5.5 | 10 | 1.96 | 0.40 |
| S | 1.5 | 5.5 | 10 | 1.96 | 0.48 |
| N | 2.0 | 6.4 | 20 | 3.70 | 1.43 |
| S | 2.0 | 6.4 | 20 | 3.70 | 1.25 |
| 0 N | 3.0 | 6.3 | 18 | 3.00 | 0.32 |
| 0 S | 3.0 | 6.3 | 18 | 3.00 | 0.59 |
| 6.92 N | 2.0 | 6.5 | 17 | 3.21 | 0.22 |
| 6.92 S | 2.0 | 6.5 | 16 | 3.02 | 0.83 |
| 13.85 N | 2.0 | 5.2 | 25 | 3.73 | 0.49 |
| 13.85 S | 2.0 | 5.2 | 25 | 3.73 | 0.72 |
Notes. ”N” denotes north of the mid-plane, ”S” denotes south of the mid-plane; : diffusion coefficient []; : mid-plane magnetic field strength; : scale height of the disc magnetic field; : scale height of the halo magnetic field; : scale height of the disc or halo magnetic field if energy equipartition is assumed; : reduced of the fit to the intensity profile; : reduced of the fit to the spectral index profile.
| [kpc] | [] | [G] | [kpc] | ||
|---|---|---|---|---|---|
| N | 1.5 | 5.5 | 27 | 5.29 | 0.13 |
| S | 2.5 | 5.5 | 9 | 1.76 | 0.60 |
| N | 3.0 | 6.4 | 16 | 2.96 | 0.74 |
| S | 3.0 | 6.4 | 16 | 2.96 | 0.57 |
| 0 N | 4.0 | 6.3 | 21 | 3.50 | 0.23 |
| 0 S | 4.0 | 6.3 | 21 | 3.50 | 0.41 |
| 6.92 N | 3.5 | 6.5 | 11 | 2.08 | 0.35 |
| 6.92 S | 2.5 | 6.5 | 25 | 4.72 | 0.48 |
| 13.85 N | 2.5 | 5.2 | 32 | 4.78 | 0.35 |
| 13.85 S | 2.5 | 5.2 | 32 | 4.78 | 0.69 |
Notes. ”N” denotes north of the mid-plane, ”S” denotes south of the mid-plane; : diffusion coefficient []; : mid-plane magnetic field strength; : scale height of the disc magnetic field; : scale height of the halo magnetic field; : scale height of the disc or halo magnetic field if energy equipartition is assumed; : reduced of the fit to the intensity profile; : reduced of the fit to the spectral index profile.
| [kpc] | [] | [G] | [kpc] | ||
|---|---|---|---|---|---|
| N | 2.5 | 5.5 | 27 | 5.29 | 0.06 |
| S | 3.5 | 5.5 | 12 | 2.35 | 0.58 |
| N | 4.5 | 6.4 | 19 | 3.52 | 0.67 |
| S | 4.5 | 6.4 | 19 | 3.52 | 0.65 |
| 0 N | 5.5 | 6.3 | 34 | 5.67 | 0.59 |
| 0 S | 5.5 | 6.3 | 34 | 5.67 | 0.28 |
| 6.92 N | 8.0 | 6.5 | 8 | 1.51 | 0.58 |
| 6.92 S | 4.0 | 6.5 | 24 | 4.53 | 0.17 |
| 13.85 N | 4.5 | 5.2 | 28 | 4.18 | 0.29 |
| 13.85 S | 4.5 | 5.2 | 29 | 4.33 | 0.67 |
Notes. ”N” denotes north of the mid-plane, ”S” denotes south of the mid-plane; : diffusion coefficient []; : mid-plane magnetic field strength; : scale height of the disc magnetic field; : scale height of the halo magnetic field; : scale height of the disc or halo magnetic field if energy equipartition is assumed; : reduced of the fit to the intensity profile; : reduced of the fit to the spectral index profile.