External photoevaporation of circumstellar disks constrains the timescale for planet formation
Abstract
Planet-forming circumstellar disks are a fundamental part of the star formation process. Since stars form in a hierarchical fashion in groups of up to hundreds or thousands, the UV radiation environment that these disks are exposed to can vary in strength by at least six orders of magnitude. This radiation can limit the masses and sizes of the disks. Diversity in star forming environments can have long lasting effects in disk evolution and in the resulting planetary populations. We perform simulations to explore the evolution of circumstellar disks in young star clusters. We include viscous evolution, as well as the impact of dynamical encounters and external photoevaporation. We find that photoevaporation is an important process in destroying circumstellar disks: in regions of stellar density around of disks are destroyed before of cluster evolution. In regions of around of disks are destroyed in the same timescale. Our findings are in agreement with observed disk fractions in young star forming regions and support previous estimations that planet formation must start in timescales .
keywords:
protoplanetary disks – stars: planetary systems – stars: kinematics and dynamics – planets and satellites: formation – methods: numerical1 Introduction
Circumstellar disks develop as a result of the star formation process (Williams & Cieza, 2011). Since a non negligible fraction of stars are not born in isolation (Bressert et al., 2010; King et al., 2012), and gas left over from the star formation process can linger for a few Myr (Portegies Zwart et al., 2010), during their first stages of evolution the disks remain embedded in an environment that is dense in gas and neighbouring stars. These conditions can be hostile for the disks in a myriad of ways: they can be subject to dynamical truncations (Vincke et al., 2015; Portegies Zwart, 2016; Vincke & Pfalzner, 2016) or be affected by processes related to stellar evolution, such as stellar winds (Pelupessy & Portegies Zwart, 2012), supernovae explosions (Close & Pittard, 2017; Portegies Zwart et al., 2018), and photoevaporation due to bright OB stars in the vicinity (e.g. Guarcello et al., 2016; Haworth et al., 2017). The surrounding gas can also shrink the disks through ram pressure stripping (Wijnen et al., 2016, 2017). Since planet formation related processes seem to start very quickly in circumstellar disks (, Najita & Kenyon (2014); Manara et al. (2018)), understanding the mechanisms that affect disk evolution is directly connected to understanding planetary system formation and survival. The Sun was probably born within a star cluster (Portegies Zwart et al., 2009), so discerning how the cluster environment affects the evolution of the disks can help us comprehend the origins of the Solar System.
There are several observational indications that the environment of circumstellar disks shortly after their formation is unfavorable for their survival. Disks have been observed to be evaporating in several young star forming regions (e.g. Fang et al., 2012; de Juan Ovelar et al., 2012; Mann et al., 2014; Kim et al., 2016; van Terwisga et al., 2019). Moreover, observations indicate that disk fractions decline in regions close to an O-type star (e.g. Balog et al., 2007; Guarcello et al., 2007, 2009, 2010; Fang et al., 2012; Mann et al., 2014; Guarcello et al., 2016). Fatuzzo & Adams (2008) estimate an FUV radiation field of up to in star clusters of stars111 is the FUV field measured in units of the Habing flux, (Habing, 1968)., while Facchini et al. (2016) show that disks of radius are subject to photoevaporation even in very low FUV fields (). In regions of high stellar density, nearby stars can also affect disk size and morphology by dynamical interactions. Observational evidence of the imprints of dynamical truncations has been reported in several nearby stellar clusters (Olczak et al., 2008; Reche et al., 2009; de Juan Ovelar et al., 2012). Tidal stripping that can be explained by disk-star interactions has been observed in the RW Aurigae system (Cabrit et al., 2006; Rodriguez et al., 2018; Dai et al., 2015) and in the T Tauri binary system AS 205 (Salyk et al., 2014). There is also evidence that the Solar System might have been affected by a close encounter with another star during its early stages (Jílková et al., 2015; Pfalzner et al., 2018).
Circumstellar disks are not only affected by external processes, but also by their internal viscous evolution. The combination of outwardly decreasing angular velocity together with outwardly increasing angular momentum causes shear stress forces inside the disks. As a consequence mass is accreted from the innermost regions of the disk onto its host star, whereas the outermost regions expand (Lynden-Bell & Pringle, 1974). Tazzari et al. (2017) propose that the measured offsets in sizes and masses of disks in the Lupus clouds versus disks in the Taurus-Auriga and Ophiuchus regions can be explained as observational evidence of viscous spreading. However Rosotti et al. (2019) argue that current surveys do not yet have the sufficient sensitivity to properly detect this phenomenon.
Different approaches have been implemented to study the effects of these processes on the lifetime of circumstellar disks. External photoevaporation has been modeled with radiation hydrodynamics codes that solve flow equations through the disk boundaries, together with photodissociation region codes to obtain the temperature profiles of the disks (e.g. Haworth et al., 2016; Facchini et al., 2016). This method has been coupled with -disk models to account for viscous evolution of the disk (e.g. Adams et al., 2004; Anderson et al., 2013; Gorti et al., 2015; Rosotti et al., 2017). Haworth et al. (2018a) introduce the concept of pre-computing photevaporation mass losses in terms of the surface density of the disks, an approach that we expand on in section 2.3. Winter et al. (2019a) model the environment of Cygnus OB2 and use the photoevaporation mass loss rate to constrain the timescale for gas expulsion in the young star forming region. Nicholson et al. (2019) perform simulations of star forming regions where FUV photoevaporation is implemented in post-processing, and find a very short lifetime for the disks () in moderate and low density regions ().
Regarding dynamical effects, close encounters on a single N-body disk of test particles have been investigated in several studies (e.g. Breslau et al., 2014; Jílková et al., 2016; Bhandare et al., 2016; Pfalzner et al., 2018). Winter et al. (2018a); Winter et al. (2018b) use a ring of test particles around a star to obtain linearized expressions of the effect that a stellar encounter can have on the mass and morphology of the disk, and then use them to simulate the disk using a smoothed particles hydrodynamics (SPH) code. A different approach for studying these effects is evolving the stellar dynamics of the cluster separately, and applying the effects of dynamical encounters afterwards (e.g. Olczak et al., 2006, 2010; Malmberg et al., 2011; Steinhausen & Pfalzner, 2014; Vincke et al., 2015; Vincke & Pfalzner, 2016, 2018). Directly adding SPH disks to a simulation of a massive star cluster is computationally expensive, since a high resolution is needed over long time scales. The closest effort corresponds to the work by Rosotti et al. (2014), in which individual SPH codes are coupled to half of the stars in a cluster with 100 stars. This allows them to study the effects of viscous spreading of the disks and dynamical truncations in a self-consistent way, but they are limited by the computational resources needed for this problem. Parametrized approaches have also been developed, where the cluster dynamics and effects of truncations (Portegies Zwart, 2016) and viscous spreading (Concha-Ramírez et al., 2019) are considered simultaneously.
Concha-Ramírez et al. (2019) investigate the effect of viscous growth and dynamical truncations on the final sizes and masses of protoplanetary disks inside stars clusters using a parametrized model for the disks. They show that viscous evolution and dynamical encounters are unable to explain the compact disks observed in star forming regions. They argue that other processes must affect the early evolution of the disks. Here we expand the model by improving the description of the viscous disks and by adding external photoevaporation due to the presence of bright nearby stars.
We model the circumstellar disks using the Viscous Accretion Disk Evolution Resource (VADER) (Krumholz & Forbes, 2015). This code solves the equations of angular momentum and mass transport in a thin, axisymmetric disk. Dynamical truncations are parametrized, and the mass loss due to external photevaporation is calculated using the Far-ultraviolet Radiation Induced Evaporation of Discs (FRIED) grid (Haworth et al., 2018b). This grid consists of pre-calculated mass loss rates for disks of different sizes and masses, immersed in several different external FUV fields. We use the Astrophysical Multipurpose Software Environment (AMUSE222http://amusecode.github.io/, Portegies Zwart & McMillan, 2018) framework to couple these codes along with cluster dynamics and stellar evolution. All the code developed for the simulations, data analyses, and figures of this paper is available in Github333https://github.com/franciscaconcha/arXiv1907.03760.
2 Model
2.1 Viscous growth of circumstellar disks
We implement circumstellar disks using the Viscous Accretion Disk Evolution Resource (VADER) by Krumholz & Forbes (2015). VADER is an open source viscous evolution code which uses finite-volume discretization to solve the equations of mass transport, angular momentum, and internal energy in a thin, axisymmetric disk. An AMUSE interface for VADER was developed in the context of this work and is available online.
For the initial disk column density we use the standard disk profile introduced by Lynden-Bell & Pringle (1974):
| (1) |
with
| (2) |
where is the characteristic radius of the disk, and are the initial radius and mass of the disk, respectively, and is a normalization constant. Considering (Anderson et al., 2013), the density profile of the disk is:
| (3) |
This expression allows the disk to expand freely at the outer boundary while keeping the condition of zero torque at the inner boundary .
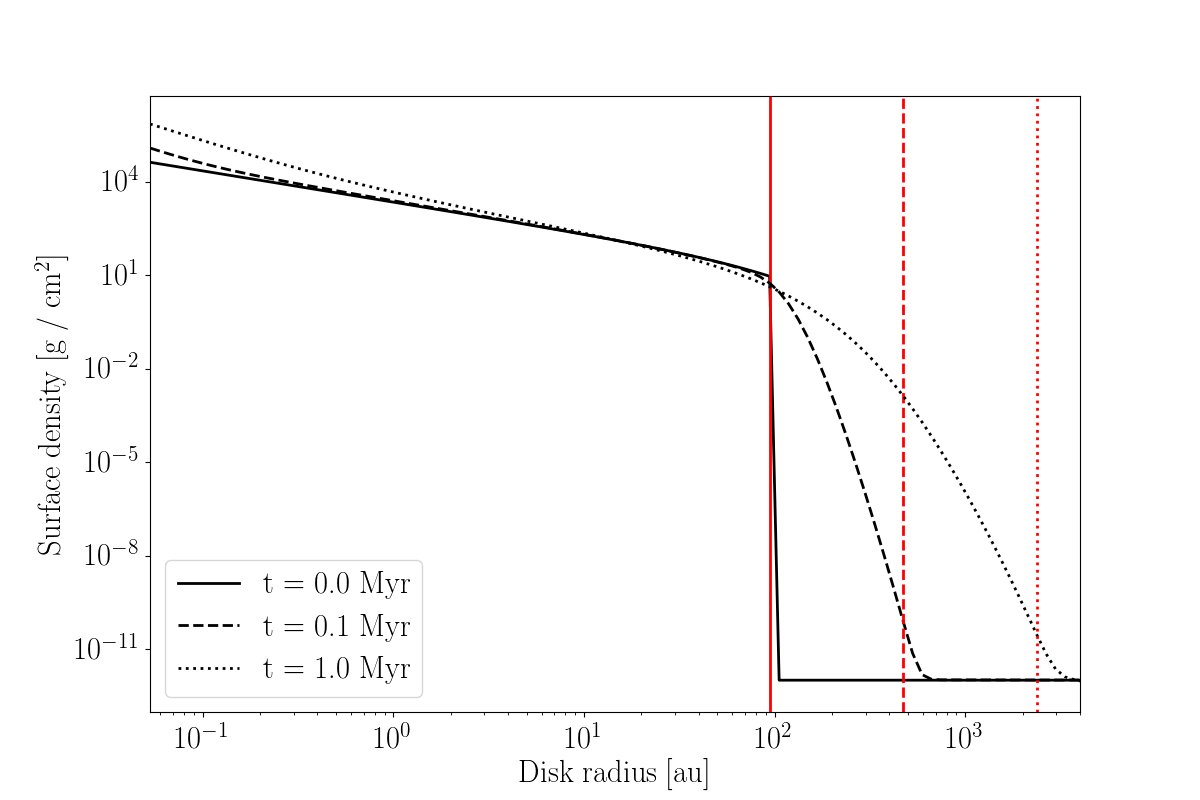
To establish the radius of the disks we set the column density outside to a negligible value . The FRIED grid that we use to calculate the photoevaporation mass loss (see section 2.3.2) is a function of disk radius and outer surface density. There is a numerical challenge in determining what the disk outer surface density and radius actually are, since there is a large gradient in it down to the value. Computing a mass loss rate for a very low outer surface density in this steep gradient would return an artificially low result. Considering this we define the disk radius as the position of the first cell next to , as shown in Figure 1.
The temperature profile of the disks is given by
| (4) |
where is the midplane temperature at . Based on Anderson et al. (2013) we adopt .
Each disk is composed of a grid of 50 logarithmically spaced cells, in a range between and . In Appendix A we show that the resolution is enough for our calculations. The disks have a Keplerian rotation profile and turbulence parameter . The fact that the outer radius of the grid is much larger than the disk sizes (which were initially around , see section 2.4.1) allows the disks to expand freely without reaching the boundaries of the grid. The mass flow through the outer boundary is set to zero in order to maintain the density needed to define the disk radius. The mass flow through the inner boundary is considered as accreted mass and added to the mass of the host star.
2.2 Dynamical truncations
A close encounter between disks induces a discontinuity in their evolution. To modify the disks we calculate parametrized truncation radii. For two stars of the same mass, Rosotti et al. (2014) approximated the truncation radius to a third of the encounter distance. Together with the mass dependence from Bhandare et al. (2016), the dynamical truncation radius takes the form:
| (5) |
where and are the masses of the encountering stars.
To implement truncations we first calculate the corresponding truncation radius caused by the encounter, according to equation 5. We consider all the mass outside this radius to be stripped from the disk. To define as the new disk radius we change the column density of all the disk cells outside to the edge value .
2.3 External photoevaporation
A circumstellar disk can be evaporated by radiation coming from its host star or from a bright star in the vicinity. The heating of the disk surface can lead to the formation of gaps at different locations, which can cause the progression to a transition disk (e.g. Clarke et al., 2001; Gorti et al., 2009). The radiation can also truncate the disk by removing material from the outer, loosely-bound regions (e.g. Adams et al., 2004).
Models of internal photoevaporation have shown that most of the mass loss in this case occurs in the inner of the disk (Font et al., 2004; Owen et al., 2010). Radiation from the host star can evaporate material from the outskirts of the disk, however Owen et al. (2010) show that more than 50% of the total mass loss occurs in the region. In Font et al. (2004) around 90% of the mass loss occurs within the inner of the disk. Given that the mass loss rate from the outer disk is typically comparable to or larger than that from the inner disk, we expect external photoevaporation to dominate in the outer regions. External photoevaporation has been shown to be more effective in evaporating the disks than radiation from the host star (e.g. Johnstone et al., 1998; Adams & Myers, 2001). Truncation by external photoevaporation can also result in changes of the viscosity parameter , which further affects the viscous evolution of the disks (Rosotti et al., 2017). In this work we ignore the effects of photoevaporation on internal disk structure, and deal exclusively with disk survival rates. Because of this and the discussion above we focus on external photoevaporation due to bright stars in the vicinity.
OB-type stars emit heating radiation in the form of extreme-ultraviolet (EUV), far-ultraviolet (FUV), and X-rays. In the case of external photoevaporation the dispersal of disk material is dominated by the FUV photons (Armitage, 2000; Adams et al., 2004; Gorti & Hollenbach, 2009). The main part of our work deals with photoevaporation due to FUV photons; in addition we also incorporate the effect of EUV photons (see Eq. 7).
The amount of mass lost from the disks as a result of external photoevaporation depends on the luminosity of the bright stars in the cluster. This luminosity, together with the distance from each of the massive stars to the disks, is used to obtain the amount of radiation received by each disk. We can then calculate the amount of mass lost. Below we explain what we consider to be massive stars and how we calculate the mass loss rate.
2.3.1 FUV luminosities
We follow Adams et al. (2004) in defining the FUV band ranging from 6 eV up to 13.6 eV, or approximately from 912 to 2070 . We calculate the FUV radiation of the stars in the simulations based on their spectral types. Given the presence of spectral lines in this band, we use synthetic stellar spectra rather than relying on black body approximations. The spectral library used is UVBLUE (Rodriguez-Merino et al., 2005), chosen for its high coverage of parameter space and high resolution, spanning the appropriate wavelength ranges. It spans a three dimensional parameter space of stellar temperature, metallicity, and surface gravity.
We use the UVBLUE spectral library to precompute a relation between stellar mass and FUV luminosity. We do this by considering all the stars in the cluster to have solar metallicity (). We then select the temperature and surface gravity spectra closer to the zero age main sequence value of each star, according to the parametrized stellar evolution code SeBa (Portegies Zwart & Verbunt, 1996; Toonen et al., 2012). Given that the masses and radii of the stars are known, using the chosen spectra we build a relationship between stellar mass and FUV luminosity. This relation takes the shape of a segmented power law, as is shown in Figure 2. A similar fit was obtained by Parravano et al. (2003). In runtime the stars are subject to stellar evolution and the FUV luminosity for each star was calculated directly from this fit using the stellar mass.
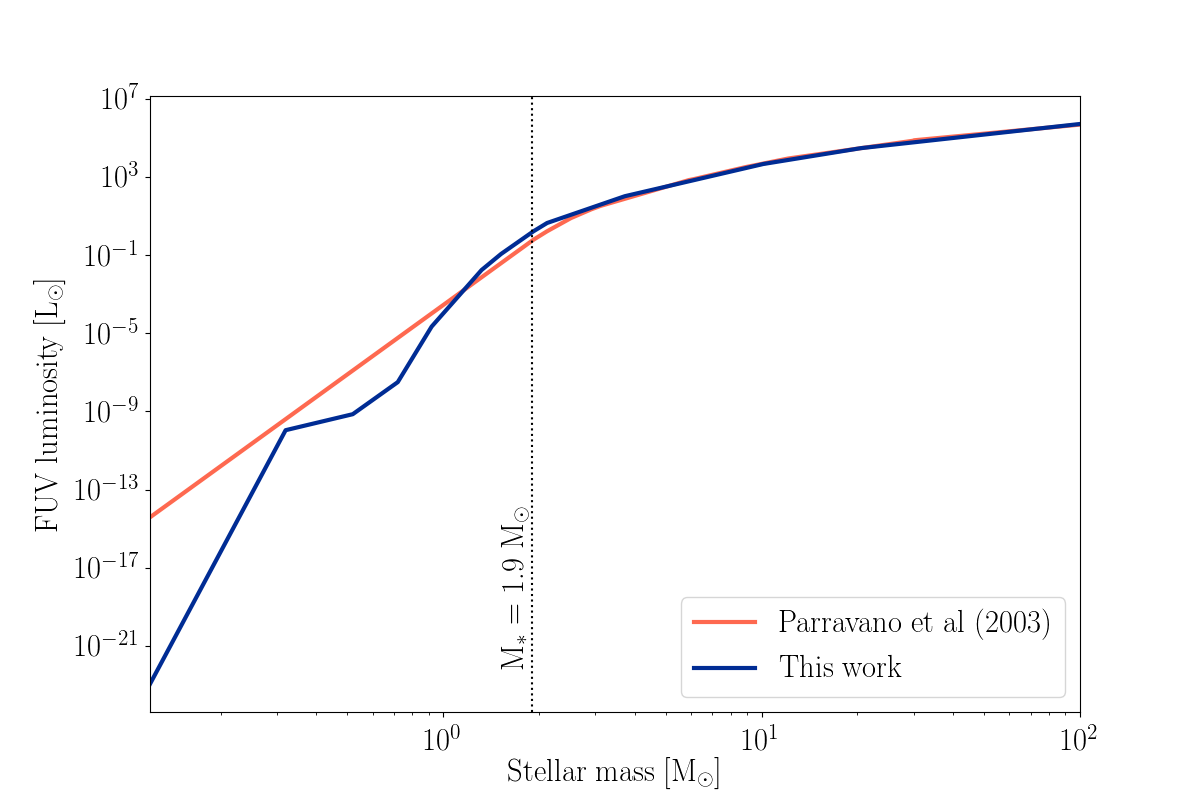
The mass range of the fit in Figure 2 is , however, we are only interested in the range . As is further explained in section 2.3.2, we only consider stars with masses higher that to be emitting FUV radiation, and is the theoretical upper limit for the stellar mass distribution. Stars with masses are given disks and are affected by the massive stars. The massive stars are also subject to stellar evolution, which is implemented with SeBa through the AMUSE interface. The FUV luminosity of each massive star is calculated in every time step, from the precomputed fit, after evolving the stellar evolution code. The low mass stars are not subject to stellar evolution.
2.3.2 Mass loss rate due to external photoevaporation
To calculate the mass loss due to FUV external photoevaporation we use the Far-ultraviolet Radiation Induced Evaporation of Discs (FRIED) grid developed by Haworth et al. (2018b). The FRIED grid is an open access grid of calculations of externally evaporating circumstellar disks. It spans a five dimension parameter space consisting of disk sizes (), disk masses (), FUV fields (), stellar masses () and disk outer surface densities. The seemingly three dimensional grid subspace of disk mass, edge surface density, and disk radius is in fact two dimensional, as any combination of disk radius and disk mass has only one edge density associated with it. Because of this, we only take into account a four dimensional grid of radiation field strength, host star mass, disk mass, and disk radius.
Following the stellar mass ranges of the FRIED grid we separate the stars in the simulations into two subgroups: massive stars and low mass stars. Massive stars are all stars with initial masses higher than , while low mass stars have masses . Only the low mass stars have circumstellar disks in the simulations. The massive stars are considered as only generating FUV radiation and affecting the low mass stars. In this way we make sure that we stay within the stellar mass limits of the FRIED grid. Low mass stars () have a negligible UV flux (Adams et al., 2006), so this approximation holds well for our purposes. Calculation of the FUV radiation emitted by the massive stars is further explained in section 2.3.1. These star subgroups are considered only for the calculation of FUV radiation and photoevaporation mass loss. In the gravity evolution code the two subgroups are undistinguishable.
The FRIED grid allows to take a circumstellar disk with a specific mass, size, and density, around a star with a certain mass, and from the FUV radiation that it receives, obtain the photoevaporation mass loss. However, the parameters of the simulated disks do not always exactly match the ones in the grid. We perform interpolations over the grid to calculate the mass losses of the disks in the simulations. Because of computational constraints, we perform the interpolations on a subspace of the grid, such that it contains at least one data point above and below the phase space point of the disk in each dimension. The high resolution of the FRIED grid ensures that this interpolation is performed over an already smooth region.
When a massive star approaches a circumstellar disk, external photoevaporation is dominated by EUV radiation. Following Johnstone et al. (1998) we define a distance limit below which EUV photons dominate:
| (6) |
where , with the disk radius, and . When a star with a disk is at a distance from a massive star we calculate the mass loss using equation (20) from Johnstone et al. (1998):
| (7) |
with and . During most of their evolution, however, the circumstellar disks in the simulations experience photoevaporation only due to FUV photons. Since we do not consider interstellar gas and dust in the clusters, we do not account for extinction in the calculation of the radiation received by each small star.
2.3.3 Disk truncation due to photoevaporation
Once the mass loss due to photoevaporation is calculated for every disk, the disks are truncated at a point that coincides with the amount of mass lost in the process. We take the approach of Clarke (2007) and remove mass from the outer edge of the disk. We do this by moving outside-in from the disk edge and removing mass from each cell by turning its column density to the edge value defined in section 2.1. We stop at the point where the mass removed from the disk is equal to the calculated mass loss.
We consider a disk to be completely evaporated when it has lost 99% of its initial mass (Anderson et al., 2013) or when its mean column density is lower than (Pascucci et al., 2016). From this point forward the star continues its dynamical evolution normally, but is no longer affected by massive stars.
2.3.4 Summary of cluster evolution
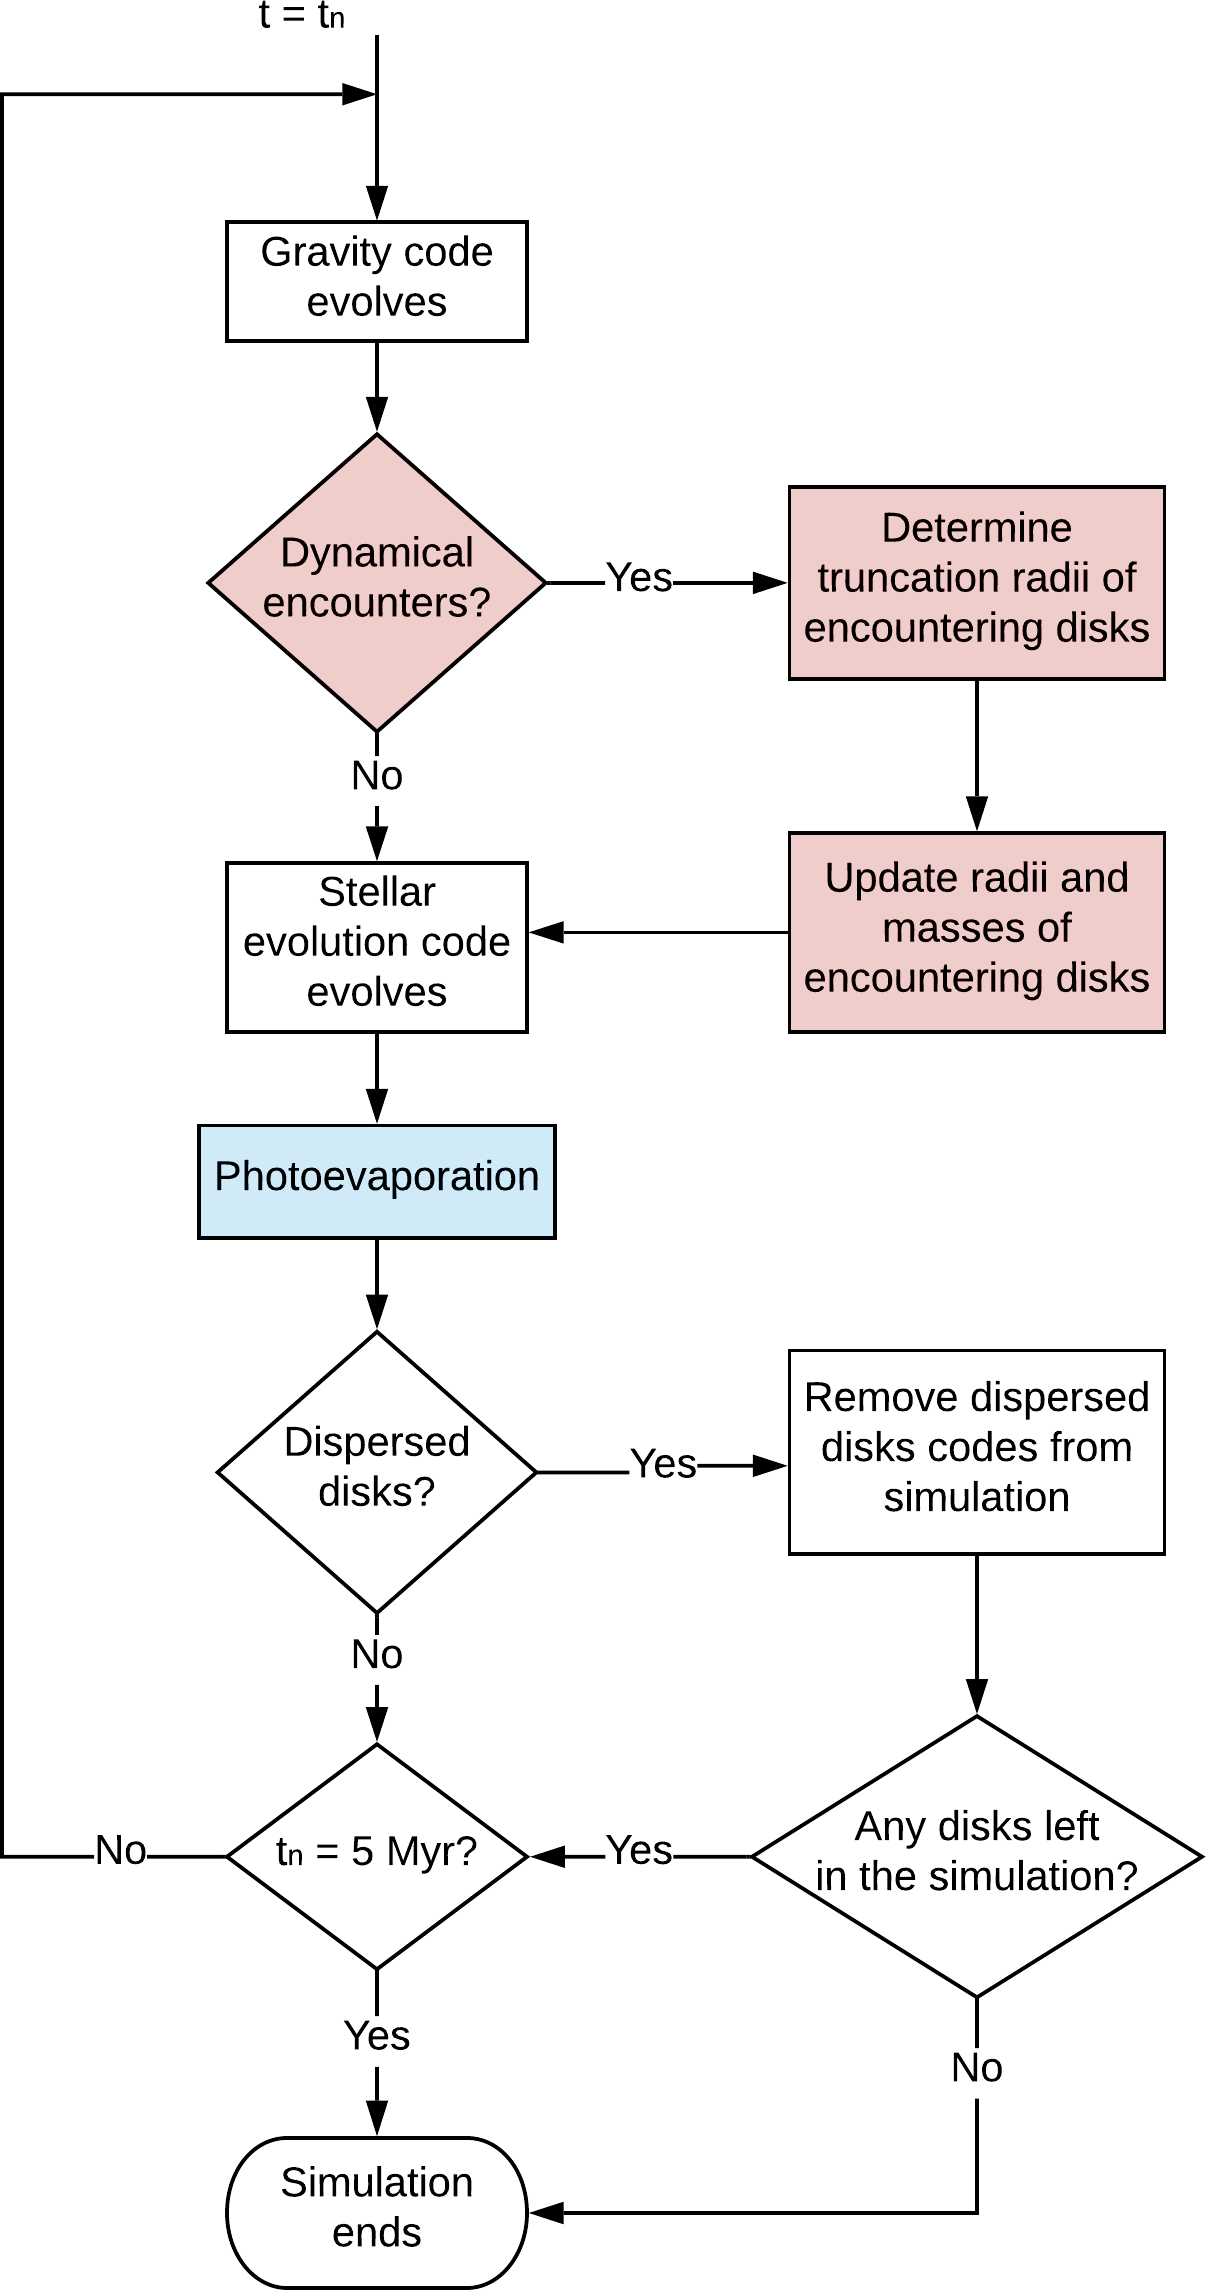
The code runs in major time steps, which represent the time scale on which the various processes are coupled. Within each of these macroscopic time steps (), internal evolutionary processes such as stellar evolution and gravitational dynamics proceed in their own internal time steps ( and respectively). Throughout each macroscopic time step, we perform the following operations:
-
1.
Gravitational dynamics code is evolved.
-
2.
We check the stars for dynamical encounters:
-
2.a
If a dynamical encounter occurs, we determine the truncation radius for each disk.
-
2.b
We update the radius and mass of the disks.
-
2.a
-
3.
Stellar evolution code is evolved.
-
4.
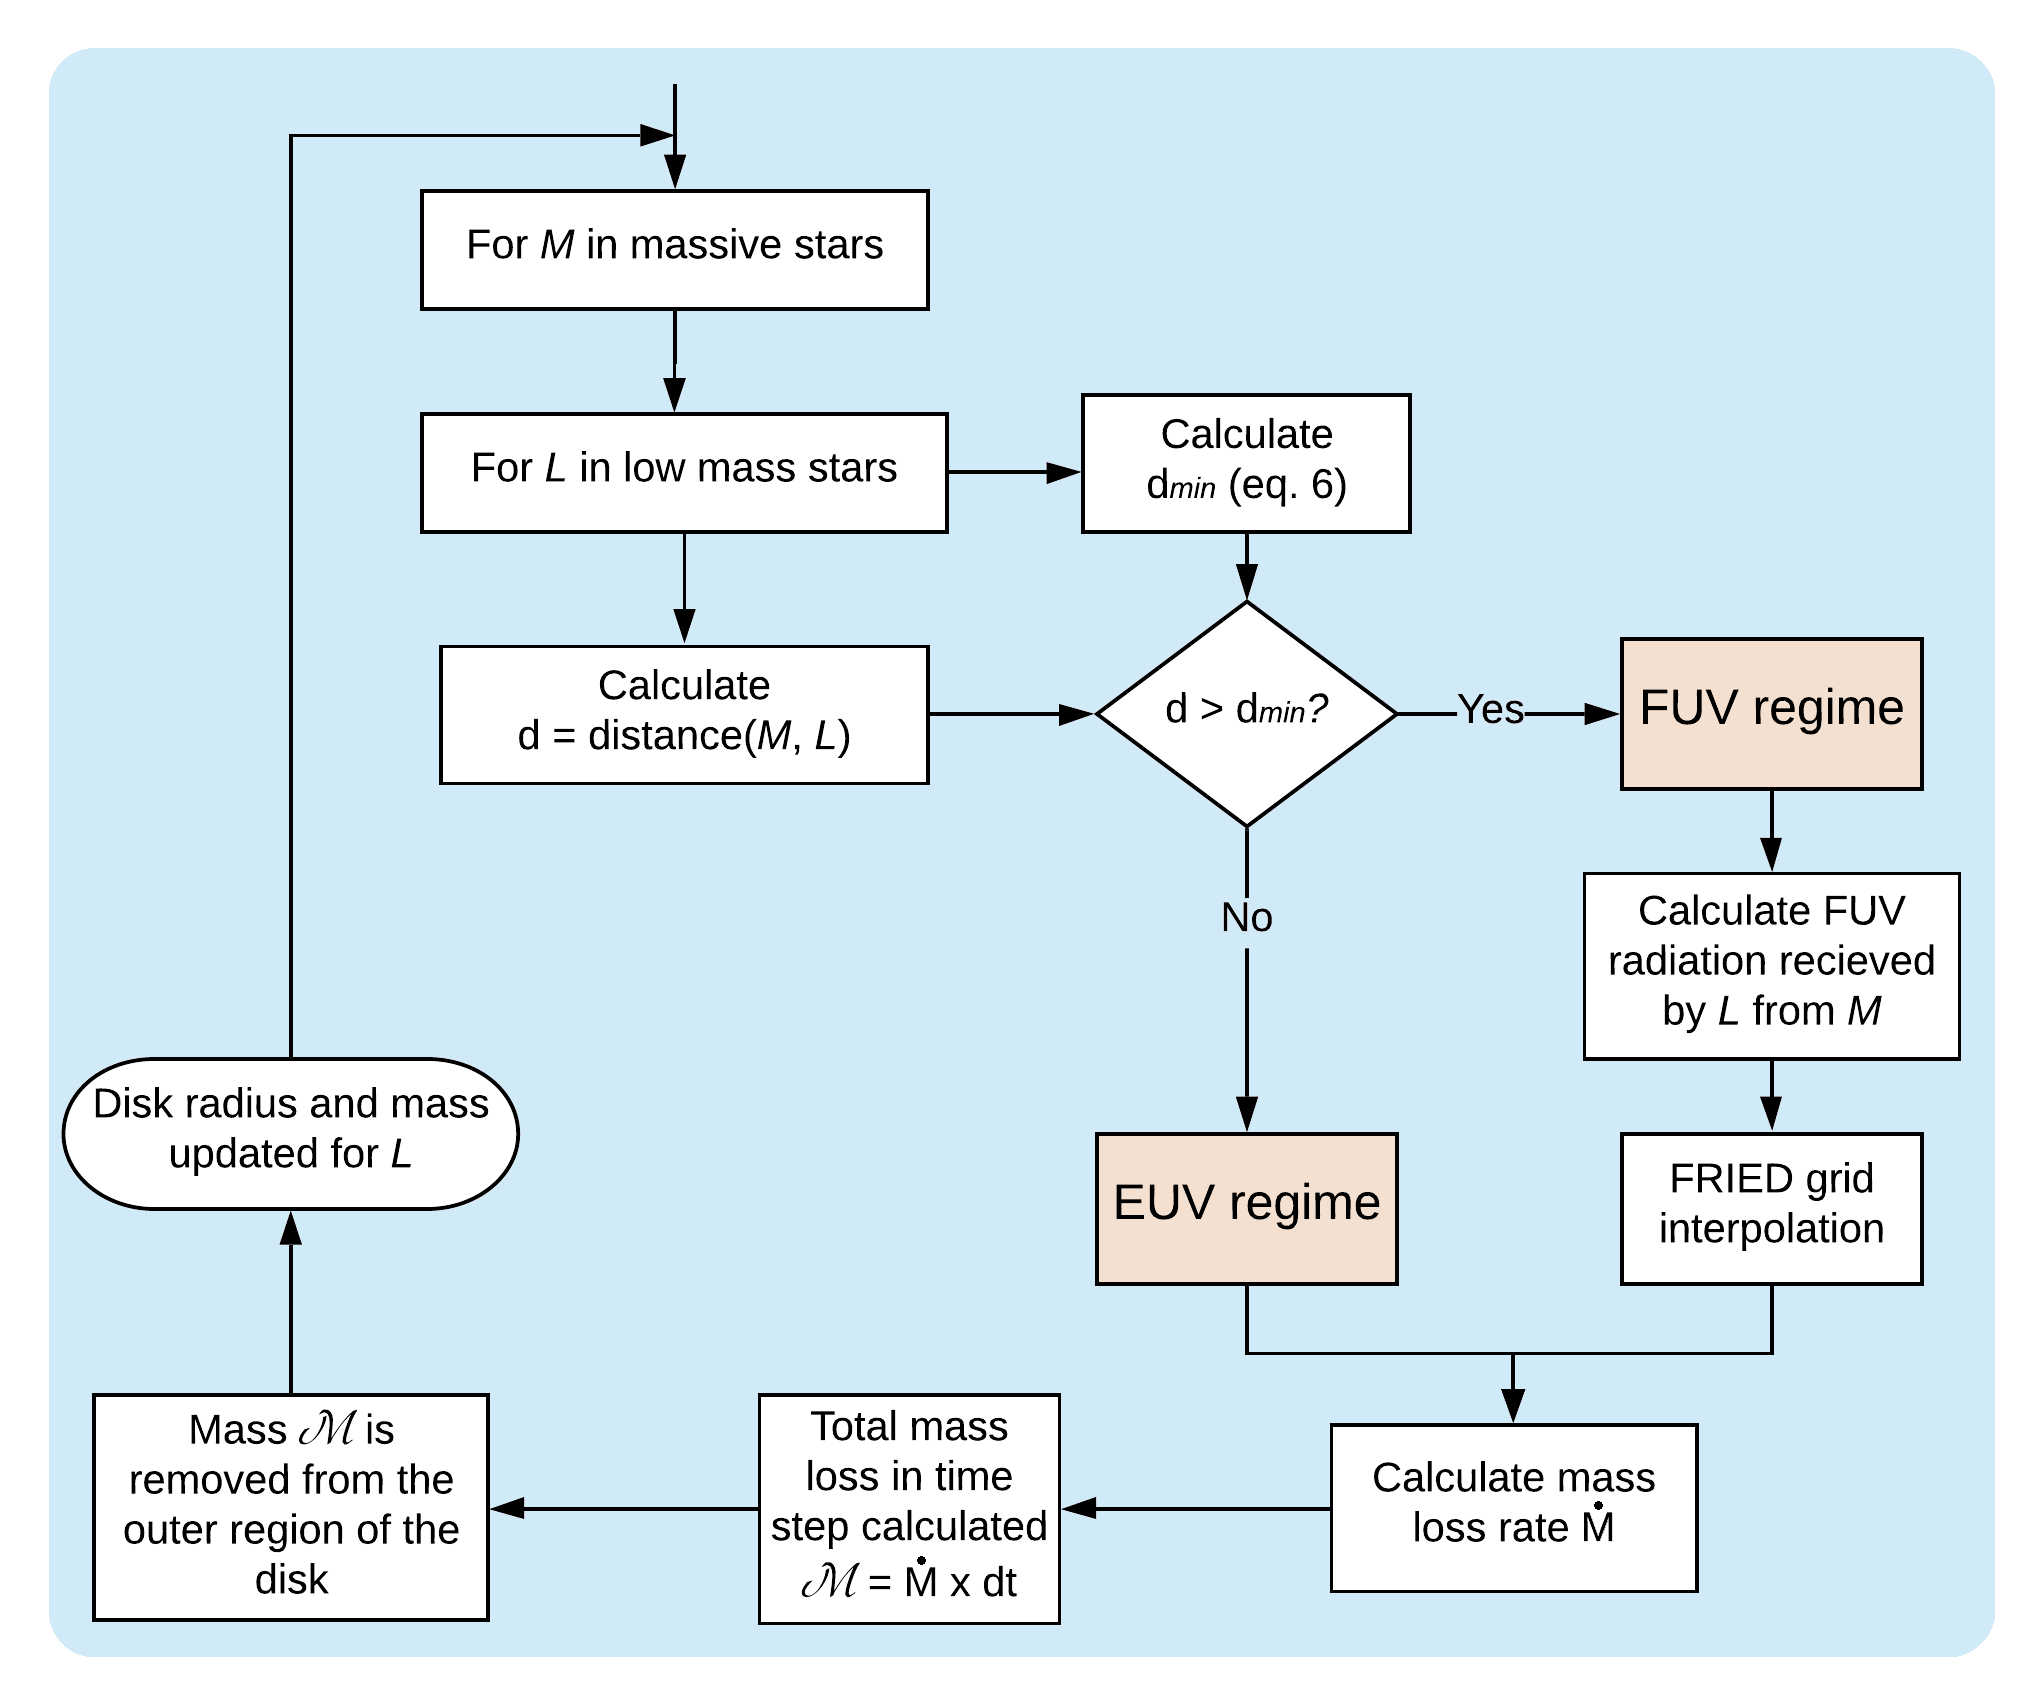
Photoevaporation process is carried out as follows. For each massive star:
-
4.a
We calculate the distance from the massive star to each low mass star.
-
4.b
If (see Eq. 7) we calculate the mass loss .
-
4.c
If the massive star’s FUV luminosity is calculated (see section 2.3.1).
-
4.d
Using and we calculate , the amount of FUV radiation received by the low mass star.
-
4.e
Using together with the low mass star’s mass, disk mass, and disk radius, we build a subgrid of the FRIED grid and interpolate over it to calculate the mass loss .
-
4.f
The total mass loss in the time step is calculated using and .
-
4.g
The mass is removed from the disk by moving outside-in and removing mass from the cells.
-
4.h
The disk mass and radius are updated.
-
4.a
-
5.
Disks are checked for dispersal. If a disk has been dispersed (see section 2.3.3) the code for the disk is stopped and removed and the star continues evolving only as part of the gravitational dynamics code.
-
6.
Simulation runs until of evolution of until all the disks are dispersed, whichever happens first.
2.4 Initial conditions
2.4.1 Disks
The initial radii of the circumstellar disks are given by:
| (8) |
where is a constant. The youngest circumstellar disks observed to date have diameters that range from (e.g. Lee et al., 2018) to (e.g. Murillo et al., 2013; van ’t Hoff et al., 2018). Based on this we choose , which for our mass range for stars with disks results in initial disk radii between and .
The initial masses of the disks are defined as:
| (9) |
2.4.2 Cluster
We perform simulations of young star clusters with stellar densities and using Plummer sphere spatial distributions (Plummer, 1911). We will refer to these distributions as and , respectively. All the regions are in virial equilibrium (viral ratio ).
Stellar masses are randomly drawn from a Kroupa mass distribution (Kroupa, 2001) with maximum mass . The mean mass of the distribution is . In Table 1 we show the details of the stellar masses in each simulation.
| Region | Sim. # | Low mass stars | Massive stars | ||
|---|---|---|---|---|---|
| 1 | 97% | 1.18 0.17 | 3% | 4.08 2.69 | |
| 2 | 99% | 0.24 0.30 | 1% | 3.43 | |
| 3 | 96% | 0.24 0.31 | 4% | 4.51 2.59 | |
| 1 | 94% | 0.27 0.33 | 6% | 5.94 5.65 | |
| 2 | 96% | 0.25 0.31 | 4% | 3.51 0.26 | |
| 3 | 99% | 0.24 0.27 | 1% | 4.90 |
The simulations end at or when all the disks are dispersed, whichever happens first.
3 Results
3.1 Disk mass loss in time
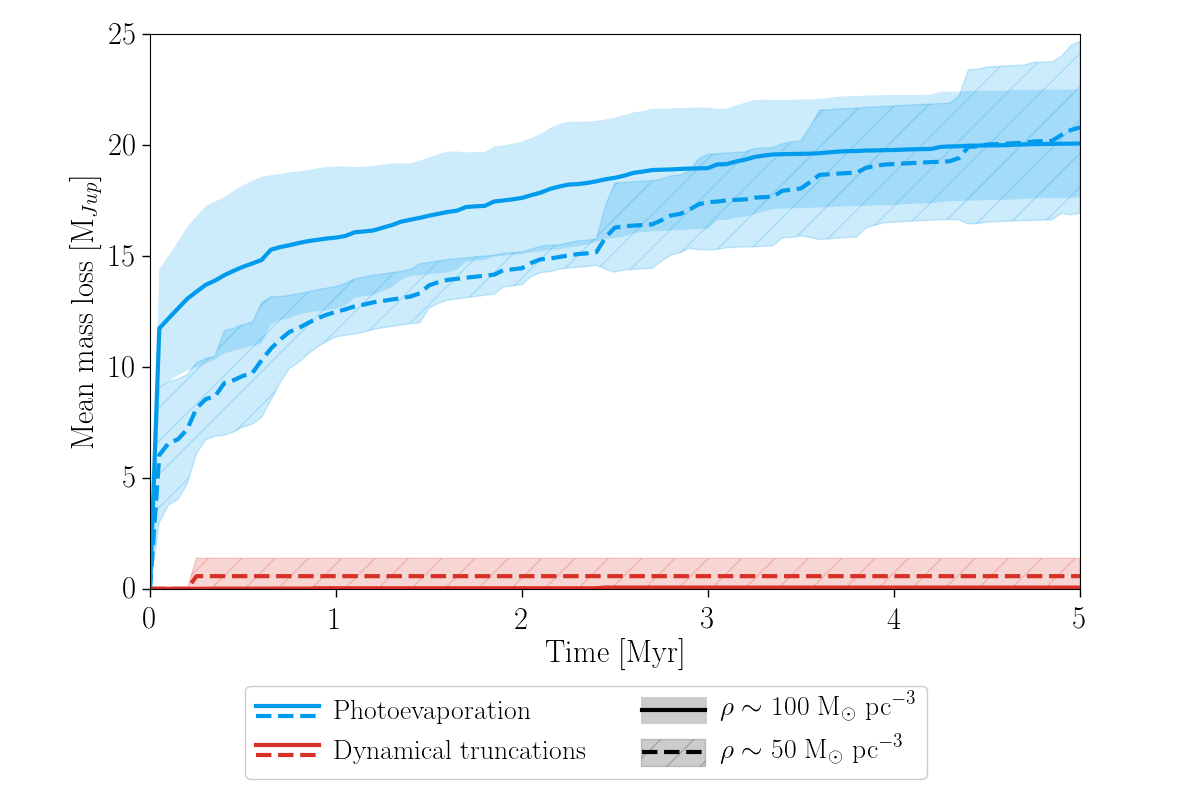
As a way to quantify the mass loss effect of each of the processes included in the simulations, we measure the mass loss due to external photoevaporation and dynamical truncations separately. In Figure 5 we show the mass loss over time for external photoevaporation and dynamical truncations. The solid and dashed lines correspond to the mean mass loss among all stars in the and regions, respectively. The shaded areas show the extent of the results in the different simulation runs.
The mass lost from the circumstellar disks is dominated by external photoevaporation over the entire lifetime of the simulated clusters. Dynamical truncations only have a local effect on truncating disk radii and masses, whereas photoevaporation is a global effect influencing all disks in the cluster.
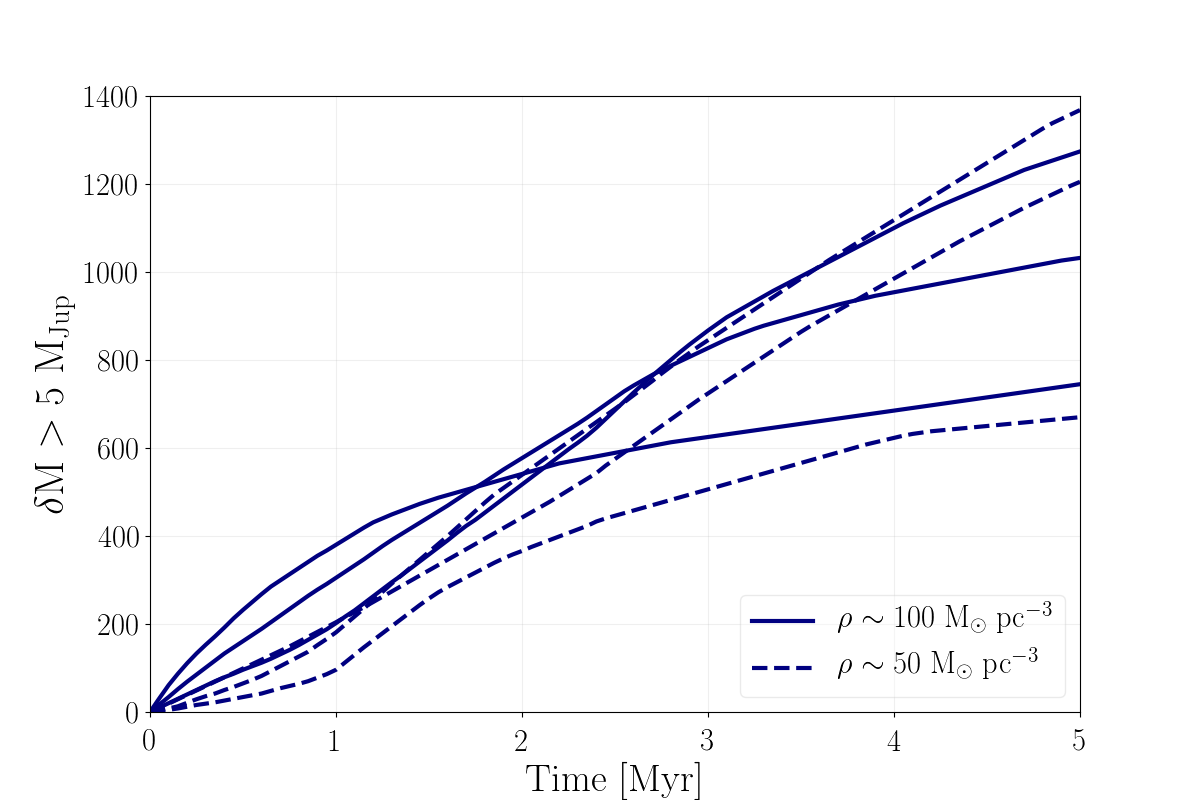
The amount of FUV radiation received by each disk and the ensuing mass loss are variable. The effect depends on the proximity to massive stars, which changes with time as the stars orbit in the cluster potential. For the region the average FUV radiation over of evolution was , with a minimum of 10 and a maximum of . For the region the average over was , minimum and maximum 267 . These values are only shown as an indicative of the environment that the simulation disks were dispersed in, however a short exposure to a strong FUV field can be instantly more destructive than a sustained low FUV field. The FUV field can also vary in time due to processes intrinsic to star formation, such as a massive star being embedded during its early stages (e.g. Ali & Harries, 2019). In our simulations, however, photoevaporation is driven by the background FUV field. In Figure 6 we show the cumulative distributions of disks that lose more than in time. It can be seen that large mass losses are not driven by close encounters with bright stars but by the environmental FUV radiation. From Figure 6 it can be seen that before of evolution the disks in lose mass more strongly than the ones in . However, starting around and until the end of the simulations there is large scatter in the mass loss behaviour for each region. This is related to the dynamics of each cluster. For the crossing time is , and for the crossing time is . This results in the fact that, after one crossing time, all the stars in the clusters have been affected by the radiating stars similarly, causing the scatter in the mass loss effects. While the density of each cluster defines the effects of photoevaporation in the early evolutionary stages, after one crossing time the initial density of the region is not as important and photoevaporation works uniformly.
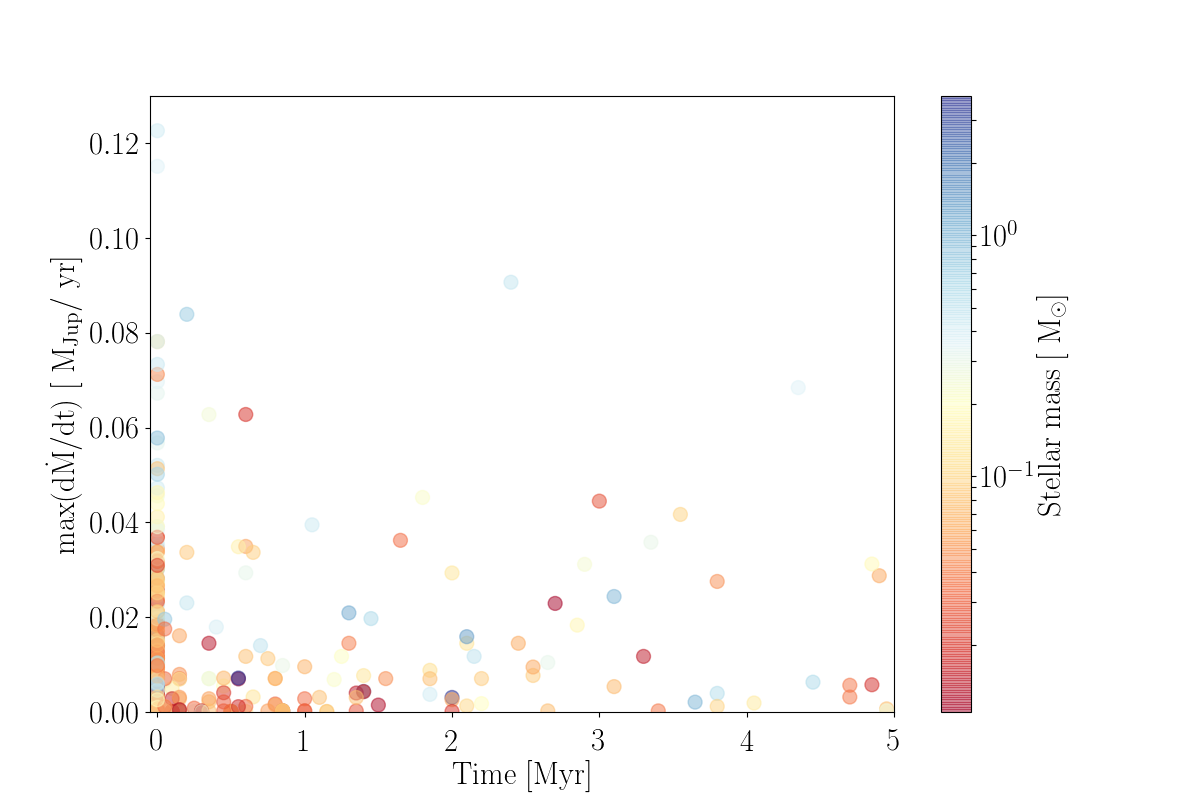
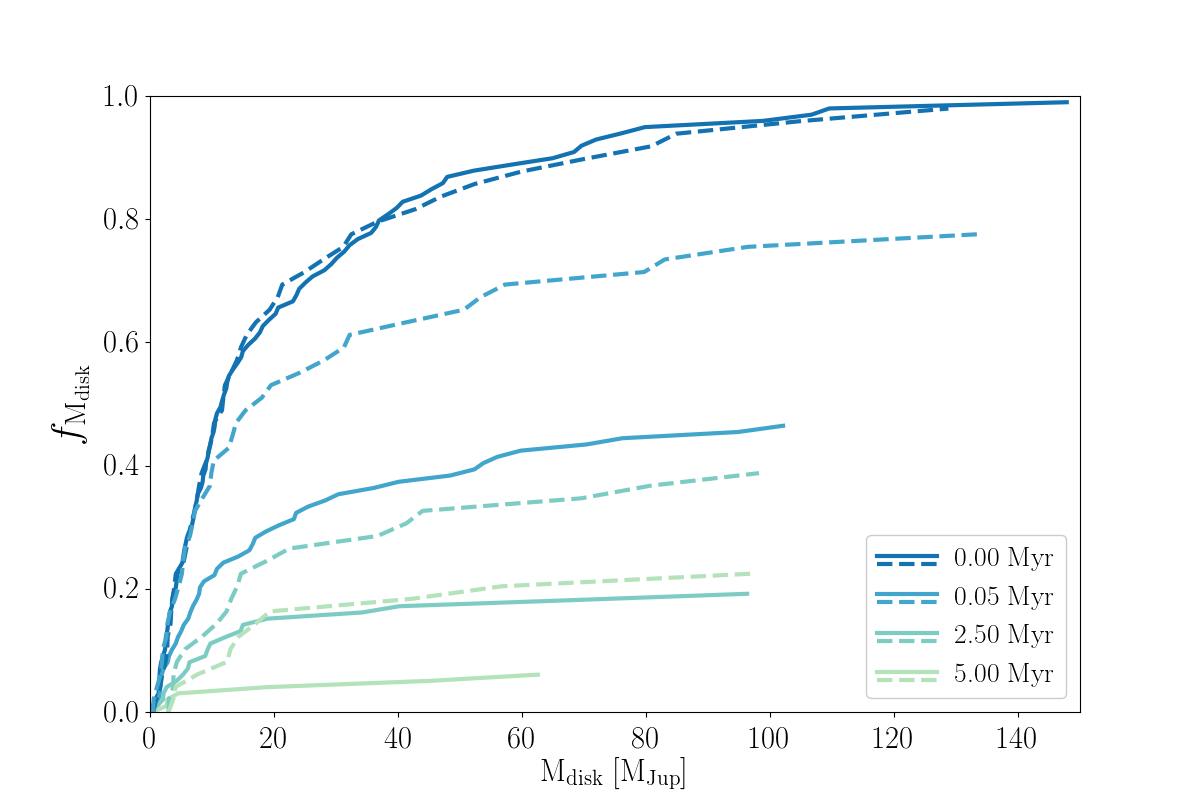
In Figure 7 we show the time step of maximum mass loss for each disk. It can be seen that, other than the effect of switching on the simulation at the beginning (see section 4.2), there is not a particular time at which a disk loses much mass. In Figure 8 we show how the cumulative distributions of disk masses at different moments in the simulation. The solid lines correspond to the dashed lines to . Each line corresponds to the total disks in all simulations. It can be seen that disk mass distributions decrease monotonically.
It is important to note that the FRIED grid has a lower limit of 10 for the FUV field, which is higher than the minimum experienced in the region. However, more than 90% of the stars in these simulations are within the limits of the grid at all times. In the few cases where stars were outside the limits of the grid, the mass loss obtained reflects a lower bound defined by the grid, but this does not affect our results.
Photoevaporation mass loss can have different effects over the gas and dust components of a circumstellar disk. We expand on the consequences of this for our results in section 4.3.
3.2 Disk lifetimes
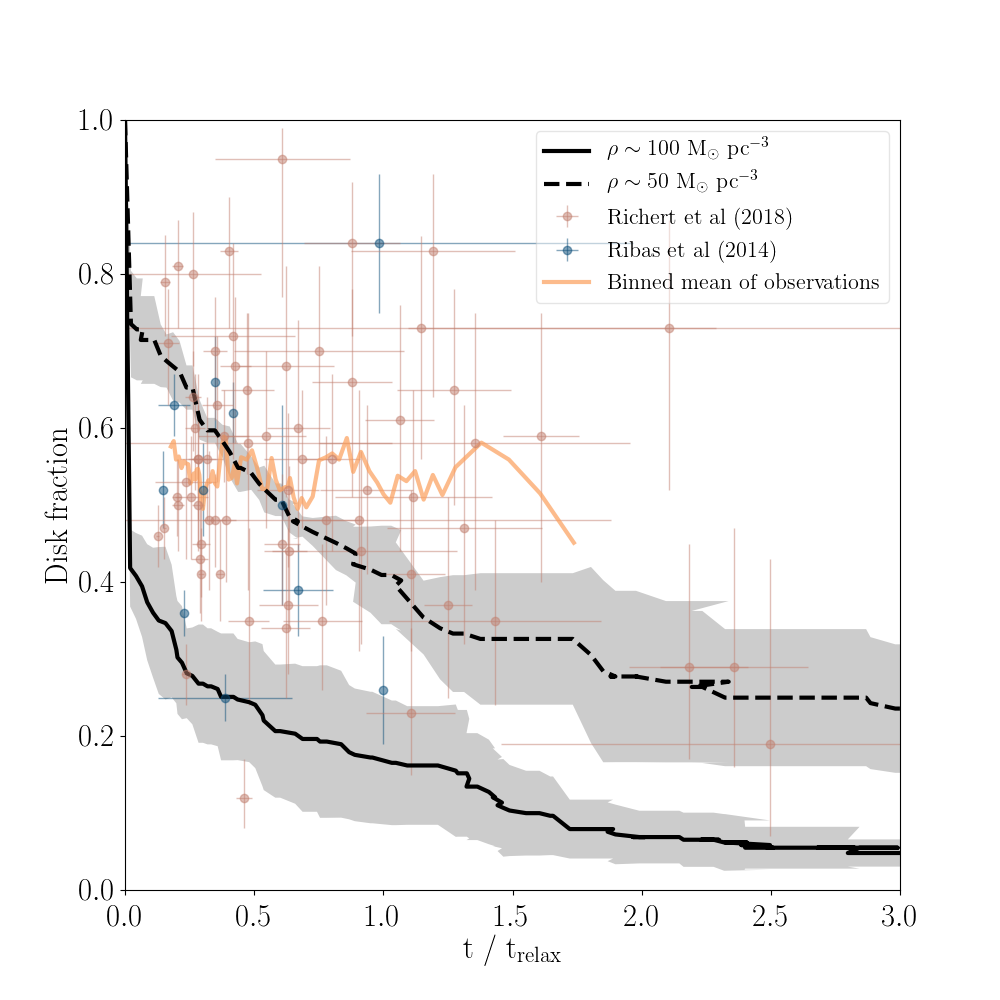
The lifetime of circumstellar disks in young cluster regions is an important criterion to determine how photoevaporation affects planet formation. In Figure 9 we show disk fractions at different times of cluster evolution (black lines), together with observed disk fractions from Ribas et al. (2014) and Richert et al. (2018). The orange line shows the mean of the observations, calculated using a moving bin spanning 10 observation points. The calculation of the mean starts by binning the first 10 points, and then sliding horizontally through the observations one point at a time such that 10 points are always considered.
The relaxation time is defined as:
| (10) |
(Spitzer, 1987), where is the number of stars, , and the dynamical time is:
| (11) |
where is the radius of the cluster and is its total mass. The relaxation time depends on the number of stars and the radius and mass of the stellar cluster. These are values that change through the dynamical evolution of a cluster, meaning that the relaxation time can grow and shrink at different time steps. These variations result in the jagged lines in Figure 9.
For the simulations shown in Figure 9, is reached at of evolution for and at for . Disk fractions in the simulations drop to around before of cluster evolution. In the regions with the disks survive longer, but still most of the disks have disappeared by the end of the simulations.
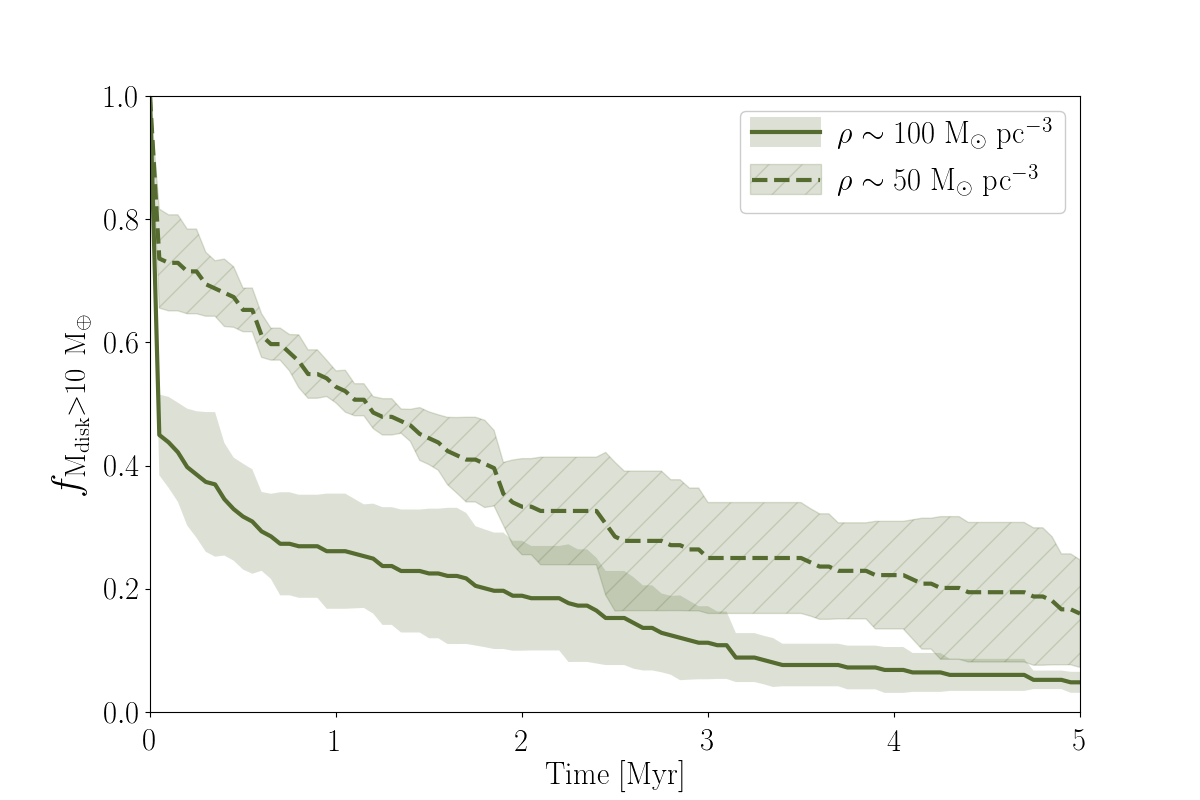
Planet formation could still occur in disks that have been affected by photoevaporation as long as they are not completely dispersed. For gas giant cores and rocky planets to form, protoplanetary disks need to have a reservoir of dust mass (Ansdell et al., 2018). In Figure 10 we show the fraction of disks with solid masses in time, for both simulated stellar densities. We use a 1:100 dust:gas mass ratio to turn the total disk mass into dust mass. For the regions the number of disks that fulfill this mass requirement drops to around at , with less than of disks of said mass still present at the end of the simulations. For the less dense regions, at the end of the simulations around of disks with masses survive.
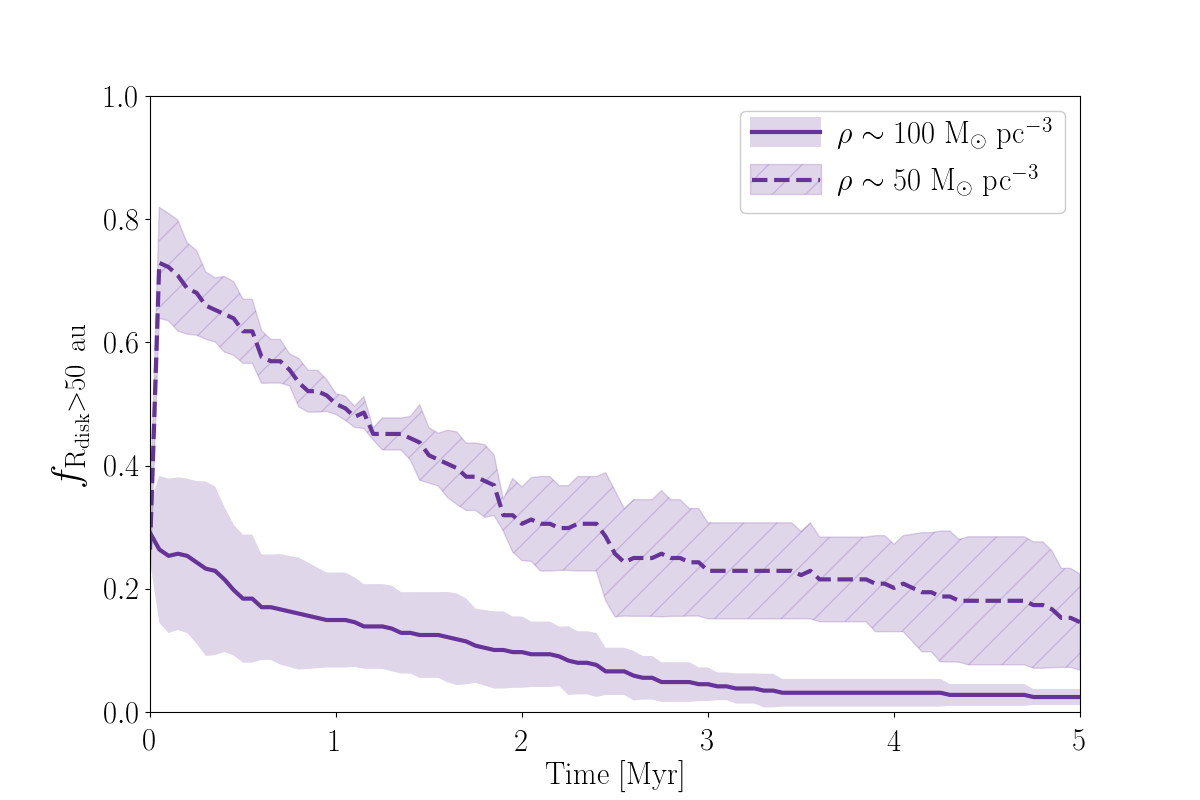
In order to make a parallel with the Solar System, in Figure 11 we show the number of disks in time with radii higher than , for both density regions. The drop in disk sizes is slower than the drop in disk masses as seen in Figure 10, and in the case the fraction of disks with radius increases in the first time steps. This is related to the fact that, while some low mass disks get destroyed, others disks are still expanding due to viscous evolution. Some of these disks could still have masses or surface densities that are too low to form a planetary system.
4 Discussion
4.1 Disk survival and consequences for planet formation
The results of the simulations carried out in this work characterize external photoevaporation as an important mechanism for disk dispersion. In comparison, the effect of dynamical truncations is negligible as a means for disk destruction.
The mean radiation received by the stars in our simulations fluctuates around for the region and around for the region. The FUV flux in the ONC is estimated to be (O’dell & Wen, 1994). Kim et al. (2016) estimate around a B star in NGC 1977, a region close to the ONC. According to this and to our results, most of the disks in such a dense region would be destroyed before reaching of age. Figure 9 also agrees with results by Facchini et al. (2016) and Haworth et al. (2017), which show that photoevaporation mass loss can be important even for regions with and , respectively. In particular, our results for the region show that even very low FUV fields can be effective in dispersing circumstellar disks over time. Winter et al. (2019b) find similar dispersion timescales, with a median of in the solar neighbourhood and in the central regions of the Milky Way, for stars down to . Comparable results are obtained by Nicholson et al. (2019), who find the half life of protoplanetary disks to be around in clusters of various initial conditions.
Protoplanetary disks need to have a reservoir of dust mass to be able to form the rocky cores of giant gas planets (Ansdell et al., 2018). Manara et al. (2018) show that such cores need to be already in place at ages Myr for this type of planets to form. Figure 10 is in agreement with these conclusions. In our simulations, by around of the disks have masses . This number drops to by . According to our results rocky planets and gas giant cores must form very early on, otherwise the protoplanetary disks are not massive enough to provide the necessary amount of solids. This is in agreement with observational time constrains for planet formation and with the so-called “missing-mass“ problem: solids mass measurements in protoplanetary disks are lower than the observed amount of heavy elements in extrasolar planetary systems around the same type of stars (see e.g. Manara et al., 2018; Najita & Kenyon, 2014; Williams, 2012; Greaves & Rice, 2010, for discussions on this topic). Two scenarios have been proposed to explain this discrepancy in disk and exoplanet masses. The first one suggests that planet cores emerge within the first Myr of disk evolution, or even during the embedded phase while the disk is still being formed (e.g. Williams, 2012; Greaves & Rice, 2010). The second scenario proposes that disks can work as conveyor belts, transporting material from the surrounding interstellar medium towards the central star (e.g. Throop & Bally, 2008; Kuffmeier et al., 2017).
Disk dispersal is not homogeneous across stellar types. There are observational indications that disk dispersion timescales depend on the mass of the host star, and that less massive () stars keep their disks for longer than massive stars (Carpenter et al., 2006, 2009; Luhman & Mamajek, 2012). We do not see this effect in our simulations, where the most massive stars keep their disks for longer simply because they initially have the most massive disks. The same effect is observed in Winter et al. (2019b), who used an analytic approach to estimate protoplanetary disk dispersal time scales by external photoevaporation. The discrepancy between observations and theoretical results suggests that internal processes not considered in this work can also play an important role in disk dispersal. Radial drift of dust, fragmentation of large grains, and planetesimal formation are observed mechanisms that can affect both disk lifetimes and observed disk sizes. Viscous evolution alone is another internal process that can contribute to disk dispersal. A more complete model of disk evolution is needed to include the interplay between internal and external dispersion processes.
Initial disk masses are currently highly uncertain. Our chosen value of is arbitrary, but disks of higher masses could still be stably supported (Haworth et al., 2018a; Nixon et al., 2018).
Once a planetary system has formed, its survival inside a star cluster is not guaranteed. Of the 4071 exoplanets confirmed to date, only 30 have been found inside star clusters. Cai et al. (2019) performed simulations of planetary systems in dense, young massive star clusters. They found that the survival rate is for planetary systems with eccentricities and semi-major axes over of evolution. van Elteren et al. (2019) find that, in regions such as the Trapezium cluster, of planetary systems are affected by the influence of other stars. Their fractal initial conditions provide local regions of higher densities, which are more favorable for dynamical encounters than our initial conditions. When making parallels with currently observed exoplanet systems, it is important not only to consider the environment effects on the early protoplanetary disks, but also on the planets themselves once they are already formed.
Observations suggest that planets are able to circumvent all of these adversary processes and still form in highly unlikely regions. Evidence of star formation and even proplyd-like objects have been observed around Sgr A* (Yusef-Zadeh et al., 2015, 2017). Free-floating planets have been observed in the galactic center, and efficiency analyses of these detections suggest that there are many more yet to be observed (e.g. Ryu et al., 2019; Navarro et al., 2019).
4.2 Influence of initial conditions
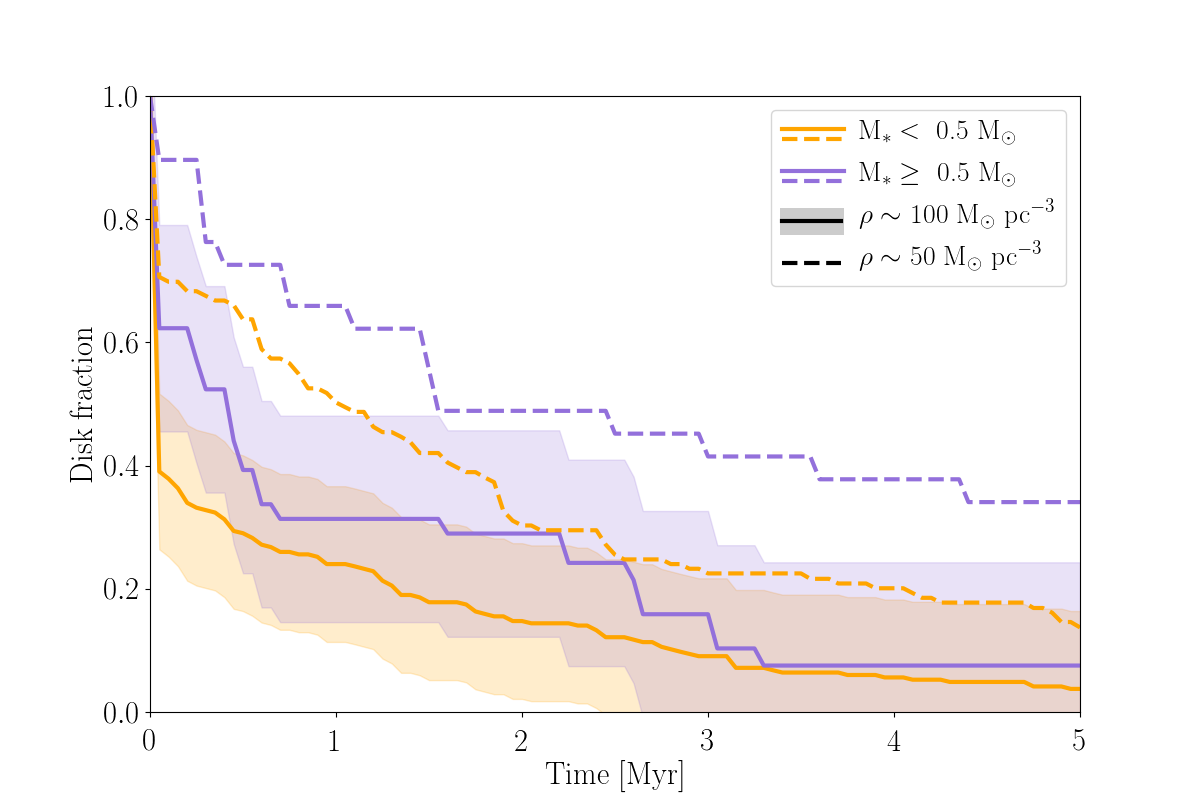
The effect of switching on photoevaporation when our simulations start have dramatic consequences for the initial circumstellar disks. Mass loss due to photoevaporation occurs very quickly once the stars are immersed in the FUV field. Around and of the disks are dispersed within the initial in the and regions, respectively. The mean mass of the host stars whose disks dispersed in the initial is for the region and for the region. In Figure 12 we show the disk fractions in time, separately for stars with masses and . It can be seen that, for the stars of masses , the disk fractions drop much more dramatically during the first thousand years of cluster evolution.
In reality, if circumstellar disks do form around such low mass stars, they could be sheltered from photoevaporation by interstellar gas and dust, which can linger for several million years after star formation (Portegies Zwart et al., 2010). Models of the Cygnus OB2 region by Winter et al. (2019a) demonstrate that the extinction of FUV photons through the gas dampens the mass loss of the disks, increasing their lifetimes. They show that Cygnus OB2 probably underwent a primordial gas expulsion process that ended ago. This is based on the fact that of exposure to FUV fields reproduces the observed disk fractions in the region. Given that the estimated age of Cygnus OB2 is (Wright et al., 2010) the primordial gas in the region insulated the disks from external photoevaporation for several Myr. A similar point is made by Clarke (2007), who propose that the FUV field of the star must have been “switched on“ no more than ago to explain the disk size distribution observed around it. This switching on could have been caused by the star clearing out the primordial gas it was embedded in, thus reducing extinction around it and making its effective radiation field stronger (Ali & Harries, 2019). The presence of gas in young star clusters could then protect the protoplanetary disks and make the disk fraction drop more smoothly than what is shown in Figure 9.
The observations shown in Figure 9 span clusters of many different ages and densities. Our simulation results show that one order of magnitude difference in initial cluster density can yield an important difference in the number of surviving disks. A one order of magnitude spread in cluster density translates to a three order of magnitude difference in cluster radius. The extent of stellar densities in regions where circumstellar disks have been detected does not only reflect the environment of these regions, but also the variety in initial cluster densities.
The initial spatial distribution of the stars in the simulations also plays an important role during the early stages of disk evolution. The stars in our simulations were initially distributed in a Plummer sphere with a specified radius and in virial equilibrium. An approach with fractal or filamentary (e.g. Winter et al., 2019a) initial conditions could change the overall disk survival rates. If a massive star is born in a clump of a fractal distribution, for example, stars in other clumps without massive stars could be minorly affected by radiation and have higher chances of surviving and, eventually, making planets. Higher density regions also increase the relevance of dynamical truncations. This effect of initial conditions could also be counteracted by dynamical mass segregation, in which massive stars move towards the center of the cluster. This would increase the effect of photevaporation in the central regions of the cluster.
4.3 Model caveats
There are several physical processes not considered in this work which could affect the results presented here. One big caveat of our model is the lack of separation between dust and gas components in circumstellar disks. These separate disk components evolve differently and are affected in distinctive ways by outside mechanisms such as the ones implemented in this work. Gas disks has been observed to be larger than dust disks by a factor of (Ansdell et al., 2018). Whether this is caused by different evolution for gas and dust or observational optical depth effects is still up for debate (see e.g. Birnstiel & Andrews, 2013; Facchini et al., 2017; Trapman et al., 2019, for discussions on the topic). The dust in protoplanetary disks is subject to radial drifting and radially dependent grain growth, which can make it resilient to photoevaporation. This can have direct implications on the photoevaporation mass loss rates (Facchini et al., 2016; Haworth et al., 2018a) and consequences on planet formation. The conclusions regarding planet formation timescales derived in this work only consider the life expectancy of the disks, but considering different dust and gas disk components will likely affect these results.
While photoevaporation is considered to be primarily damaging for disks when coming from external sources, under certain regimes the photons coming from the host star can also contribute to disk dispersal. Gorti et al. (2009) and Gorti & Hollenbach (2009) show that FUV photons from the host star can drive photoevaporation mass loss at disk radius and . Owen et al. (2010) and Font et al. (2004) show that internal photoevaporation can also remove loosely bound material from the outer regions, however the largest mass loss was from the inner region. Fatuzzo & Adams (2008) and Hollenbach et al. (2000) find that external photoevaporation dominates for disk regions . The approach used in this work is valid for the disk truncation approximation, however, a more complete analysis would have to consider the combined action and interplay of external and internal photoevaporation.
Mass loss due to photoevaporation was modelled by calculating a truncation radius and removing all the mass outside it, while the inner region of the disk remained unperturbed. In reality, external FUV radiation can heat the whole surface of the disk, and mass loss can occur not just as a radial flow but also as a vertical flow from all over the disk (Adams et al., 2004). Given that the mass in the outer regions of a disk is more loosely bound to its host star, the truncation approach is a good first order approximation for mass loss. Furthermore, the FRIED grid used to estimate the photoevaporation mass loss was built using a 1-dimensional disk model. New simulations by Haworth & Clarke (2019) show that, when considering a 2-dimensional disk model, mass loss rates can increase up to a factor 3.7 for a solar mass star. The photoevaporation mass losses obtained in this work should then be considered as lower limits, but are still a good estimate of the effects of bright stars in the vicinity of circumstellar disks.
In the present work we did not include binary stars or any multiples. The presence of multiple stellar systems can have direct consequences on the dynamical evolution of the cluster and on the effects of photoevaporation over the disks. Disks around binary stars have been observed in the star forming regions Ophiuchus (Cox et al., 2017) and Taurus-Auriga (Harris et al., 2012; Akeson & Jensen, 2014; Akeson et al., 2019). Observations suggest that these disks are more compact and less bright than the ones around isolated stars. Disks around binary stars might also have shorter lifetimes, due to effects of the companion on the viscous timescale of the disk and also because of photoevaporation inside the system (Shadmehri et al., 2018; Rosotti & Clarke, 2018).
Another process that can have important consequences in the evolution of circumstellar disks are supernovae explosions. Close & Pittard (2017) showed that nearby () supernova explosions can cause mass loss rates of up to which can be sustained for about . Only disks that are faced with the flow face-on manage to survive, but still lose of their mass in the process. Portegies Zwart et al. (2018) show that a supernova explosion at a distance between and could create a misalignment of between the star and its disk, which is consistent with the inclination of the plane of the Solar System. Such an event would also truncate a disk at around the edge of the Kuiper belt (). Similar effects can be caused by other outcomes of stellar evolution, such as winds (Pelupessy & Portegies Zwart, 2012).
5 Conclusions
We perform simulations of star clusters with stellar densities and . The stars with masses are surrounded by circumstellar disks. Stars with masses are considered sufficiently massive stars to emit UV radiation, causing the disks around nearby stars to evaporate. The disks are subject to viscous growth, dynamical encounters, and external photoevaporation. The simulations span of cluster evolution. The main results of this work are:
-
1.
In clusters with density around of disks are destroyed by external photoevaporation within . The mean background FUV field is .
-
2.
In clusters with density around of disks are destroyed by external photoevaporation within . The mean background FUV field is . This shows that even very low FUV fields can be effective at destroying disks over long periods of time.
-
3.
Mass loss caused by dynamical encounters is negligible compared to mass loss caused by external photoevaporation. Disk truncations that result from dynamical encounters are not an important process in setting observed disk size and mass distributions.
-
4.
At , of disks in the region and of disks region have masses , the theoretical limit for gas giant core formation.
- 5.
-
6.
The obtained disk fractions in the different density regions, together with the quick dispersion of the disks in all the simulations, suggest that initial conditions are very important in the development of models of early protoplanetary disk evolution.
Acknowledgements
We would like to thank the anonymous referee for their thoughtful comments that helped improve this paper. We would also like to thank Andrew Winter, Sierk van Terwisga, and the protoplanetary disk group at Leiden Observatory for helpful discussions and comments. F.C.-R. would like to thank Valeriu Codreanu from SURFsara for his invaluable technical assistance. The simulations performed in this work were carried out in the Cartesius supercomputer, part of the Dutch national supercomputing facility SURFsara.
Appendix A Resolution of the disks
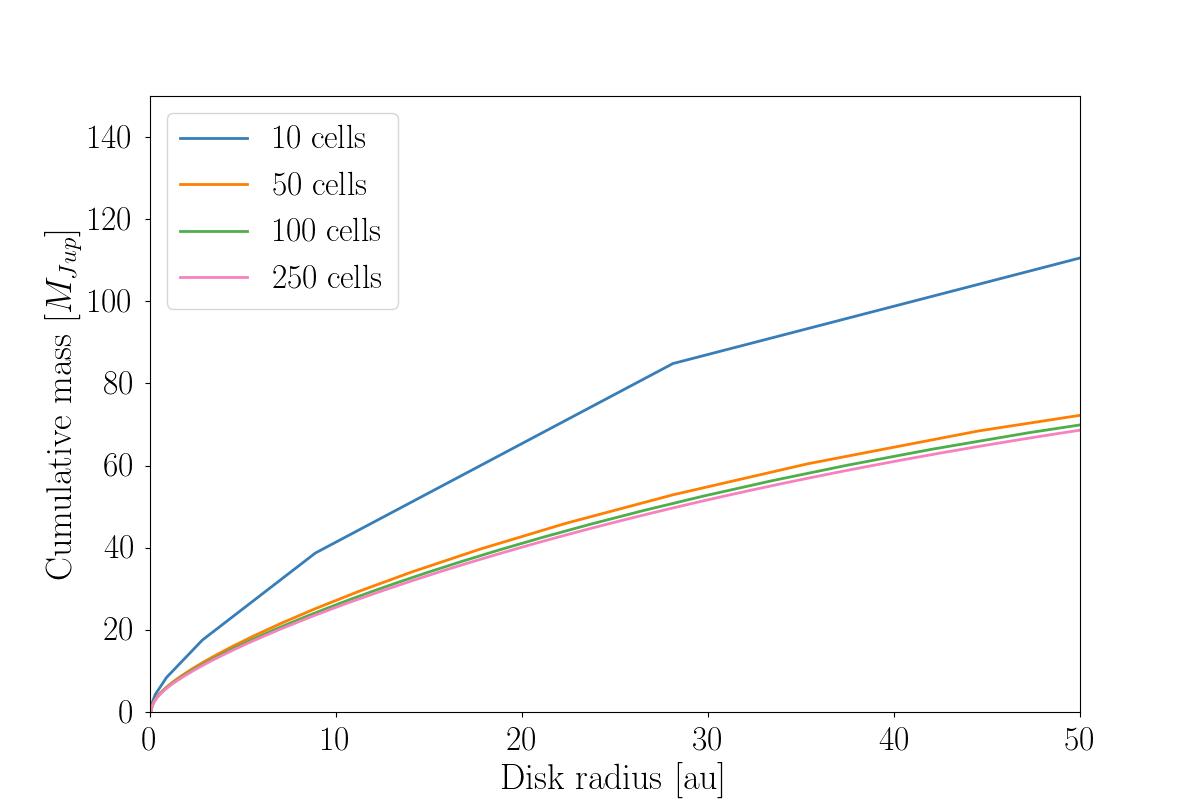
We use a resolution of 50 cells for the disks which gives us a good trade-off between computing time and acceptable results. In isolated disk evolution this causes an overestimation of disk radius by on average over 1 Myr of disk evolution, compared with higher resolutions (Figure 13). Since all the disks in the simulation are affected by photoevaporation from the start, no disks evolve as in the isolated case. Disk masses are overestimated by less than compared to higher resolution runs (Figure 14). This results, in turn, in a slight underestimation of the effects that mass removal, whether through photoevaporation or dynamical encounters, has on the survival times of the disks. Given that we define a disk as dispersed when it has lost of its initial mass, the slight mass overestimate obtained with the 50 cells resolution does not reflect in a quicker evaporation of the disks.

References
- Adams & Myers (2001) Adams F. C., Myers P. C., 2001, The Astrophysical Journal, 553, 744
- Adams et al. (2004) Adams F. C., Hollenbach D., Laughlin G., Gorti U., 2004, ApJ, 611, 360
- Adams et al. (2006) Adams F. C., Proszkow E. M., Fatuzzo M., Myers P. C., 2006, ApJ, 641, 504
- Akeson & Jensen (2014) Akeson R. L., Jensen E. L. N., 2014, The Astrophysical Journal, 784, 62
- Akeson et al. (2019) Akeson R. L., Jensen E. L. N., Carpenter J., Ricci L., Laos S., Nogueira N. F., Suen-Lewis E. M., 2019, The Astrophysical Journal, 872, 158
- Ali & Harries (2019) Ali A. A., Harries T. J., 2019, Monthly Notices of the Royal Astronomical Society, 487, 4890
- Anderson et al. (2013) Anderson K. R., Adams F. C., Calvet N., 2013, ApJ, 774, 9
- Ansdell et al. (2018) Ansdell M., et al., 2018, ApJ, 859, 21
- Armitage (2000) Armitage P. J., 2000, Astronomy and Astrophysics, 362, 968
- Balog et al. (2007) Balog Z., Muzerolle J., Rieke G. H., Su K. Y. L., Young E. T., Megeath S. T., 2007, ApJ, 660, 1532
- Bhandare et al. (2016) Bhandare A., Breslau A., Pfalzner S., 2016, A&A, 594, A53
- Birnstiel & Andrews (2013) Birnstiel T., Andrews S. M., 2013, The Astrophysical Journal, 780, 153
- Breslau et al. (2014) Breslau A., Steinhausen M., Vincke K., Pfalzner S., 2014, Astronomy and Astrophysics, 565, A130
- Bressert et al. (2010) Bressert E., et al., 2010, Monthly Notices of the Royal Astronomical Society: Letters, 409, L54
- Cabrit et al. (2006) Cabrit S., Pety J., Pesenti N., Dougados C., 2006, Astronomy & Astrophysics, 452, 897
- Cai et al. (2019) Cai M. X., Portegies Zwart S., Kouwenhoven M. B. N., Spurzem R., 2019, arXiv e-prints, p. arXiv:1903.02316
- Carpenter et al. (2006) Carpenter J. M., Mamajek E. E., Hillenbrand L. A., Meyer M. R., 2006, The Astrophysical Journal, 651, L49
- Carpenter et al. (2009) Carpenter J. M., Mamajek E. E., Hillenbrand L. A., Meyer M. R., 2009, The Astrophysical Journal, 705, 1646
- Clarke (2007) Clarke C. J., 2007, MNRAS, 376, 1350
- Clarke et al. (2001) Clarke C. J., Gendrin A., Sotomayor M., 2001, Monthly Notices of the Royal Astronomical Society, 328, 485
- Close & Pittard (2017) Close J. L., Pittard J. M., 2017, MNRAS, 469, 1117
- Concha-Ramírez et al. (2019) Concha-Ramírez F., Vaher E., Portegies Zwart S., 2019, MNRAS, 482, 732
- Cox et al. (2017) Cox E. G., et al., 2017, ApJ, 851, 83
- Dai et al. (2015) Dai F., Facchini S., Clarke C. J., Haworth T. J., 2015, Monthly Notices of the Royal Astronomical Society, 449, 1996
- Facchini et al. (2016) Facchini S., Clarke C. J., Bisbas T. G., 2016, MNRAS, 457, 3593
- Facchini et al. (2017) Facchini S., Birnstiel T., Bruderer S., van Dishoeck E. F., 2017, Astronomy & Astrophysics, 605, A16
- Fang et al. (2012) Fang M., et al., 2012, A&A, 539, A119
- Fatuzzo & Adams (2008) Fatuzzo M., Adams F. C., 2008, ApJ, 675, 1361
- Font et al. (2004) Font A. S., McCarthy I. G., Johnstone D., Ballantyne D. R., 2004, The Astrophysical Journal, 607, 890
- Gorti & Hollenbach (2009) Gorti U., Hollenbach D., 2009, The Astrophysical Journal, 690, 1539
- Gorti et al. (2009) Gorti U., Dullemond C. P., Hollenbach D., 2009, The Astrophysical Journal, 705, 1237–1251
- Gorti et al. (2015) Gorti U., Hollenbach D., Dullemond C. P., 2015, ApJ, 804, 29
- Greaves & Rice (2010) Greaves J. S., Rice W. K. M., 2010, MNRAS, 407, 1981
- Guarcello et al. (2007) Guarcello M. G., Prisinzano L., Micela G., Damiani F., Peres G., Sciortino S., 2007, A&A, 462, 245
- Guarcello et al. (2009) Guarcello M. G., Micela G., Damiani F., Peres G., Prisinzano L., Sciortino S., 2009, A&A, 496, 453
- Guarcello et al. (2010) Guarcello M. G., Damiani F., Micela G., Peres G., Prisinzano L., Sciortino S., 2010, Astronomy and Astrophysics, 521, A18
- Guarcello et al. (2016) Guarcello M. G., et al., 2016, arXiv:1605.01773 [astro-ph]
- Habing (1968) Habing H. J., 1968, Bulletin of the Astronomical Institutes of the Netherlands, 19, 421
- Harris et al. (2012) Harris R. J., Andrews S. M., Wilner D. J., Kraus A. L., 2012, The Astrophysical Journal, 751, 115
- Haworth & Clarke (2019) Haworth T. J., Clarke C. J., 2019, Monthly Notices of the Royal Astronomical Society, 485, 3895
- Haworth et al. (2016) Haworth T. J., Boubert D., Facchini S., Bisbas T. G., Clarke C. J., 2016, MNRAS, 463, 3616
- Haworth et al. (2017) Haworth T. J., Facchini S., Clarke C. J., Cleeves L. I., 2017, MNRAS, 468, L108
- Haworth et al. (2018a) Haworth T. J., Facchini S., Clarke C. J., Mohanty S., 2018a, MNRAS, 475, 5460
- Haworth et al. (2018b) Haworth T. J., Clarke C. J., Rahman W., Winter A. J., Facchini S., 2018b, MNRAS, 481, 452
- Hollenbach et al. (2000) Hollenbach D. J., Yorke H. W., Johnstone D., 2000, Protostars and Planets IV, p. 401
- Johnstone et al. (1998) Johnstone D., Hollenbach D., Bally J., 1998, The Astrophysical Journal, 499, 758
- Jílková et al. (2015) Jílková L., Portegies Zwart S., Pijloo T., Hammer M., 2015, MNRAS, 453, 3157
- Jílková et al. (2016) Jílková L., Hamers A. S., Hammer M., Portegies Zwart S., 2016, MNRAS, 457, 4218
- Kim et al. (2016) Kim J. S., Clarke C. J., Fang M., Facchini S., 2016, The Astrophysical Journal, 826, L15
- King et al. (2012) King R. R., Goodwin S. P., Parker R. J., Patience J., 2012, Monthly Notices of the Royal Astronomical Society, 427, 2636
- Kroupa (2001) Kroupa P., 2001, MNRAS, 322, 231
- Krumholz & Forbes (2015) Krumholz M. R., Forbes J. C., 2015, Astronomy and Computing, 11, 1
- Kuffmeier et al. (2017) Kuffmeier M., Haugb\ole T., Nordlund t., 2017, The Astrophysical Journal, 846, 7
- Lee et al. (2018) Lee C.-F., Li Z.-Y., Hirano N., Shang H., Ho P. T. P., Zhang Q., 2018, ApJ, 863, 94
- Luhman & Mamajek (2012) Luhman K. L., Mamajek E. E., 2012, ApJ, 758, 31
- Lynden-Bell & Pringle (1974) Lynden-Bell D., Pringle J. E., 1974, MNRAS, 168, 603
- Malmberg et al. (2011) Malmberg D., Davies M. B., Heggie D. C., 2011, MNRAS, 411, 859
- Manara et al. (2018) Manara C. F., Morbidelli A., Guillot T., 2018, Astronomy and Astrophysics, 618, L3
- Mann et al. (2014) Mann R. K., et al., 2014, ApJ, 784, 82
- Murillo et al. (2013) Murillo N. M., Lai S.-P., Bruderer S., Harsono D., van Dishoeck E. F., 2013, A&A, 560, A103
- Najita & Kenyon (2014) Najita J. R., Kenyon S. J., 2014, MNRAS, 445, 3315
- Navarro et al. (2019) Navarro M. G., Contreras Ramos R., Minniti D., Pullen J., Capuzzo-Dolcetta R., Lucas P. W., 2019, arXiv e-prints, p. arXiv:1907.04339
- Nicholson et al. (2019) Nicholson R. B., Parker R. J., Church R. P., Davies M. B., Fearon N. M., Walton S. R. J., 2019, arXiv:1902.11094 [astro-ph]
- Nixon et al. (2018) Nixon C. J., King A. R., Pringle J. E., 2018, Monthly Notices of the Royal Astronomical Society, 477, 3273
- O’dell & Wen (1994) O’dell C. R., Wen Z., 1994, The Astrophysical Journal, 436, 194
- Olczak et al. (2006) Olczak C., Pfalzner S., Spurzem R., 2006, ApJ, 642, 1140
- Olczak et al. (2008) Olczak C., Pfalzner S., Eckart A., 2008, A&A, 488, 191
- Olczak et al. (2010) Olczak C., Pfalzner S., Eckart A., 2010, A&A, 509, A63
- Owen et al. (2010) Owen J. E., Ercolano B., Clarke C. J., Alexander R. D., 2010, Monthly Notices of the Royal Astronomical Society, 401, 1415
- Parravano et al. (2003) Parravano A., Hollenbach D. J., McKee C. F., 2003, ApJ, 584, 797
- Pascucci et al. (2016) Pascucci I., et al., 2016, ApJ, 831, 125
- Pelupessy & Portegies Zwart (2012) Pelupessy F. I., Portegies Zwart S., 2012, MNRAS, 420, 1503
- Pfalzner et al. (2018) Pfalzner S., Bhandare A., Vincke K., Lacerda P., 2018, ApJ, 863, 45
- Plummer (1911) Plummer H. C., 1911, MNRAS, 71, 460
- Portegies Zwart (2016) Portegies Zwart S. F., 2016, MNRAS, 457, 313
- Portegies Zwart & McMillan (2018) Portegies Zwart S. P., McMillan S., 2018, Astrophysical Recipes: The Art of AMUSE, 1st edn. AAS-IOP Astronomy, Institute of Physics Publishing, Great Britain
- Portegies Zwart & Verbunt (1996) Portegies Zwart S. F., Verbunt F., 1996, A&A, 309, 179
- Portegies Zwart et al. (2009) Portegies Zwart S., et al., 2009, New Astron., 14, 369
- Portegies Zwart et al. (2010) Portegies Zwart S. F., McMillan S. L. W., Gieles M., 2010, ARA&A, 48, 431
- Portegies Zwart et al. (2018) Portegies Zwart S., Pelupessy I., van Elteren A., Wijnen T. P. G., Lugaro M., 2018, A&A, 616, A85
- Reche et al. (2009) Reche R., Beust H., Augereau J.-C., 2009, A&A, 493, 661
- Ribas et al. (2014) Ribas t., Mer\’in B., Bouy H., Maud L. T., 2014, Astronomy and Astrophysics, 561, A54
- Richert et al. (2018) Richert A. J. W., Getman K. V., Feigelson E. D., Kuhn M. A., Broos P. S., Povich M. S., Bate M. R., Garmire G. P., 2018, Monthly Notices of the Royal Astronomical Society, 477, 5191
- Rodriguez et al. (2018) Rodriguez J. E., et al., 2018, The Astrophysical Journal, 859, 150
- Rodriguez-Merino et al. (2005) Rodriguez-Merino L. H., Chavez M., Bertone E., Buzzoni A., 2005, ApJ, 626, 411
- Rosotti & Clarke (2018) Rosotti G. P., Clarke C. J., 2018, Monthly Notices of the Royal Astronomical Society, 473, 5630
- Rosotti et al. (2014) Rosotti G. P., Dale J. E., de Juan Ovelar M., Hubber D. A., Kruijssen J. M. D., Ercolano B., Walch S., 2014, MNRAS, 441, 2094
- Rosotti et al. (2017) Rosotti G. P., Clarke C. J., Manara C. F., Facchini S., 2017, Monthly Notices of the Royal Astronomical Society, 468, 1631
- Rosotti et al. (2019) Rosotti G. P., Tazzari M., Booth R. A., Testi L., Lodato G., Clarke C., 2019, arXiv:1905.00019 [astro-ph]
- Ryu et al. (2019) Ryu Y.-H., et al., 2019, arXiv:1905.04870 [astro-ph]
- Salyk et al. (2014) Salyk C., Pontoppidan K., Corder S., Muñoz D., Zhang K., Blake G. A., 2014, The Astrophysical Journal, 792, 68
- Shadmehri et al. (2018) Shadmehri M., Ghoreyshi S. M., Alipour N., 2018, arXiv:1809.07304 [astro-ph]
- Spitzer (1987) Spitzer L., 1987, Dynamical Evolution of Globular Clusters
- Steinhausen & Pfalzner (2014) Steinhausen M., Pfalzner S., 2014, Astronomy and Astrophysics, 565, A32
- Tazzari et al. (2017) Tazzari M., et al., 2017, A&A, 606, A88
- Throop & Bally (2008) Throop H. B., Bally J., 2008, The Astronomical Journal, 135, 2380
- Toonen et al. (2012) Toonen S., Nelemans G., Zwart S. P., 2012, A&A, 546, A70
- Trapman et al. (2019) Trapman L., Facchini S., Hogerheijde M. R., van Dishoeck E. F., Bruderer S., 2019, arXiv:1903.06190 [astro-ph]
- Vincke & Pfalzner (2016) Vincke K., Pfalzner S., 2016, ApJ, 828, 48
- Vincke & Pfalzner (2018) Vincke K., Pfalzner S., 2018, ApJ, 868, 1
- Vincke et al. (2015) Vincke K., Breslau A., Pfalzner S., 2015, A&A, 577, A115
- Wijnen et al. (2016) Wijnen T. P. G., Pols O. R., Pelupessy F. I., Portegies Zwart S., 2016, A&A, 594, A30
- Wijnen et al. (2017) Wijnen T. P. G., Pols O. R., Pelupessy F. I., Portegies Zwart S., 2017, A&A, 602, A52
- Williams (2012) Williams J. P., 2012, Meteoritics and Planetary Science, 47, 1915
- Williams & Cieza (2011) Williams J. P., Cieza L. A., 2011, ARA&A, 49, 67
- Winter et al. (2018a) Winter A. J., Clarke C. J., Rosotti G., Booth R. A., 2018a, MNRAS, 475, 2314
- Winter et al. (2018b) Winter A. J., Clarke C. J., Rosotti G., Ih J., Facchini S., Haworth T. J., 2018b, MNRAS, 478, 2700
- Winter et al. (2019a) Winter A. J., Clarke C. J., Rosotti G. P., 2019a, arXiv:1902.04586 [astro-ph]
- Winter et al. (2019b) Winter A. J., Kruijssen J. M. D., Chevance M., Keller B. W., Longmore S. N., 2019b, arXiv:1907.04602 [astro-ph]
- Wright et al. (2010) Wright N. J., Drake J. J., Drew J. E., Vink J. S., 2010, The Astrophysical Journal, 713, 871
- Yusef-Zadeh et al. (2015) Yusef-Zadeh F., Roberts D. A., Wardle M., Cotton W., Schödel R., Royster M. J., 2015, The Astrophysical Journal, 801, L26
- Yusef-Zadeh et al. (2017) Yusef-Zadeh F., Wardle M., Kunneriath D., Royster M., Wootten A., Roberts D. A., 2017, The Astrophysical Journal, 850, L30
- de Juan Ovelar et al. (2012) de Juan Ovelar M., Kruijssen J. M. D., Bressert E., Testi L., Bastian N., Cánovas H., 2012, A&A, 546, L1
- van Elteren et al. (2019) van Elteren A., Portegies Zwart S., Pelupessy I., Cai M. X., McMillan S. L. W., 2019, Astronomy and Astrophysics, 624, A120
- van Terwisga et al. (2019) van Terwisga S. E., Hacar A., van Dishoeck E. F., 2019, Astronomy and Astrophysics, 628, A85
- van ’t Hoff et al. (2018) van ’t Hoff M. L. R., Tobin J. J., Harsono D., van Dishoeck E. F., 2018, A&A, 615, A83