∎
e1e-mail: nicola.casali@roma1.infn.it
Phonon and light read out of a Li2MoO4 crystal with multiplexed kinetic inductance detectors.
Abstract
Molybdenum based crystals such as Li2MoO4 and CaMoO4 are emerging as leading candidates for next generation experiments searching for neutrino-less double beta decay with cryogenic calorimeters (CUPID, AMoRE). The exquisite energy resolution and high radio-purity of these crystals come at the cost of a potentially detrimental background source: the two neutrinos double beta decay of 100Mo. Indeed, the fast half-life of this decay mode, combined with the slow response of cryogenic calorimeters, would result in pile-up events in the energy region of interest for neutrino-less double beta decay, reducing the experimental sensitivity. This background can be suppressed using fast and high sensitivity cryogenic light detectors, provided that the scintillation time constant itself does not limit the time resolution. We developed a new detection technique exploiting the high sensitivity, the fast time response and the multiplexing capability of Kinetic Inductance Detectors. We applied the proposed technique to a cm3 Li2MoO4 crystal, which was chosen as baseline option for CUPID. We measured simultaneously both the phonon and scintillation signals with KIDs. We derived the scintillation time constant of this compound at millikelvin temperatures obtaining s, constant between 10 and 190 mK.
Keywords:
Kinetic Inductance Detectors Double beta decay scintillation detector1 Introduction
Neutrinos are the particles of the Standard Model that best hide their fundamentals properties. Despite being the most abundant particles in the Universe, their low mass and cross section make them also the most elusive ones. The mass scale as well as their nature (Dirac or Majorana) are still unknown, more than 60 years after their first detection. Demonstrating the existence of the neutrino-less double beta decay (DBD) Furry would offer the possibility to answer both questions Feruglio:2002af ; Strumia:2005tc . This reaction is a hypothesized nuclear transition in which a nucleus decays emitting two electrons and no neutrinos: (A,Z)(A,Z+2)+2e-. The signal produced would consist of two electrons with a total kinetic energy equal to the Q-value of the transition. The current lower limits on the half-life of this process are of the order of yr, depending on the nucleus. On the contrary, the two neutrinos double beta decay (DBD), is a well establish second order process of the Standard Model: (A,Z)(A,Z+2)+2e-+2. The signal consists of two electrons with a continuous energy spectrum up to the Q-value of the transition. This process was measured for 11 nuclei with half-lives ranging from yr Barabash:2019nnr .
Next generation experiments searching for DBD are conceived to improve their sensitivity by increasing the source mass and reducing the background. The CUPID (CUORE Upgrade with Particle Identification) interest group Wang:2015taa proposes a next generation DBD experiment upgrading the cryogenic calorimetric technique developed by the CUORE experiment Artusa:2014lgv , with the aim of decreasing the background from to counts/(keV kg yr). The main background of CUORE comes from particles, as described in Ref. Alduino:2017qet . Therefore, the first step to achieve the goal of CUPID consists in rejecting such kind of interactions. This discrimination is achieved by coupling each calorimeter to a light detector in order to disentangle from interactions, thanks to the different light yield and time development of scintillation light. The potential of the dual read out was convincingly proved by the pilot experiment CUPID-0 Azzolini:2018tum , with an array of ZnSe scintillating calorimeters 95% enriched in 82Se, and by the LUMINEU Armengaud:2017hit and AMoRE Alenkov:2019jis projects, with similar detectors based respectively on Li2MoO4 95% enriched in 100Mo and CaMoO4 depleted in 48Ca and enriched in 100Mo. Li2MoO4 offers higher radio-purity and better energy resolution compared to ZnSe and, in contrast to CaMoO4 does not require a further depletion of Ca for applications in double beta decay searches. For these reasons, it was chosen as baseline for the CUPID project. Unfortunately, 100Mo, with a half-life of () y Barabash:2011 is one of the fastest DBD emitter: a Li2MoO4 enriched crystal has an intrinsic activity of about 10 mBq/kg coming from the 100Mo DBD decay. The typical time response of a cryogenic calorimeter exploiting the NTD Ge thermistors technology is 10 - 100 ms for the rise time and 50 - 400 ms for the decay time Artusa:2014lgv ; Azzolini:2018yye , leading to a non-negligible probability of pile-up of two DBD events. The estimated background produced by DBD pile-up in the DBD energy region by a Li2100MoO4 enriched crystal of 300 g is of the order of counts/(keV kg yr) Chernyak1 . This background matches the requirements of CUPID but it would prevent a further sensitivity enhancement.
While an R&D devoted to the size of the NTD Ge thermistor could be beneficial, it is hard to envision that it would largely improve the time resolution. Nevertheless, two events that are indistinguishable by the NTD Ge of the Li2MoO4 crystal could be disentangled studying its scintillation signal. Indeed, since the time constants of cryogenic calorimeters decrease abruptly with the mass of the absorber, we can use the faster response of the light detector (50 times less massive that Li2MoO4 crystal) to separate pile-up events. For example, if we consider the cryogenic light detectors used by the CUPID-0 experiment (4.4 cm in diameter and 170 m thick Ge slab with a weight of about 6 grams, read by NTD Ge thermistors) rise and decay times result in 4 and 8 ms, respectively Azzolini:2018yye . For this reason, the current studies for the suppression of the DBD random coincidences pile-up are focused on the scintillation light measured by the light detector Chernyak2 . To our knowledge, the fastest light detectors based on NTDs show a time response of 0.5-1 ms Barucci:2019ghi . A further improvement can be attained, but it would make sense only if the scintillation constant of the Li2MoO4 itself does not limit the time resolution. Nowadays the scintillation time constant of Li2MoO4 below 20 K is not known CHEN2018225 . A slow time constant (1 ms) would limit the time resolution, preventing a further background suppression.
In this contribution, we propose a new technological approach for the dual read out of light and phonon in a scintillating cryogenic calorimeter exploiting the Kinetic Inductance Detector (KID) technology. The fast time response and high sensitivity of KIDs allow us to measure for the first time the scintillation time constant at 10 mK of a Li2MoO4 crystal.
2 Phonon-Mediated Kinetic Inductance Detectors
In the last years a new technology, first developed for astrophysical applications, was proposed for cryogenic light detection: the Kinetic Inductance Detectors bay . In a superconductor cooled well below the critical temperature, the resistance to DC current is zero because the electrons, bounded in Cooper pairs, are not scattered by the lattice. If an AC current is applied, the superconductor shows the so called Kinetic Inductance, which is created by the inertia of the Cooper pairs that take some time (because of their mass) to change direction following the one of the applied EM field. Coupling a capacitance to the superconductor, a resonator with a high quality factor () can be realized. The resonant frequency is given by , where depends on the density of Cooper pairs. Since their binding energy is of the order of hundreds of eV, even a small energy release in the superconductor is able to break a high number of Cooper pairs, resulting in a change of the kinetic inductance . The signal is obtained by exciting the circuit at the resonant frequency, and by monitoring the phase and amplitude variations, induced by energy releases, of the wave transmitted past the resonator. These devices were successfully applied in astro-physics providing outstanding performances in terms of energy resolution (eV), fast time response (10 s), and multiplexing capability: many KIDs can be coupled to the same read out line (up to 1000 with 4 kHz bandwidth per detector vanRantwijk:2015sta ) , and be simultaneously monitored making them resonate at slightly different frequencies by adjusting the layout of the capacitor and/or inductor of the circuit Mazin:2010pz .
The only limit for application in particle physics is their poor active surface, which is of few mm2. This limitation can be overcome exploiting the phonon-mediated approach proposed by Swenson et al. Swenson:2010 and Moore et al. Moore:2012 : KIDs are deposited on an insulating substrate featuring a surface of several cm2. Interactions in the substrate produce phonons, which travel in the substrate itself until a fraction of them are absorbed by the KID.
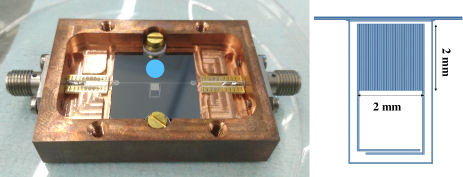
In this work, we apply the phonon mediated technique to a cm3 Li2MoO4 scintillating calorimeter for the dual read out of phonons and scintillation light signals. Concerning the phonons read out, we propose for the first time to use KIDs coupled to a macro-calorimeter. Concerning the light measurement, we took advantage from the experience of the CALDER (Cryogenic wide Area Light Detector with Excellent Resolution) project Battistelli:2015vha , which successfully developed cryogenic light detector based on the KID technology. In the first phase of the R&D activities, a Si substrate ( cm2 and 300 m thick) was used as phonon mediator; the superconductor resonator was made by aluminum, a well-known material for KID application. The best prototype developed in this first phase (shown in Fig. 1) consists of one aluminum resonator 60 nm thick as this thickness value offers a good compromise between detector sensitivity and quality of the superconductor. The detector reached a baseline energy resolution of about 80 eV RMS, constant in a temperature range from 10 mK up to 200 mK Bellini:2016lgg . Because of its robust performance we chose this prototype, even if CALDER proved that more sensitive superconductors provided an even better energy resolution cruciani2018 .
3 Detector set up
We face to a cm3 Li2MoO4 crystal of 24.2 grams the KID based light detector showed in Fig. 1. In order to select only scintillation light events coming from Li2MoO4 and disentangle them from direct energy deposition coming from environmental radioactivity (, , and ), we measured also the phonons produced in the Li2MoO4 crystal. To efficiently select coincidence events between the light detector and the Li2MoO4 crystal, the time resolutions of the two detectors must be comparable. For this reason, we instrumented also the Li2MoO4 crystal with a second KID.
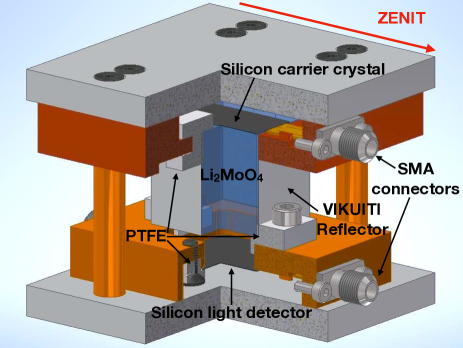
Because of its hygroscopicity and other technical difficulties in depositing thin metallic layers on the Li2MoO4 crystal, we used the carrier approach: an Al KID, identical to the resonator depicted in Fig. 1 (except for one capacitor finger that was reduced to tune the resonance frequency) was evaporated on a Si substrate, cm2 300 m thick, which was then glued with EPO-TEK 301-2 on the Li2MoO4 crystal surface. The Si substrate works as carrier, transporting the phonons produced in the Li2MoO4 crystal by interacting particles to the KID deposited on it. This is the same technique that the CRESST experiment cresst successfully applied to transition edge sensors tes . The layout of the experimental set up is showed in Fig 2. Thank to the multiplexing capability of KIDs we coupled to the same read-out line both the phonon and light detectors. The signal transmitted past the two resonators is showed in Fig. 3. This is the first time in which the carrier approach is applied to KIDs, and in which a macro-calorimeter is operated with KIDs. We also faced to the light detector an optical fiber, in order to illuminate with a 400 nm room temperature LED lamp the light detector (see Fig 1). We exploited such light pulses to energy calibrate the light detector and also study the KID response function to fast burst (100 ns) of optical photons.
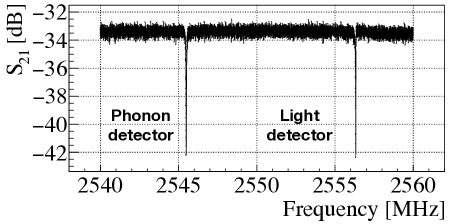
The devices were mounted in the coldest point of a dry 3He/4He dilution refrigerator111Oxford Instruments, Dry Dilution Refrigerator Triton 400. and cooled down to 10 mK. The resonators were coupled in series to the read out line, excited and probed with a combination of two monochromatic tones, each one tuned at the resonant frequencies GHz (Li2MoO4 crystal) and GHz (light detector) (see Fig. 3). The output signals were fed into a CITLF3 SiGe cryogenic low noise amplifier ampli , down-converted at room temperature using a superheterodyne electronics and then digitized with an acquisition card at a sampling frequency of 500 kSPS Bourrion:2011gi .
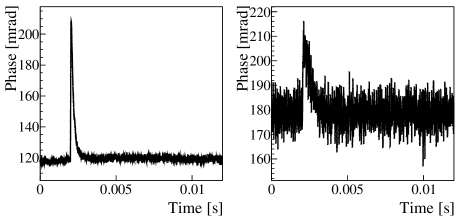
In Fig. 4 the typical phase pulses filtered with a 180 kHz low pass filter are shown. Because of the better signal-to-noise ratio of the phonon channel, we used it to trigger both detectors. We used the maximum of the pulse as estimator of the energy release. To better evaluate this parameter we applied a software matched filter algorithm Gatti:1986cw ; Radeka:1966 to the acquired pulses.
As showed in Fig. 2, the two Si substrates are facing each other. We assembled the detector holder by ensuring that this axis resulted horizontal. Since the majority of cosmic rays (CRs) come from the vertical direction, in such configuration we can maximize the amount of CRs that crossing only the Li2MoO4 crystal without crossing the Si substrates. Thus, the majority of the interactions will produce both a clean phonon signal in the Si carrier crystal and a clean scintillation light signal in the light detector. Nevertheless, a fraction of CRs will cross both the Li2MoO4 crystal and one of the two Si substrates (light detector or carrier crystal) depositing energy by ionisation and masking the searched signals. These events must be rejected:
-
•
if the CR ionizes the Si light detector, the energy released will be of the order of hundreds of keV saturating the KID response. This type of events can be easily tagged.
-
•
if the CR crosses the Si carrier crystal glued on to the Li2MoO4 crystal, the phonon signal will be amplified because of the direct ionization of the Si substrate. As a consequence, the measured phonon signal will be larger with respect to the case in which the CR crosses only the Li2MoO4 crystal.
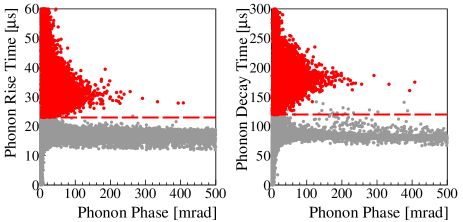
We expect also a clear difference in the pulse time development of the phonon channel for this last category of events. Indeed, as shown in Fig 5, we can recognize two populations of pulses triggered by the phonon detector: one with a slower rise and decay time and with a lower maximum energy, and the other faster and with a higher maximum energy.
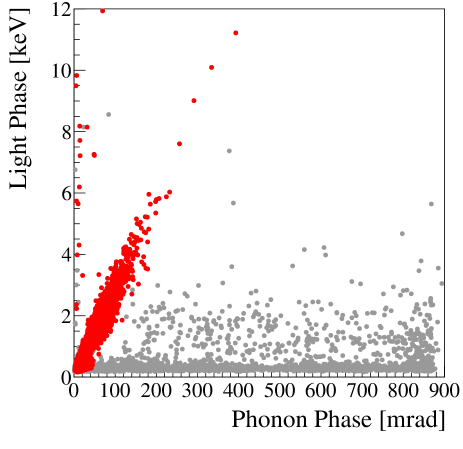
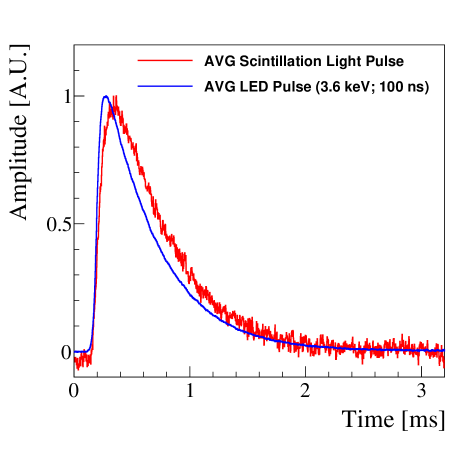
Selecting the pulses with a slower time development through the cut showed in Fig 5, we obtained the events marked in red in the phonon-light scatter plot of Fig. 6. For these events, the light yield measured by the light detector and its trend as function of the energy measured in the phonon channel is compatible with CRs crossing the Li2MoO4 crystals Cardani:2013dia . The remaining events marked in grey are due to CRs crossing also the Si carrier crystal. Finally, we averaged the waveforms acquired by the light detector in order to reduce random noise fluctuations. We selected only the events marked in red in the scatter plot of Fiq. 6 with a phonon signal amplitude between 80 and 140 mrad, since they have a light signal with an energy similar to the one deposited with the LED burst. The resulting average pulse is showed in Fig. 7 together with the average pulse made exploiting a 3.6 keV LED burst 100 ns long.
4 KID response model
The KIDs response to instantaneous energy deposition on Si substrate can be modelled exploiting three time constants Martinez:2018ezx : the time of arrival of phonons (), i.e. the characteristic time in which the athermal phonons produced in an energy deposition on the substrate arrive to the KID, the time constant of the resonator (), and the time in which quasiparticles recombine back into Cooper’s pairs (). The time development of the phase signal is a convolution of these three effects:
| (1) |
where is the pulse amplitude. If the energy deposition has a temporal evolution, as is the case of scintillation light, the resulting KID signal is a convolution of Eq. 1 with the exponential time development of the scintillation light (). Thus, the pulses produced by scintillation light are described by:
| (2) |
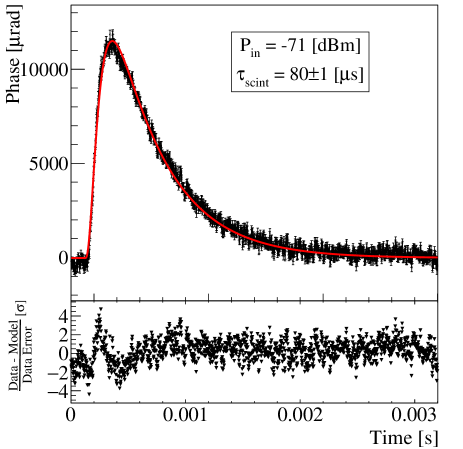
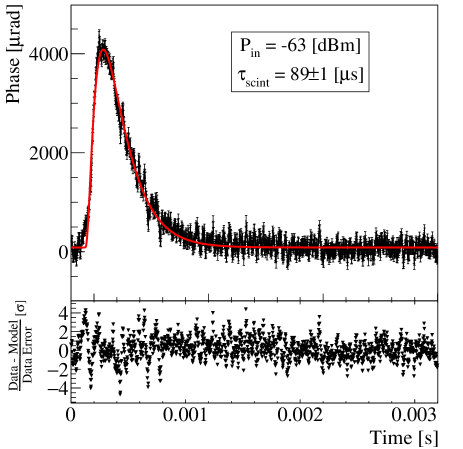
According to these models, we use Eq. 1 to fit the average LED pulse in order to evaluate and ( is fixed to 15 s by the resonator parameters) obtaining s and s. Then, fixing the three time constants, we fit the average pulse evaluated on the scintillation signal using Eq. 2 (see Fig. 8) in order to evaluate the remaining , which results to be s. In order to understand the systematic error on introduced by the procedure used to evaluate this parameter, we increased the input microwave power used to excite the light detector resonator. Indeed, according to Ref. Cruciani:2016moq the microwave power increases the quasi-particle recombination probability decreasing . In such a way we increase the time response of the light detector decreasing by a factor of 2.5. Then, we repeated the analysis procedure on both LED and scintillation average pulses (see Fig. 9) obtaining s. The difference between the two values of can be ascribed to approximations in the KID response model Martinez:2018ezx and to a non-perfect pulses alignment in the averaging procedure due to trigger instabilities and noise fluctuations. Nevertheless, we account for these effects as a systematic uncertainty: we average the two time constants and we identified its deviation as the systematic uncertainty of the measurement procedure: . This value is consistent with the one measured at 20 K in Ref. CHEN2018225 . Finally we measured at 50, 100 and 190 mK with an input power of -71 dBm and did not appreciated variations with respect to the value obtained at 10 mK.
5 Conclusions
In this work we applied for the first time the KID technology to macro-absorbers, measuring the phonon and light signals coming from a Li2MoO4 crystal crossed by cosmic rays. We proved the potential of the multiplexed read-out by measuring the two detectors with a single read-out line, and we demonstrated that the carrier technique can be used in this field.
This experiment allowed to measure a parameter of interest for future DBD experiments based on Li2MoO4, namely its scintillation time constant at millikelvin temperatures. We accounted for the systematic uncertainty due to the KID response model, obtaining s, in agreement with previous measurements performed with a different technique down to 20 K. With a focused R&D activity on the light detector, it will be possible to decrease the background coming from pile-up events, paving the way to future DBD experiments with an increasing discovery potential.
Acknowledgements.
This work was supported by the European Research Council (FP7/2007-2013) under Contract No. CALDER No. 335359 and by the Italian Ministry of Research under the FIRB Contract No. RBFR1269SL. The authors thank the LUMINEU collaboration for providing a high-quality lithium molybdate crystal, and Th. Redon (CSNSM, Orsay) for the preparation of the sample used in this experiment. The authors also thanks F. Petricca, K. Schäffner and N. Ferreiro for the useful discussion about carrier crystal approach and the personnel of INFN Sezione di Roma for the technical support, in particular M. Iannone and A. Girardi.References
- (1) W. H. Furry, Phys.Rev.Lett. 56, 1184 (1936).
- (2) F. Feruglio, A. Strumia and F. Vissani, Nucl. Phys. B 637, 345 (2002) Addendum: [Nucl. Phys. B 659, 359 (2003)]. DOI 10.1016/S0550-3213(02)00345-0,10.1016/S0550-3213(03)00228-1
- (3) A. Strumia and F. Vissani, Nucl. Phys. B 726, 294 (2005). DOI 10.1016/j.nuclphysb.2005.07.031
- (4) A. S. Barabash, DOI 1907.06887
- (5) G. Wang, et al., arXiv:1504.03612 (2015)
- (6) D.R. Artusa, et al., Adv. High Energy Phys. 2015, 879871 (2015). DOI 10.1155/2015/879871
- (7) C. Alduino et al. [CUORE Collaboration], Eur. Phys. J. C 77 no.8, 543 (2017). DOI 10.1140/epjc/s10052-017-5080-6.
- (8) O. Azzolini et al. [CUPID Collaboration], Eur. Phys. J. C 78 428 (2018). DOI 10.1140/epjc/s10052-018-5896-8
- (9) E. Armengaud et al., Eur. Phys. J. C 77 no.11, 785 (2017). DOI 10.1140/epjc/s10052-017-5343-2
- (10) V. Alenkov et al., DOI arXiv:1903.09483.
- (11) A. Barabash, Phys. Rev. C 81, 035501, (2011). DOI 10.1103/PhysRevC.81.035501
- (12) O. Azzolini et al., Eur. Phys. J. C 78 no.9, 734 (2018). DOI 10.1140/epjc/s10052-018-6202-5
- (13) D. M. Chernyak et al., Eur. Phys. J. C 74, 2913 (2014) DOI 10.1140/epjc/s10052-014-2913-4
- (14) D. M. Chernyak et al., Eur. Phys. J. C 77, 3 (2017) DOI 10.1140/epjc/s10052-016-4565-z
- (15) M. Barucci et al., Nucl. Instrum. Meth. A 935, 150 (2019) DOI 10.1016/j.nima.2019.05.019
- (16) P. Chen et al., Materials Letters 215 225 - 228 (2018). DOI 10.1016/j.matlet.2017.12.113
- (17) P. K. Day, H. G. LeDuc, B. A. Mazin, A. Vayonakis, and J. Zmuidzinas. Nature, 425, 817-821 (2013). DOI 10.1038/nature02037
- (18) J. van Rantwijk, M. Grim, D. van Loon, S. Yates, A. Baryshev and J. Baselmans, IEEE Trans. Microwave Theor. Tech. 64, 1876 (2016). DOI 10.1109/TMTT.2016.2544303
- (19) B. A. Mazin, K. O’Brien, S. McHugh, B. Bumble, D. Moore, S. Golwala and J. Zmuidzinas, Proc. SPIE Int. Soc. Opt. Eng. 7735 (2010) 773518 DOI 10.1117/12.856440
- (20) L. J. Swenson, et al., J. Appl. Phys. 96 (2010) 263511. DOI 10.1063/1.3459142
- (21) D. C. Moore, et al., J. Appl. Phys. 100 (2012) 232601. DOI 10.1063/1.4726279
- (22) E. Battistelli, et al.,Eur. Phys. J. C 75, 8 (2015) 353. DOI 10.1140/epjc/s10052-015-3575-6
- (23) L. Cardani, et al., Appl. Phys. Lett. 110, no. 3, 033504 (2017). DOI 10.1063/1.4974082
- (24) L. Cardani et al., Supercond. Sci. Technol. 31 (2018) 075002. DOI 10.1088/1361-6668/aac1d4
- (25) R Strauss, et al., Eur. Phys. J. C 75, 352 (2015) . DOI 10.1140/epjc/s10052-015-3572-9
- (26) J. Rothe, et al., J. Low Temp. Phys. (2018). DOI 10.1007/s10909-018-1944-x
- (27) http://radiometer.caltech.edu/datasheets/amplifiers/CITLF4.pdf
- (28) O. Bourrion, et al., JINST 6, P06012 (2011). DOI 10.1088/1748-0221/6/06/P06012
- (29) E. Gatti, P.F. Manfredi, Riv. Nuovo Cimento 9, 1 (1986)
- (30) V. Radeka, N. Karlovac, Nucl. Instrum. Meth. 52, 86 (1967)
- (31) L. Cardani, et al., JINST 8, P10002 (2013) DOI 10.1088/1748-0221/8/10/P10002
- (32) M. Martinez, L. Cardani, N. Casali, A. Cruciani, G. Pettinari and M. Vignati, Phys. Rev. Applied. 11, 064025 (2019). DOI 10.1103/PhysRevApplied.11.064025
- (33) A. Cruciani, et al., J. Low. Temp. Phys. 184, no. 3-4, 859 (2016). DOI 10.1007/s10909-016-1574-0