Recommending Related Tables
Abstract.
Tables are an extremely powerful visual and interactive tool for structuring and manipulating data, making spreadsheet programs one of the most popular computer applications. In this paper we introduce and address the task of recommending related tables: given an input table, identifying and returning a ranked list of relevant tables. One of the many possible application scenarios for this task is to provide users of a spreadsheet program proactively with recommendations for related structured content on the Web. At its core, the related table recommendation task boils down to computing the similarity between a pair of tables. We develop a theoretically sound framework for performing table matching. Our approach hinges on the idea of representing table elements in multiple semantic spaces, and then combining element-level similarities using a discriminative learning model. Using a purpose-built test collection from Wikipedia tables, we demonstrate that the proposed approach delivers state-of-the-art performance.
1. Introduction
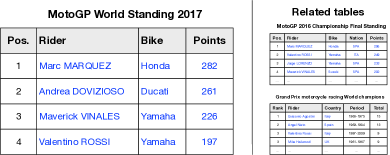
Tables are an extremely powerful visual and interactive tool for structuring and manipulating data. The Web contains vast amounts of HTML tables (Lehmberg et al., 2016) and there is a growing body of research utilizing relational information stored in them (Ritze et al., 2016; Ibrahim et al., 2016; Bhagavatula et al., 2015; Chirigati et al., 2016; Zhang and Balog, 2018b). Table retrieval has been recognized as an important search task (Cafarella et al., 2008; Zhang and Balog, 2018a; Pimplikar and Sarawagi, 2012). In this paper, we propose and address the task of recommending related tables: given an input relational table, identify and return a ranked list of relevant tables that contain novel information (additional entities and/or attributes). The main difference from previous work is that instead of requiring the user to express her information need explicitly, by formulating a keyword query, we can proactively recommend related tables based on any existing table as input. This input table may be an incomplete table the user currently works on or a complete table that can be found on the Web. Figure 1 illustrates the idea. Table recommendations could be helpful, for example, in equipping spreadsheet applications with a smart assistance feature for finding related content. Alternatively, it could be implemented as a browser plugin that can be activated upon encountering a table on a webpage to find related tables (e.g., for comparison or fact validation).
At its core, the related table recommendation task boils down to computing a similarity score between a pair of tables, the input and candidate tables, which we shall refer to as table matching. We note that table matching is a core component in many other table-related tasks beyond search and recommendation, such as table augmentation (Lehmberg et al., 2015; Das Sarma et al., 2012; Yakout et al., 2012; Ahmadov et al., 2015), question answering on tables (Pimplikar and Sarawagi, 2012), and table interpretation (Venetis et al., 2011; Bhagavatula et al., 2015). Previous approaches may be divided into two main categories: (i) extracting a keyword query from certain table elements and scoring candidate tables using that query, e.g., (Lehmberg et al., 2015; Ahmadov et al., 2015) (ii) splitting both the query and candidate tables into several elements and performing element-wise matching, e.g., (Das Sarma et al., 2012; Yakout et al., 2012; Nguyen et al., 2015). Commonly considered table elements include table caption, table entities, column headings, and table data (cell values).
Existing approaches for table matching suffer from three main shortcomings. First, they rely on ad hoc similarity measures, tailor-made for each table element. Second, even though multiple table elements (caption, column headings, cell values, etc.) have been considered, a principled way of combining these element-level similarities is lacking, along with a systematic assessment of the contribution of the various table elements in such a combination. Third, the possibility of matching elements of different types has not been explored yet (e.g., comparing the input table’s headers against the candidate table’s cell values). Motivated by the above issues, our the main research objective is to develop an effective and theoretically sound table matching framework for measuring and combining table element level similarity, without resorting to hand-crafted features. We propose an element-oriented table matching framework that hinges on the idea of representing table elements in multiple semantic spaces. We develop multiple methods for measuring the similarity between table elements; these are applicable to both elements of the same type (element-wise matching) and of different types (cross-element matching). Finally, we combine element-level similarities using a discriminative learning approach. Through our experimental evaluation, we seek to answer the following specific research questions:
- RQ1:
-
Which of the semantic representations (word-based, graph-based, or entity-based) is the most effective for modeling table elements?
- RQ2:
-
Which of the two element-level matching strategies performs better, element-wise or cross-element?
- RQ3:
-
How much do different table elements contribute to recommendation performance?
For experimental evaluation, we develop a test collection based on Wikipedia tables. We first present a feature-based method that combines numerous hand-crafted element-level similarity measures from the literature in a discriminative learning approach. This method, referred to as HCF, improves over the best existing baseline method by almost 30% in terms of NDCG@10. We then show that our proposed novel approach, termed CRAB, based on element-level semantic representations and matching, performs on par with this strong combination of hand-crafted features. Our analysis reveals that cross-element matching, while seemingly unintuitive, can indeed be beneficial. We further demonstrate that recommendation performance increases as the input table grows, either horizontally or vertically, which attests to the capability of our table matching framework to effectively utilize larger inputs. In summary, this paper makes the following contributions:
-
•
We introduce and address the related table recommendation task, adapt existing methods, and present a discriminative approach that combines hand-crafted features from the literature (Sect. 2).
-
•
We develop a general a table matching framework and specific instantiations of this framework (Sect. 3).
- •
The resources developed within this paper will be made publicly available upon acceptance.
2. Using Hand-Crafted Features
We present an approach, termed HCF, which combines various table similarity measures from the literature in a feature-based ranking framework. Additionally, we introduce a set of features to describe the input and candidate tables on their own. As we will show in our experimental section, this approach outperforms the best method from the literature by almost 30%. Therefore, even though the individual features are not regarded as novel, the rich feature set we introduce here does represent an important contribution.
2.1. Recommender Framework
The objective of table matching is to compute the similarity between an input table and a candidate table , expressed as . Formally, our goal is to learn a recommender model that gives a real-valued score for an input and candidate table pair, or equivalently, to the corresponding feature vector . The feature vector is defined as:
| (1) | ||||
There are two main groups of features. The first features are based on the characteristics of the input and candidate tables, respectively ( features each). These features are discussed in Sect. 2.3. Then, features are used for representing the similarity between a pair of tables; these are described in Sect. 2.2.
2.2. Table Similarity Features
On the high level, all the existing methods operate by (i) subdividing tables into a number of table elements, such as page title (), table caption (), table topic (), column headings (), table entities (), and table data (), (ii) measuring the similarity between various elements of the input and candidate tables, and (iii) combining these element-level similarities into a final score. We adapt all element-level similarity scores from the individual methods (detailed in Sect. 5.1) as table similarity features. These are shown in Table 1, grouped by table elements.
| Element / Feature | Source | |
| Page title () | ||
| InfoGather page title IDF similarity score | (Yakout et al., 2012) | |
| Table headings () | ||
| MSJE heading matching score | (Lehmberg et al., 2015) | |
| Schema complement schema benefit score | (Das Sarma et al., 2012) | |
| InfoGather heading-to-heading similarity | (Yakout et al., 2012) | |
| Nguyen et al. heading similarity | (Nguyen et al., 2015) | |
| Table data () | ||
| InfoGather column-to-column similarity | (Yakout et al., 2012) | |
| InfoGather table-to-table similarity | (Yakout et al., 2012) | |
| Nguyen et al. table data similarity | (Nguyen et al., 2015) | |
| Table entities () | ||
| Entity complement entity relatedness score | (Das Sarma et al., 2012) | |
| Schema complement entity overlap score | (Das Sarma et al., 2012) | |
2.3. Table Features
Additionally, we present a set of features that characterize individual tables. Table features are computed for both the input and candidate tables. They might be thought of as analogous to the query and document features, respectively, in document retrieval (Macdonald et al., 2012). In fact, we adapt some features from document retrieval, such as query IDF score (Qin et al., 2010). Specifically, we compute IDF for the table caption and page title elements, by summing up the term IDF scores: . We further consider general table descriptors from (Bhagavatula et al., 2013), like the number of table rows, columns, and empty cells. Another group of features is concerned with the page in which the table is embedded. The includes page connectivity (inLinks and outLinks), page popularity (page counts), and the table’s importance within the page (tableImportance and tablePageFraction). Table 2 provides an overview of table features.
3. The CRAB Approach
This section presents our novel approach for table matching. Our contributions are twofold. We introduce a general element-oriented table matching framework in Sect. 3.1 followed by specific instantiations of this framework, referred to as CRAB, in Sect. 3.2.
3.1. Element-Level Table Matching Framework
We combine multiple table quality indicators and table similarity measures in a discriminative learning framework. Input and candidate table pairs are described as a feature vector, shown in Eq. (1). The main novelty lies in how table similarity is estimated. Instead of relying on hand-crafted features, like the ones presented in Sect. 2, we represent table elements in a uniform manner. Moreover, instead of relying of lexical matches, we perform the matching of table elements in multiple semantic spaces.
Let denote element of the input table in representation space . Similarly, let denote element of the candidate table in representation space . We then take table similarity features to be element-level matching scores:
where and is a similarity function. Importantly, these similarity functions are applicable both to elements of the same type (), referred to as element-wise matching (e.g., caption vs. caption, headings vs. headings, etc.) and to elements of different types (), referred to as cross-element matching (e.g., caption vs. headings or headings vs. data). Next, we present various ways of representing table elements (Sect. 3.1.1), and measuring element-level similarity (Sect. 3.1.2).
3.1.1. Representing Table Elements
Each table element, , is represented both in a term space and in a semantic space. We start with the former one. is described as a weighted vector of terms, where terms may be words or entities. Formally, , where corresponds to the weight of the th term in the vocabulary. For words, the vocabulary is the set of unique words in the table corpus, for entities it is the set of entries in a knowledge base. We also represent each table element in a semantic space. Given a semantic space , each term is described by a corresponding embedding vector, . The space of embeddings may be words, entities, or graphs (cf. Sect. 3.2.1).
In summary, each table element is represented in the term space by a term vector , and each term is represented by a semantic vector . Note that the term space serves only as an intermediate representation, to help map table elements to semantic space . The subsequent element-level matching will only be performed in this semantic space. See Fig. 2 for an illustration.

| Feature | Description | Source |
|---|---|---|
| #rows | Number of rows in the table | (Cafarella et al., 2008; Bhagavatula et al., 2013) |
| #cols | Number of columns in the table | (Cafarella et al., 2008; Bhagavatula et al., 2013) |
| #of NULLs | Number of empty table cells | (Cafarella et al., 2008; Bhagavatula et al., 2013) |
| IDF() | Table caption IDF | (Qin et al., 2010) |
| IDF() | Table page title IDF | (Qin et al., 2010) |
| inLinks | Number of in-links to the page embedding the table | (Bhagavatula et al., 2013) |
| outLinks | Number of out-links from the page embedding the table | (Bhagavatula et al., 2013) |
| pageViews | Number of page views | (Bhagavatula et al., 2013) |
| tableImportance | Inverse of number of tables on the page | (Bhagavatula et al., 2013) |
| tablePageFraction | Ratio of table size to page size | (Bhagavatula et al., 2013) |
3.1.2. Measuring Element-level Similarity
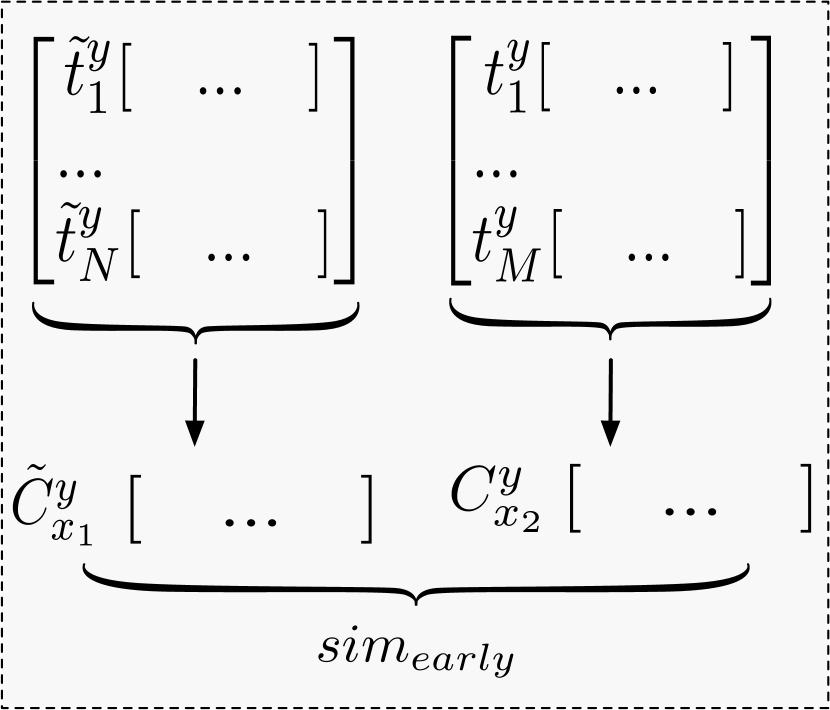
We estimate the similarity between two table elements, and , based on their semantic representations. Notice that these semantic representations (that is, the embedding vectors ) are on the term level and not on the element level. Thus, the term embedding vectors need to be aggregated on the element level. Inspired by our previous work (Anonymous, 2017), we present four specific element-level similarity methods. These are roughly analogous to the early and late fusion strategies in (Snoek et al., 2005; Zhang and Balog, 2017a). We refer to Fig. 3 for an illustration.
One strategy, referred to as early fusion, represents each table element in semantic space by combining the term-level semantic vectors to a single element-level semantic vector, . We take the weighted centroid of term-level semantic vectors:
where refers to the th element of the vector. Then, the similarity of two table elements is taken to be the cosine similarity of their respective centroid vectors:
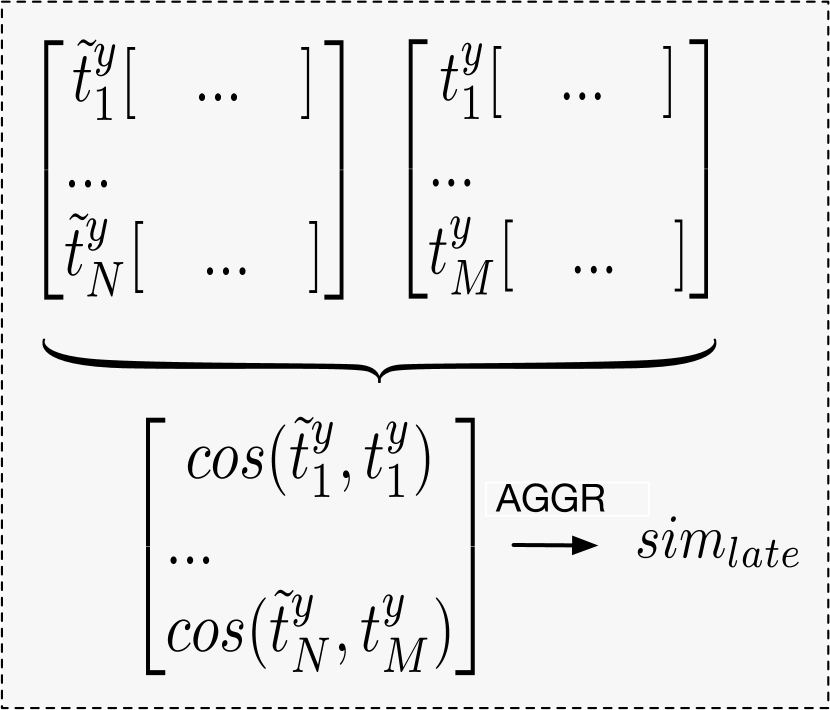
According to another strategy, referred to as late fusion, we first compute the cosine similarities between all pairs of semantic vectors. Then, these term-level similarity scores are aggregated into an element-level score:
where is an aggregation function. Specifically, we use , , and as aggregation functions.
3.2. CRAB
We detail a specific instantiation of our framework, which includes the representation of table elements (Sect. 3.2.1) and the element-level similarity scores that are used as ranking features (Sect. 3.2.2).
3.2.1. Representing Table Elements
We split tables into the following elements and represent them in (at most) two term spaces, words and entities, as follows:
-
•
Table headings () Table headings are represented only as words, since entity occurrences in headings are extremely rare. If case entities appear in headings, we assign them to the table data element.
-
•
Table data () The contents of table cells are used both as words and as entities. For the latter, entity mentions need to be recognized and disambiguated; such annotations be made readily available as markup (e.g., in Wikipedia tables) or may be obtained automatically using entity linking techniques (Shen et al., 2015).
-
•
Table topic () For simplicity, we combine table caption and page title into a single table topic element. We can directly use this text for representing the table topic in the word space. To obtain entities for the table topic, we use the table topic text as a search query to retrieve the top- relevant entities from a knowledge base. Specifically, we employ the MLM (Hasibi et al., 2017) retrieval method with .
-
•
Table entities () Many relational tables have a core entity column (Bhagavatula et al., 2015; Venetis et al., 2011), while the rest of columns represent attributes of those entities. For this table element we only keep entities from the table’s core column, i.e., the column with the highest entity rate. We estimate entity rate by calculating the number of column cells that contain an entity and divide it by the number of rows.
We consider three semantic spaces for representing table elements: word, entity, and graph embeddings. These are explained below.
- Word embeddings:
-
Each table element is represented in the term space as a TF-IDF-weighted vector of words. I.e., refers to the TF-IDF weight of the th word in the vocabulary. Then, each word is represented in the semantic space by a word embedding vector . Specifically, we use pre-trained Word2vec (Mikolov et al., 2013; Pennington et al., 2014) vectors using Google News.
- Graph embeddings:
-
Each table element is represented in the term space as a binary vector of entities. I.e., is if the th entity in the knowledge base appears in table element , and is otherwise. Then, each entity is represented in the semantic space by a graph embedding vector . Specifically, we use pre-trained Graph2vec(Ristoski and Paulheim, 2016) vectors.
- Entity embeddings:
-
We use the same term space representation as for graph embedding, i.e., each table element is described as a binary vector of entities. Then, each entity is represented in the semantic space as a vector of linked entities. I.e., the dimensionality of is the total number of entities in the knowledge base. The th element of the related entity vector is expressed as , where is a binary indicator function that returns if and link to each other, otherwise returns 0.
3.2.2. Table Similarity Features
Existing methods have only considered matching between elements of the same type, referred to as element-wise matching. Our framework also enables us to measure the similarities between elements of different types in a principled way, referred to as cross-element matching. Finally, as before, we can also utilize table features that characterize the input and candidate tables. Below, we detail the set of features used for measuring element-level similarity.
- Element-wise similarity:
-
We compute the similarity between elements of the same type from the input and candidate tables. Each table element may be represented in up to three semantic spaces. Then, in each of those spaces, similarity is measured using the four element-level similarity measures (early, late-max, late-sum, and late-avg). Element-wise features are summarized in the left half of Table 3.
- Cross-element similarity:
-
This approach compares table elements of different types in an asymmetrical way. Each pair of elements need to be represented in the same semantic space. Then, the same element-level similarity measures may be applied, as before. We list the cross-element similarity features in the right half of Table 3.
| Element | Dimension | Element | Dimension |
|---|---|---|---|
| to | to | ||
| to | to | ||
| to | to | ||
| to | to | ||
| to | |||
| Total | 36 | 72 |
We present four specific instantiations of our table matching framework, by considering various combinations of the three main groups of features. These instantiations are labelled as CRAB-1 .. CRAB-4 and are summarized in Table 4.
4. Test collection
We introduce our test collection, which consists of a table corpus, a set of query tables, and corresponding relevance assessments.
4.1. Table Corpus
We use the WikiTables corpus (Bhagavatula et al., 2015), which contains 1.6M tables extracted from Wikipedia. The knowledge base we use is DBpedia (version 2015-10). We restrict ourselves to entities which have a short textual summary (abstract) in the knowledge base (4.6M in total). Tables are preprocessed as follows. For each cell that contains a hyperlink we check if it points to an entity that is present in DBpedia. If yes, we use the DBpedia identifier of the linked entity as the cell’s content (with redirects resolved); otherwise, we replace the link with the anchor text (i.e., treat it as a string).
4.2. Test Tables and Relevance Assessments
Due to the lack of standard test collections, we sample 50 Wikipedia tables from the table corpus to be used as test input cases. These tables cover a diverse set of topics, including sports, music, films, food, celebrities, geography, and politics. Each table is required to have at least five rows and three columns (Zhang and Balog, 2017b).
Ground truth relevance labels are obtained as follows. For each input table, three keyword queries are constructed: (i) caption, (ii) table entities (entities from table plus the entity corresponding to the Wikipedia page in which the table is embedded), and (iii) table headings. Each keyword query is used to retrieve the top 150 results, resulting in at most 450 candidate tables for each query table. All methods that are compared in the experimental section operate by reranking these candidate sets. For each method, the top 10 results are manually annotated.
Each table pair (i.e., input and recommended tables) is judged on a three point scale: non-relevant (0), relevant (1), and highly relevant (2). A table is highly relevant if it is about the same topic as the input table, but contains additional novel content that is not present in the input table. A table is relevant if it is on-topic, but it contains limited novel content; i.e., the content largely overlaps with that of the input table. Otherwise, the table is not relevant; this also includes tables without substantial content. Three colleagues were employed and trained as annotators. We take the majority vote as the relevance label; if no majority vote is achieved, the mean score is used as the final label. To measure inter-annotator agreement, we compute the Fleiss Kappa test statistics, which is 0.6703. According to (Fleiss et al., 1971), this is considered as substantial agreement.
| Method | Table similarity features | ||
|---|---|---|---|
| Element-wise | Cross-element | Table features | |
| CRAB-1 | |||
| CRAB-2 | |||
| CRAB-3 | |||
| CRAB-4 | |||
4.3. Evaluation Metrics
We evaluate table recommendation performance in terms of Normalized Discounted Cumulative Gain (NDCG) at cut-offs 5 and 10. To test significance, we use a two-tailed paired t-test and write / to denote significance at the 0.05 and 0.01 levels, respectively.
5. Evaluation
In this section, we report on the experiments we conducted to answer our research questions.
5.1. Baselines
We implement eight existing methods from literature as baselines. The table elements used in these methods are listed in Table 5.
- Keyword-based search using :
-
The candidate table’s score is computed by taking the terms from as the keyword query (Ahmadov et al., 2015).
- Keyword-based search using :
-
Ahmadov et al. (2015) also use table headings as keyword queries.
- Keyword-based search using :
-
Additionally, in this paper we also consider using the table caption as a query.
- Mannheim Search Join Engine:
-
All candidate tables are scored against the input table using the FastJoin matcher (Wang et al., 2011).
- Schema complement:
-
Das Sarma et al. (2012) aggregate the benefits of adding additional attributes from candidates tables to input tables as the matching score.
- Entity complement:
-
The aggregated scores of the benefits of adding additional entities is taken as the matching score (Das Sarma et al., 2012) .
- Nguyen et al.:
-
Headings and table data are represented as term vectors for table matching in (Nguyen et al., 2015).
- InfoGather:
-
Element-wise similarity across four table elements: table data, column values, page title, and column headings are combined by training a linear regression scorer (Yakout et al., 2012).
| Method | |||||
|---|---|---|---|---|---|
| Keyword-based search using (Ahmadov et al., 2015) | |||||
| Keyword-based search using (Ahmadov et al., 2015) | |||||
| Keyword-based search using | |||||
| Mannheim Search Join Engine (Wang et al., 2011) | |||||
| Schema complement (Das Sarma et al., 2012) | |||||
| Entity complement (Das Sarma et al., 2012) | |||||
| Nguyen et al. (2015) | |||||
| InfoGather (Yakout et al., 2012) |
5.2. Experimental Setup
The experimental configurations of the various methods are as follows. For keyword-based search, the and methods query an index of the table corpus against the respective fields, while the variant searches against both the caption and catchall fields; all the three methods use BM25. For the Mannheim Search Join Engine, the edit distance threshold is set to . For schema complement, the heading frequency statistics is calculated based on the Wikipedia table corpora and the heading similarity is aggregated using average. For entity complement, WLM is based on entity out-links. The data similarity threshold is set the same as for string comparison, i.e., . To parse terms in attribute values, we remove stopwords and HTML markup, and lowercase tokens. For Nguyen et al., the smoothing parameter value is taken from (Nguyen et al., 2015) to be . InfoGather is trained using linear regression with coordinate ascent. All methods introduced by us, i.e., HCF-X and CRAB-X, are trained using Random Forest Regression with 5-fold cross-validation; the number of trees is 1000 and the maximum number features is 3.
Table 6 presents the evaluation results for the eight baselines. Among the three keyword-based search methods, which operate on a single table element (top 3 lines), the one that uses table headings as the keyword query performs the best, followed by table entities and table caption. The methods in lines 4–8 consider multiple table elements; all of these outperform the best single-element method. The approach that performs best among all, by a large margin, is InfoGather, which incorporates four different table elements. Consequently, we will test our methods against InfoGather.
| Method | NDCG@5 | NDCG@10 |
|---|---|---|
| Keyword-based search using | 0.2001 | 0.1998 |
| Keyword-based search using | 0.2318 | 0.2527 |
| Keyword-based search using | 0.1369 | 0.1419 |
| Mannheim Search Join Engine | 0.3298 | 0.3131 |
| Schema complement | 0.3389 | 0.3418 |
| Entity complement | 0.2986 | 0.3093 |
| Nguyen et al. | 0.2875 | 0.3007 |
| InfoGather | 0.4530 | 0.4686 |
5.3. Results
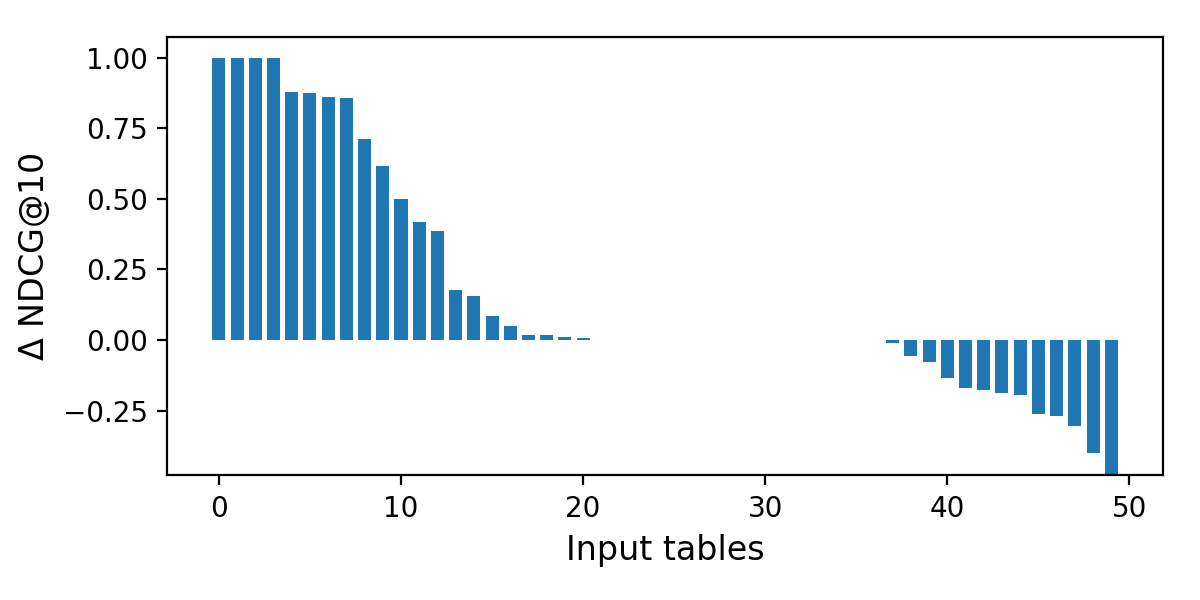
Table 7 compares the evaluation results of the methods we developed in this paper against InfoGather. HCF-1, which combines all table similarity features from existing approaches, achieves 18.27% improvement upon InfoGather in terms of NDCG@10, albeit the differences are not statistically significant. HCF-2 incorporates additional table features, which leads to substantial (29.11% for NDCG@10) and significant improvements over InfoGather. The bottom block of Table 7 presents the evaluation results for four specific instantiations of our table matching framework (cf. Table 4). Recall that CRAB-1 employs only table similarity features, thus it is to be compared against HCF-1. CRAB-2..4 additionally consider table features, which corresponds to the settings in HCF-2. We find that CRAB-1 and CRAB-2 outperform the respective HCF method, while CRAB-4 is on par with it. None of the differences between CRAB-X and the respective HCF method are statistically significant. The best overall performer is CRAB-2, with a relative improvement of 36.2% for NDCG@5 and 33.7% for NDCG@10 over InfoGather. Figure 4 shows performance differences on the level of individual input tables between InfoGather and CRAB-2. Clearly, several tables are improved by a large margin, while only a handful of tables are affected negatively.
The summary of our findings thus far is that our semantic table element representation with element-wise matching is very effective. We can achieve the same performance as a state-of-the-art approach that relies on hand-crafted features (CRAB-1 vs. HCF-1 and CRAB-2 vs. HCF-2). With that, we have accomplished our main research objective. We further observe that cross-element matching is less effective than element-wise matching (CRAB-3 vs. CRAB-2). Combining all element-wise and cross-element features performs worse than using only the former (CRAB-4 vs. CRAB-2).
Now that we have assessed the overall effectiveness of our approach, let us turn to answering a series of more specific research questions.
| Method | NDCG@5 | NDCG@10 |
|---|---|---|
| InfoGather | 0.4530 | 0.4686 |
| HCF-1 (feats. from Table 1) | 0.5382 | 0.5542 |
| HCF-2 (feats. from Tables 1 and 2) | 0.5895 | 0.6050 |
| CRAB-1 | 0.5578 | 0.5672 |
| CRAB-2 | 0.6172 | 0.6267 |
| CRAB-3 | 0.5140 | 0.5282 |
| CRAB-4 | 0.5804 | 0.6027 |
| Word-based | Graph-based | Entity-based | |||||||||||
|---|---|---|---|---|---|---|---|---|---|---|---|---|---|
| 0.2814 | 0.0261 | 0.0436 | 0.2765 | 0.0546 | 0.0430 | 0.4796 | 0.0808 | 0.0644 | |||||
| 0.0336 | 0.1694 | 0.0288 | 0.0700 | 0.0679 | 0.0501 | 0.0705 | 0.0617 | 0.0725 | |||||
| 0.0509 | 0.0183 | 0.1276 | 0.1012 | 0.0423 | 0.0259 | 0.1052 | 0.0812 | 0.0610 | |||||
- RQ1:
-
Which of the semantic representations (word-based, graph-based, or entity-based) is the most effective for modeling table elements?
Table 9 displays results for each of the three semantic representations. Among those, entity-based performs the best, followed by word-based and graph-based. The differences between entity-based and word-based are significant ( 0.01), but not between the other pairs of representations. Interestingly, the entity-based representation delivers performance that is comparable to that of the best existing method, InfoGather (cf. Table 6). When combing all three semantic representations (line 4, which is the the same as CRAB-1 in Table 7), we obtain substantial and significant improvements (0.01) over each individual representation. This shows the complimentary nature of these semantic representations.
| Semantic Repr. | NDCG@5 | NDCG@10 |
|---|---|---|
| Word-based | 0.3779 | 0.3906 |
| Graph-based | 0.3012 | 0.3376 |
| Entity-based | 0.4484 | 0.4884 |
| Combined | 0.5578 | 0.5672 |
- RQ2:
-
Which of the two element-level matching strategies performs better, element-wise or cross-element?
We found that adding all the cross-element similarities hurts (CRAB-4 vs. CRAB-2 in Table 7). In order to get a better understanding of how the element-wise and cross-element matching strategies compare against each other, we break down recommendation performance for all table element pairs according to the different semantic representations in Table 8. That is, we rank tables by measuring similarity only between that pair of elements (4 table similarity features in total). Here, diagonal cells correspond to element-wise matching and all other cells correspond to cross-element matching. We observe that element-wise matching works best across the board. This is in line with our earlier findings, i.e., CRAB-2 vs. CRAB-3 in Table 7. However, for graph-based and entity-based representations, there are several cases where cross-element matching yields higher scores than element-wise matching. Notably, input table data () has much higher similarity against the topic of the candidate table () than against its data () element, for both graph-based and entity-based representations. This shows that cross-element matching does have merit for certain table element pairs. We perform further analysis in Sect. 5.4.1.
- RQ3:
-
How much do different table elements contribute to recommendation performance?
To explore the importance of table elements, we turn to Table 8 once again. We first compare the results for element-wise similarity (i.e., the diagonals) and find that among the four table elements, table topic () contributes the most and table data () contributes the least. Second, our observations for cross-element matching are as follows. Using word-based representation, table data () is the most important element for the input table, while for the candidate table it is table topic (). Interestingly, for graph-based and entity-based representations it is exactly the other way around: the most important input table element is topic (), while the most important candidate table element is data ().
5.4. Further Analysis
Now that we have represented our experimental results, we perform further performance analysis on individual features and on input table size.
5.4.1. Feature Analysis
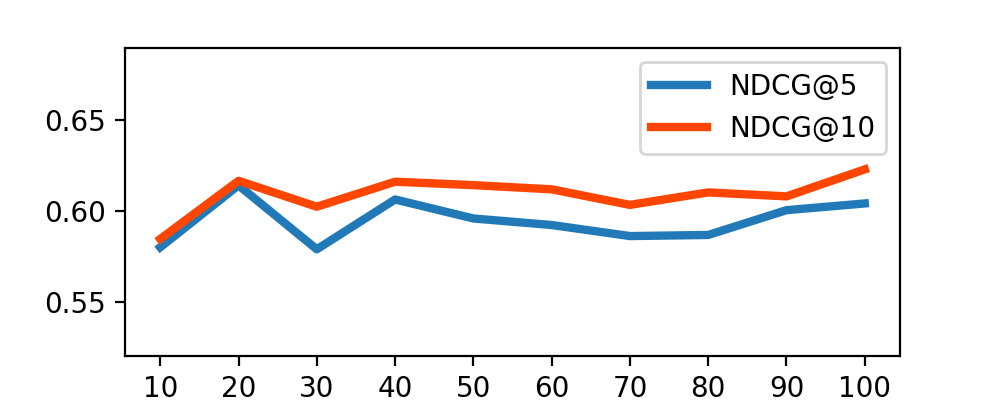
To understand the contributions of individual features, we first rank all features based on Gini importance. Then, we incrementally add features in batches of 10, and plot the corresponding recommendation performance in Figure 5. We observe that we can reach peak performance with using only the top-20 features.
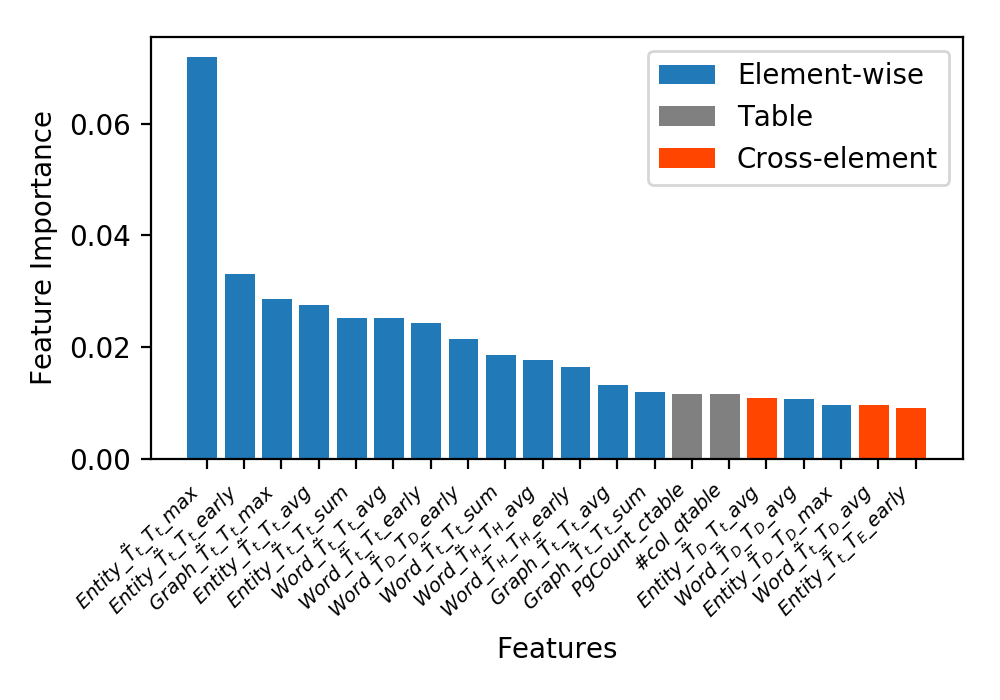
Let us take a closer look at those top-20 features in Figure 6. We use color coding to help distinguish between the three main types of features: element-wise, cross-element, and table features. Then, based on these feature importance scores, we revisit our research questions. Concerning semantic representations (RQ1), there are 8 word embedding, 7 entity embedding, and 3 graph embedding features in the top 20. Even though there are slightly more features using word embedding than entity embeddings, the latter features are much higher ranked (cf. Fig. 6). Thus, the entity-based semantic representation is the most effective one. Comparing matching strategies (RQ2), the numbers of element-wise and cross-wise features are 15 and 3, respectively. This indicates a substantial advantage of element-wise strategies. Nevertheless, it shows that incorporating the similarity between elements of different types can also be beneficial. Additionally, there are 2 table features in the top 20. As for the importance of table elements (RQ3), table topic () is clearly the most important one; 8 out of the top 10 features consider that element. In summary, our observations based on the top-20 features are consistent with our earlier findings.
5.4.2. Input table size
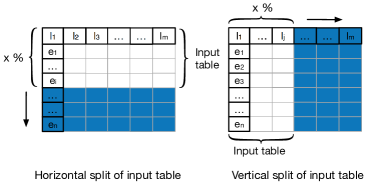
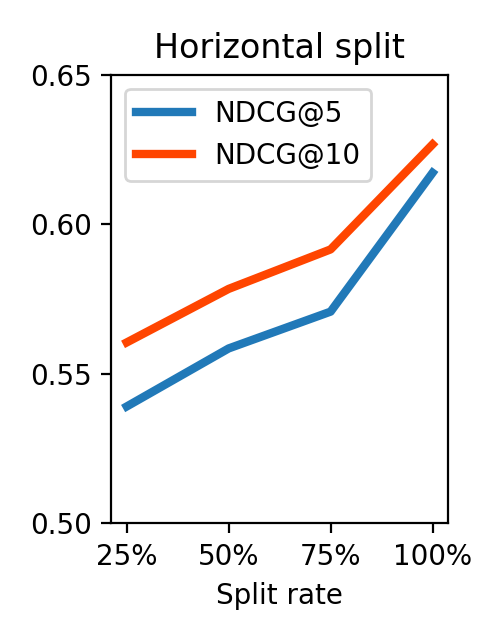
Next, we explore how the size of the input table affects recommendation performance. Specifically, we vary the input table size by splitting it horizontally (varying the number of rows) or vertically (varying the number of columns), and using only a portion of the table as input; see Fig. 7 for an illustration. We explore four settings by setting the split rate between 25% and 100% in steps of 25%. Figure 8 plots recommendation performance against input table size. We observe that growing the table, either horizontally or vertically, results in proportional increase in recommendation performance. This is not surprising, given that larger tables contain more information. Nevertheless, being able to utilize this extra information effectively is an essential characteristic of our table matching framework.
6. Related Work
An increasing number of studies on web tables are addressing various table-related tasks, including table search, table augmentation, table mining, etc. Among them, table search is considered as a fundamental task both on its own and as a component in other tasks. Table search answers a query with a ranked list of tables. Early work solves this task for keyword queries (Cafarella et al., 2008; Cafarella et al., 2009; Venetis et al., 2011; Pimplikar and Sarawagi, 2012; Balakrishnan et al., 2015; Nguyen et al., 2015). The WebTables system by Cafarella et al. (2008) pioneered keyword-based table search by issuing the query to a search engine and filtering tables from the returned web pages; the same approach is implemented in (Cafarella et al., 2009) as well. Venetis et al. (2011) utilize a database of class labels and relationships extracted from the Web for table search. Using column keywords, Pimplikar and Sarawagi (2012) search tables using the term matches in the header, body and context of tables as signals. An example of a keyword-based table search system interface is provided by Google Web Tables.111https://research.google.com/tables The developers of this system summarize their experiences in (Balakrishnan et al., 2015). To enrich the diversity of search results, Nguyen et al. (2015) design a goodness measure for table search and selection. Their query is not limited to keywords, it can also be a table. We have discussed the line of approaches (Lehmberg et al., 2015; Ahmadov et al., 2015; Das Sarma et al., 2012; Yakout et al., 2012; Nguyen et al., 2015; Limaye et al., 2010) that can use a table as a query in Sect. 5.1.
Tables contain rich knowledge and have raised great interest in table mining research (Cafarella et al., 2011; Cafarella et al., 2008; Madhavan et al., 2009; Sarawagi and Chakrabarti, 2014; Venetis et al., 2011; Zhang and Chakrabarti, 2013; Neelakantan et al., 2015; Yin et al., 2016; Sarawagi and Chakrabarti, 2014; Banerjee et al., 2009; Venetis et al., 2011; Chirigati et al., 2016; Bhagavatula et al., 2015). Munoz et al. (2014) recover Wikipedia table semantics and store them in RDF triples. Similar work is taken in (Cafarella et al., 2008) based on tables extracted from a Google crawl. Instead of mining a whole table corpora, a single table store many facts, which could be answers for questions. Yin et al. (2016) take a single table as a knowledge base and perform querying on it using deep neural networks. The knowledge extracted from tables could be used to augment an existing knowledge base (Sekhavat et al., 2014; Dong et al., 2014). E.g., Sekhavat et al. (2014) and Dong et al. (2014) design probabilistic methods to utilize table information for augmenting an existing knowledge base. Another line of work concerns table annotation and classification. By mining column content, Zwicklbauer et al. (2013) propose a method to annotate table headers. Studying a large number of tables in (Crestan and Pantel, 2011), a well defined table type taxonomy is provided for classifying HTML tables. Besides all the above tasks, table mining refers to tasks like table interpretation (Cafarella et al., 2008; Munoz et al., 2014; Venetis et al., 2011) and table recognition (Crestan and Pantel, 2011; Zwicklbauer et al., 2013) as well.
Table augmentation is the task of extending a table with additional elements, e.g., new columns (Das Sarma et al., 2012; Cafarella et al., 2009; Lehmberg et al., 2015; Yakout et al., 2012; Bhagavatula et al., 2013). To capture relevant data, e.g., existing columns, these methods need to search tables (Lehmberg et al., 2015; Bhagavatula et al., 2013; Yakout et al., 2012). E.g., the Mannheim Search Join Engine (Lehmberg et al., 2015) searches the top- candidate tables from a corpus of web tables and picks relevant columns to merge. Extending a table with more rows also needs table retrieval (Das Sarma et al., 2012; Yakout et al., 2012; Zhang and Balog, 2017b, b). In (Zhang and Balog, 2017b), two tasks of row population and column population are proposed, which provide suggestions for extending an entity-focused table with additional rows and columns. Table completion is the task of filling in empty cells within a table. Ahmadov et al. (2015) introduce a method to extract table values from related tables and/or to predict them using machine learning methods.
7. Conclusions
In this paper, we have introduced and addressed the task of recommending related tables: returning a ranked list of tables that are related to a given input table. We have proposed a novel element-oriented table matching framework that represents table elements uniformly and considers their similarity in multiple semantic spaces. This framework can incorporate the similarity between table elements that are of the same type (element-wise matching) as well as those that are of different types (cross-element matching). We have further presented four specific instantiations of this general framework and considered word-based, graph-based, and entity-based semantic representations. For evaluation, we have developed a standard test collection based on Wikipedia tables, and demonstrated that our approach delivers state-of-the-art performance.
In the future, we plan to test our method on a more heterogeneous collection of tables from the Web, which vary more quality-wise than Wikipedia tables. We are further interested in evaluating the utility of our approach with user studies.
References
- (1)
- Ahmadov et al. (2015) Ahmad Ahmadov, Maik Thiele, Julian Eberius, Wolfgang Lehner, and Robert Wrembel. 2015. Towards a Hybrid Imputation Approach Using Web Tables.. In Proc. of BDC ’15. 21–30.
- Anonymous (2017) Anonymous. 2017. Removed to Protect Anonymity. (2017).
- Balakrishnan et al. (2015) Sreeram Balakrishnan, Alon Y. Halevy, Boulos Harb, Hongrae Lee, Jayant Madhavan, Afshin Rostamizadeh, Warren Shen, Kenneth Wilder, Fei Wu, and Cong Yu. 2015. Applying WebTables in Practice. In Proc. of CIDR ’15.
- Banerjee et al. (2009) Somnath Banerjee, Soumen Chakrabarti, and Ganesh Ramakrishnan. 2009. Learning to Rank for Quantity Consensus Queries. In Proc. of SIGIR ’09. 243–250.
- Bhagavatula et al. (2013) Chandra Sekhar Bhagavatula, Thanapon Noraset, and Doug Downey. 2013. Methods for Exploring and Mining Tables on Wikipedia. In Proc. of IDEA ’13. 18–26.
- Bhagavatula et al. (2015) Chandra Sekhar Bhagavatula, Thanapon Noraset, and Doug Downey. 2015. TabEL: Entity Linking in Web Tables. In Proc. of ISWC 2015. 425–441.
- Cafarella et al. (2009) Michael J. Cafarella, Alon Halevy, and Nodira Khoussainova. 2009. Data Integration for the Relational Web. Proc. of VLDB Endow. 2 (2009), 1090–1101.
- Cafarella et al. (2011) Michael J. Cafarella, Alon Halevy, and Jayant Madhavan. 2011. Structured Data on the Web. Commun. ACM 54 (2011), 72–79.
- Cafarella et al. (2008) Michael J. Cafarella, Alon Halevy, Daisy Zhe Wang, Eugene Wu, and Yang Zhang. 2008. WebTables: Exploring the Power of Tables on the Web. Proc. of VLDB Endow. 1 (2008), 538–549.
- Chirigati et al. (2016) Fernando Chirigati, Jialu Liu, Flip Korn, You (Will) Wu, Cong Yu, and Hao Zhang. 2016. Knowledge Exploration Using Tables on the Web. Proc. of VLDB Endow. 10 (2016), 193–204.
- Crestan and Pantel (2011) Eric Crestan and Patrick Pantel. 2011. Web-scale Table Census and Classification. In Proc. of WSDM ’11. 545–554.
- Das Sarma et al. (2012) Anish Das Sarma, Lujun Fang, Nitin Gupta, Alon Halevy, Hongrae Lee, Fei Wu, Reynold Xin, and Cong Yu. 2012. Finding Related Tables. In Proc. of SIGMOD ’12. 817–828.
- Dong et al. (2014) Xin Dong, Evgeniy Gabrilovich, Geremy Heitz, Wilko Horn, Ni Lao, Kevin Murphy, Thomas Strohmann, Shaohua Sun, and Wei Zhang. 2014. Knowledge Vault: A Web-scale Approach to Probabilistic Knowledge Fusion. In Proc. of KDD ’14. 601–610.
- Fleiss et al. (1971) J.L. Fleiss et al. 1971. Measuring nominal scale agreement among many raters. Psychological Bulletin 76 (1971), 378–382.
- Hasibi et al. (2017) Faegheh Hasibi, Krisztian Balog, Darío Garigliotti, and Shuo Zhang. 2017. Nordlys: A Toolkit for Entity-Oriented and Semantic Search. In Proc. of SIGIR ’17. 1289–1292.
- Ibrahim et al. (2016) Yusra Ibrahim, Mirek Riedewald, and Gerhard Weikum. 2016. Making Sense of Entities and Quantities in Web Tables. In Proc. of CIKM ’16. 1703–1712.
- Lehmberg et al. (2016) Oliver Lehmberg, Dominique Ritze, Robert Meusel, and Christian Bizer. 2016. A Large Public Corpus of Web Tables Containing Time and Context Metadata. In Proc. of WWW ’16 Companion. 75–76.
- Lehmberg et al. (2015) Oliver Lehmberg, Dominique Ritze, Petar Ristoski, Robert Meusel, Heiko Paulheim, and Christian Bizer. 2015. The Mannheim Search Join Engine. Web Semant. 35 (2015), 159–166.
- Limaye et al. (2010) Girija Limaye, Sunita Sarawagi, and Soumen Chakrabarti. 2010. Annotating and Searching Web Tables Using Entities, Types and Relationships. Proc. of VLDB Endow. 3 (2010), 1338–1347.
- Macdonald et al. (2012) Craig Macdonald, Rodrygo L T Santos, and Iadh Ounis. 2012. On the Usefulness of Query Features for Learning to Rank. In Proc. of CIKM ’12. 2559–2562.
- Madhavan et al. (2009) Jayant Madhavan, Loredana Afanasiev, Lyublena Antova, and Alon Y. Halevy. 2009. Harnessing the Deep Web: Present and Future. CoRR abs/0909.1785 (2009).
- Mikolov et al. (2013) Tomas Mikolov, Ilya Sutskever, Kai Chen, Greg Corrado, and Jeffrey Dean. 2013. Distributed Representations of Words and Phrases and Their Compositionality. In Proc. of NIPS ’13. 3111–3119.
- Munoz et al. (2014) Emir Munoz, Aidan Hogan, and Alessandra Mileo. 2014. Using Linked Data to Mine RDF from Wikipedia’s Tables. In Proc. of WSDM ’14. 533–542.
- Neelakantan et al. (2015) Arvind Neelakantan, Quoc V. Le, and Ilya Sutskever. 2015. Neural Programmer: Inducing Latent Programs with Gradient Descent. CoRR abs/1511.04834 (2015).
- Nguyen et al. (2015) Thanh Tam Nguyen, Quoc Viet Hung Nguyen, Weidlich Matthias, and Aberer Karl. 2015. Result Selection and Summarization for Web Table Search. In ISDE ’15. 425–441.
- Pennington et al. (2014) Jeffrey Pennington, Richard Socher, and Christopher D Manning. 2014. GloVe: Global Vectors for Word Representation. In Proc. of EMNLP ’14. 1532–1543.
- Pimplikar and Sarawagi (2012) Rakesh Pimplikar and Sunita Sarawagi. 2012. Answering Table Queries on the Web Using Column Keywords. Proc. of VLDB Endow. 5 (2012), 908–919.
- Qin et al. (2010) Tao Qin, Tie-Yan Liu, Jun Xu, and Hang Li. 2010. LETOR: A Benchmark Collection for Research on Learning to Rank for Information Retrieval. Inf. Retr. 13, 4 (Aug 2010), 346–374.
- Ristoski and Paulheim (2016) Petar Ristoski and Heiko Paulheim. 2016. RDF2vec: RDF Graph Embeddings for Data Mining. In Proc. of ISWC ’16. 498–514.
- Ritze et al. (2016) Dominique Ritze, Oliver Lehmberg, Yaser Oulabi, and Christian Bizer. 2016. Profiling the Potential of Web Tables for Augmenting Cross-domain Knowledge Bases. In Proc. of WWW ’16. 251–261.
- Sarawagi and Chakrabarti (2014) Sunita Sarawagi and Soumen Chakrabarti. 2014. Open-domain Quantity Queries on Web Tables: Annotation, Response, and Consensus Models. In Proc. of KDD ’14. 711–720.
- Sekhavat et al. (2014) Yoones A. Sekhavat, Francesco Di Paolo, Denilson Barbosa, and Paolo Merialdo. 2014. Knowledge Base Augmentation using Tabular Data. In Proc. of LDOW ’14.
- Shen et al. (2015) Wei Shen, Jianyong Wang, and Jiawei Han. 2015. Entity Linking with a Knowledge Base: Issues, Techniques, and Solutions. IEEE Trans. Knowl. Data Eng. 27, 2 (feb 2015), 443–460.
- Snoek et al. (2005) Cees G. M. Snoek, Marcel Worring, and Arnold W. M. Smeulders. 2005. Early Versus Late Fusion in Semantic Video Analysis. In Proc. of MULTIMEDIA ’05. 399–402.
- Venetis et al. (2011) Petros Venetis, Alon Halevy, Jayant Madhavan, Marius Paşca, Warren Shen, Fei Wu, Gengxin Miao, and Chung Wu. 2011. Recovering Semantics of Tables on the Web. Proc. of VLDB Endow. 4 (2011), 528–538.
- Wang et al. (2011) Jiannan Wang, Guoliang Li, and Jianhua Fe. 2011. Fast-join: An Efficient Method for Fuzzy Token Matching Based String Similarity Join. In Proc. of ICDE ’11. 458–469.
- Yakout et al. (2012) Mohamed Yakout, Kris Ganjam, Kaushik Chakrabarti, and Surajit Chaudhuri. 2012. InfoGather: Entity Augmentation and Attribute Discovery by Holistic Matching with Web Tables. In Proc. of SIGMOD ’12. 97–108.
- Yin et al. (2016) Pengcheng Yin, Zhengdong Lu, Hang Li, and Ben Kao. 2016. Neural Enquirer: Learning to Query Tables in Natural Language. In Proc. of IJCAI ’16. 2308–2314.
- Zhang and Chakrabarti (2013) Meihui Zhang and Kaushik Chakrabarti. 2013. InfoGather+: Semantic Matching and Annotation of Numeric and Time-varying Attributes in Web Tables. In Proc. of SIGMOD ’13. 145–156.
- Zhang and Balog (2017a) Shuo Zhang and Krisztian Balog. 2017a. Design Patterns for Fusion-Based Object Retrieval. In Proceedings of the 39th European conference on Advances in Information Retrieval (ECIR ’17). Springer, 684–690.
- Zhang and Balog (2017b) Shuo Zhang and Krisztian Balog. 2017b. EntiTables: Smart Assistance for Entity-Focused Tables. In Proc. of SIGIR ’17. 255–264.
- Zhang and Balog (2018a) Shuo Zhang and Krisztian Balog. 2018a. Ad Hoc Table Retrieval Using Semantic Similarity. In Proceedings of The Web Conference (WWW ’18). 1553–1562.
- Zhang and Balog (2018b) Shuo Zhang and Krisztian Balog. 2018b. On-the-fly Table Generation. In Proceedings of 41st International ACM SIGIR Conference on Research and Development in Information Retrieval.
- Zwicklbauer et al. (2013) Stefan Zwicklbauer, Christoph Einsiedler, Michael Granitzer, and Christin Seifert. 2013. Towards Disambiguating Web Tables. In Proc. of ISWC-PD’ 13. 205–208.