On the observational behaviour of the highly polarized Type IIn supernova SN 2017hcc
Abstract
We present the results based on photometric (Swift UVOT), broad-band polarimetric ( and -band) and optical spectroscopic observations of the Type IIn supernova (SN) 2017hcc. Our study is supplemented with spectropolarimetric data available in literature for this event. The post-peak light curve evolution is slow ( 0.2 mag 100 d-1 in -band). The spectrum of +27 d shows a blue continuum with narrow emission lines, typical of a Type IIn SN. Archival polarization data along with the Gaia DR2 distances have been utilized to evaluate the interstellar polarization (ISP) towards the SN direction which is found to be = 0.17 0.02 per cent and = 140 3. To extract the intrinsic polarization of SN 2017hcc, both the observed and the literature polarization measurements were corrected for ISP. We noticed a significant decline of 3.5 per cent (-band) in the intrinsic level of polarization spanning a period of 2 months. In contrast, the intrinsic polarization angles remain nearly constant at all epochs. Our study indicates a substantial variation in the degree of asymmetry in either the ejecta and/or the surrounding medium of SN 2017hcc. We also estimate a mass-loss rate of = 0.12 M☉ yr-1 (for = 20 km s-1) which suggests that the progenitor of SN 2017hcc is most likely a Luminous Blue Variable.
keywords:
techniques: polarimetric – supernovae: general – supernovae: individual: SN 2017hcc1 Introduction
Supernovae (SNe), of Type IIn are hydrogen rich core collapse supernovae (CCSNe111These events characterize the explosion of massive stars (8 M☉) (for a review, see Filippenko, 1997).). They are primarily identified by their strong narrow and intermediate-width emission components of H, superimposed on a relatively smoother blue continuum (Schlegel, 1990). These narrow emissions are believed to arise due to an interaction between the slow moving circumstellar material (CSM) and the faster moving SN ejecta (Chevalier & Fransson, 1994; Chugai & Danziger, 1994; Chugai, 2001). Multi-wavelength studies suggest that they cover a broad range of observational properties (Kiewe et al., 2012; Fox et al., 2013), pointing to the existence of sub-categories of Type IIn SNe (see Taddia et al., 2013; Ofek et al., 2014; Smith, 2017). The observed diversity depends upon various factors such as progenitor channels (Fransson et al., 2002; Gal-Yam et al., 2007; Dwarkadas, 2011; Pastorello et al., 2013), mass-loss history (Smith, 2014), explosion mechanisms (Moriya et al., 2014), and environments of explosion sites (Habergham et al., 2014; Taddia et al., 2015).
The fractional population of Type IIn SNe is relatively small among the volume limited survey of CCSNe ( 10 per cent, Li et al., 2011). Nonetheless, considering their peculiarities, the light curve and spectral evolution of several events have been studied in detail. The polarimetric (broad-band polarimetry and spectropolarimetry) investigations of Type IIn SNe in the past have suggested relatively high degree of polarization in comparison to other CCSNe. In addition, they do not exhibit significant variation in the polarization angle (c.f. Wang & Wheeler, 2008; Branch & Wheeler, 2017, and references therein). This is attributed to the intrinsic aspherical SN explosion and/or asphericity in the CSM. The degree of polarization varies during different phases of the supernova evolution [for example, SN 1994Y (Wang et al., 1996), SN 1997eg (Hoffman et al., 2008), SN 1998S (Leonard et al., 2000; Wang et al., 2001), SN 2010jl (Patat et al., 2011) and SN 2012ab (Bilinski et al., 2018)]. While spectropolarimetry serves as a direct geometrical and dynamical probe of chemical constituents and geometry of the SN ejecta (see, e.g. Shapiro & Sutherland, 1982), the broad-band polarization parameters, on the other hand, provide a coarse but important picture of SN, especially when it is fainter.
Emergence of 1 per cent intrinsic polarization may imply around 20 per cent asymmetry (Hoflich, 1991; Leonard & Filippenko, 2005). In the case of Type IIn SNe, the theoretical interpretation of the observed polarization is not straightforward because of the difficulties in disentangling the polarization contributors. It is suggested that geometry of the SN ejecta along with the geometry of the CSM are to be accounted (Chugai, 2001). There is an increasing need for additional polarimetric data of SNe in order to enhance our current understanding about the structure of SN explosion/ejecta. Multi-epoch broad-band polarization and spectroscopic observations of SN 2017hcc are presented here with an investigation of its observational properties.
SN 2017hcc (ATLAS17lsn) was discovered222https://wis-tns.weizmann.ac.il/object/2017hcc/discovery-cert ( 17.4 mag, -band) in an anonymous galaxy on 2017 October 2.4 (JD 2458028.9) by Asteroid Terrestrial-impact Last Alert System (ATLAS, Tonry, 2011). It was located 4.3 arcsec east and 0.5 arcsec south of the center of the host galaxy, with coordinates , . The transient was not detected on 2017 September 30.4 (JD 2458026.9) at a limiting magnitude of 19.04. This indicates that SN was discovered within a few days after the explosion. In the present study, we adopted a mean of the earliest detection and the last non-detection epochs as the date of explosion for SN 2017hcc i.e. 2017 October 01.4 (JD 2458027.9). It was classified333https://wis-tns.weizmann.ac.il/object/2017hcc/classification-cert as a young Type IIn SN based on a low resolution optical spectrum obtained on 2017 October 07 with FLOYDS spectrograph at Siding Spring Observatory. In subsequent observations, non-detection of X-ray and radio was reported by Chandra et al. (2017) and Nayana & Chandra (2017), respectively.
Spectropolarimetric observations of SN 2017hcc obtained on 2017 October 30 by Mauerhan et al. (2017b) indicated an integrated -band continuum polarization of 4.84 per cent with a polarization angle of 97∘. They also noticed a weak wavelength dependence in the polarization measurement and a strong depolarization in the cores of the narrow emission features of H and H. Prieto et al. (2017) reported early phase results of SN 2017hcc and found it to be one of the brightest Type IIn events known (M –20.7 mag and peak Lbol 1.3 1044 erg s-1, for a distance of about 73 Mpc).
2 Observations and data reduction
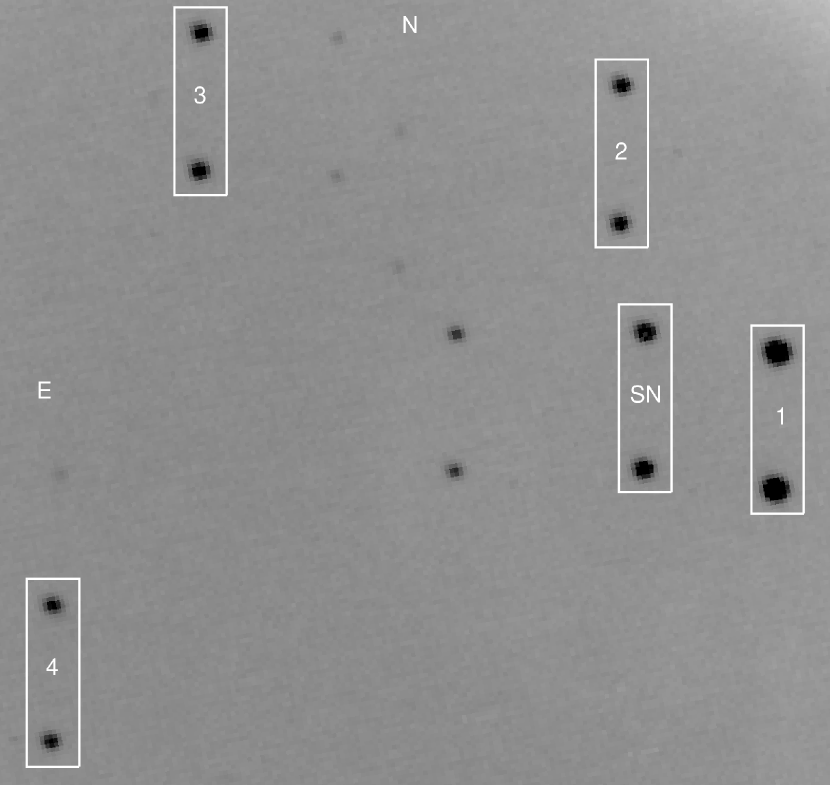
The -band ( = 0.53 m) polarimetric data of SN 2017hcc was obtained on 2017 December 25. These observations were acquired using the ARIES Imaging Polarimeter (AIMPOL, Rautela, Joshi & Pandey, 2004) mounted at the Cassegrain focus of the 1.04-m Sampurnanand telescope (ST) at Manora Peak, Nainital. This observing facility is operated by the Aryabhatta Research Institute of Observational sciences (ARIES), India. A half-wave plate (HWP) modulator, a Wollaston prism beam-splitter and a liquid nitrogen cooled Tektronix 1k 1k pixel CCD camera are integrated in the AIMPOL instrument. The plate scale, readout noise and gain of the CCD are 1.73 arcsec pixel-1, 7.0 and 11.98 /ADU, respectively. The central 370 pixel 370 pixel region of the CCD, used for observation, covers 8 arcmin in diameter in the sky. Fig. 1 displays a section (approximately 4 arcmin 4 arcmin) of the full image captured with the AIMPOL using ST. AIMPOL has been effectively used for polarimetric observations of SNe, e.g., SN 2012aw (Kumar et al., 2014), SN 2013ej (Kumar et al., 2016), SN 2013hj and SN 2014G (Bose et al., 2016), SN 2014J (Srivastav et al., 2016) and SN 2016B (Dastidar et al., 2019) etc.
Five frames were secured at each position angle of the HWP (i.e. 0.0, 22.5, 45.0 and 67.5). The individual exposure time for each frame was 200 seconds. To obtain a good signal-to-noise ratio (SNR), all pre-processed images at a given position angle were aligned and subsequently combined. The ordinary and extraordinary fluxes were extracted by performing standard aperture photometry using IRAF444IRAF is the Image Reduction and Analysis Facility distributed by the National Optical Astronomy Observatories, which are operated by the Association of Universities for Research in Astronomy, Inc., under cooperative agreement with the National Science Foundation. software. Multiple apertures (2 to 8 pixels) were chosen to estimate Stokes parameters at each aperture and finally (degree of polarization) and (polarization angle) were computed. Detailed description of the various procedure and the requisite equations can be found in Ramaprakash et al. (1998); Rautela et al. (2004); Kumar et al. (2014, 2016). The considered and values are for the aperture that best fit with minimum chi-square.
The offset polarization angle was estimated by observing two polarized standard stars on the same night. For this purpose, HD 25443 and HD 236633 stars were selected from Schmidt, Elston & Lupie (1992). The results listed in Table 1 are in good agreement with the standard values. Consequently, an average of offset values (i.e. 10.1) was applied to the SN. The instrumental polarization of AIMPOL is generally found to be small, at 0.1 per cent (see, e.g. Medhi et al., 2007; Pandey et al., 2009; Das et al., 2013; Eswaraiah et al., 2012, 2013; Patel et al., 2013; Soam et al., 2015; Neha et al., 2016; Rakshit et al., 2017; Wang et al., 2017; Lee et al., 2018, and references therein). This was verified by the observations of the unpolarized standard star HD 12021 (Schmidt, Elston & Lupie, 1992). The observed and values of SN 2017hcc after correcting for the offset polarization angle and instrumental polarization are provided in Table 4.
| Standard star | Band | ||
|---|---|---|---|
| (ID) | (per cent) | ( | |
| BD59∘389 (Pol)† | |||
| Standard values | 6.43 0.02 | 98.14 0.10 | |
| Observed values | 6.49 0.02 | 98.40 0.06 | |
| BD64∘106 (Pol)† | |||
| Standard values | 5.15 0.10 | 96.74 0.54 | |
| Observed values | 5.35 0.02 | 97.70 0.17 | |
| HD 25443 (Pol)∗ | |||
| Standard values | 5.13 0.06 | 134.23 0.34 | |
| Observed values | 5.50 0.10 | 144.60 1.00 | |
| HD 236633 (Pol)∗ | |||
| Standard values | 5.49 0.02 | 93.76 0.08 | |
| Observed values | 5.40 0.10 | 103.5 2.00 | |
| HD 12021 (Unpol)∗ | |||
| Standard values | 0.08 0.02 | 160.1 – | |
| Observed values | 0.12 0.10 | 163.8 3.50 |
† HONIR,
∗ AIMPOL
| Date | JD | Phasea | ||||||
|---|---|---|---|---|---|---|---|---|
| (yyyy-mm-dd) | 2458000+ | (mag) | (mag) | (mag) | (mag) | (mag) | (mag) | |
| 2017-10-28 | 54.9 | + 0.4 | 12.72 0.03 | 13.98 0.03 | 13.92 0.03 | 12.27 0.03 | 12.33 0.02 | 12.43 0.02 |
| 2017-10-30 | 56.6 | + 2.1 | 12.70 0.03 | 13.92 0.03 | – | – | 12.33 0.02 | 12.47 0.03 |
| 2017-11-03 | 61.3 | + 6.8 | 12.62 0.03 | 13.81 0.03 | 13.78 0.03 | 12.33 0.02 | 12.34 0.02 | 12.52 0.02 |
| 2017-11-05 | 63.3 | + 8.8 | 12.60 0.03 | 13.80 0.03 | 13.72 0.04 | 12.37 0.03 | 12.37 0.03 | 12.59 0.02 |
| 2017-11-10 | 68.0 | + 13.5 | 12.61 0.03 | 13.81 0.03 | 13.72 0.04 | 12.48 0.03 | 12.44 0.03 | 12.73 0.02 |
| 2017-11-16 | 74.0 | + 19.5 | 12.69 0.03 | 13.77 0.03 | 13.63 0.03 | 12.72 0.03 | 12.60 0.02 | 12.92 0.02 |
| 2017-11-19 | 77.1 | + 22.6 | 12.72 0.03 | 13.73 0.03 | 13.58 0.03 | 12.84 0.03 | 12.71 0.02 | 13.07 0.02 |
| 2017-11-22 | 80.1 | + 25.6 | 12.77 0.04 | 13.77 0.03 | 13.58 0.04 | 12.96 0.03 | 12.81 0.03 | 13.23 0.03 |
| 2017-11-30 | 87.8 | + 33.3 | 12.92 0.04 | 13.86 0.04 | 13.61 0.05 | 13.42 0.03 | 13.19 0.03 | 13.69 0.03 |
| 2017-12-04 | 92.1 | + 37.6 | 13.13 0.03 | 13.94 0.03 | 13.70 0.03 | 13.71 0.03 | 13.42 0.03 | 13.95 0.03 |
| 2017-12-08 | 95.7 | + 41.2 | 13.22 0.04 | 13.98 0.03 | 13.68 0.05 | – | 13.67 0.04 | 14.25 0.04 |
| 2017-12-12 | 99.8 | + 45.3 | 13.41 0.03 | 14.07 0.03 | 13.73 0.04 | 14.24 0.03 | 13.84 0.03 | 14.51 0.03 |
a With reference to the maximum light JD 2458054.5.
| Star | RA (J2000) | Dec (J2000) | Distance | ||||
|---|---|---|---|---|---|---|---|
| ID | (h:m:s) | (d:m:s) | (pc) | (per cent) | (∘) | (per cent ) | (per cent) |
| HD 693 | 00:11:16.1 | – 15:27:51.1 | 17.99 0.11 | 0.01 0.01 | 135 29 | – 0.0000 0.0082 | – 0.0080 0.0090 |
| HD 1388 | 00:17:58.6 | – 13:27:20.2 | 26.94 0.04 | 0.02 0.02 | 136 25 | 0.0003 0.0168 | – 0.0190 0.0180 |
| HD 967 | 00:14:04.2 | – 11:18:40.0 | 42.84 0.10 | 0.11 0.05 | 108 13 | – 0.0868 0.0507 | – 0.0626 0.0504 |
| HD 224383 | 23:57:33.3 | – 09:38:49.6 | 51.37 0.17 | 0.02 0.03 | 115 41 | – 0.0102 0.0252 | – 0.0123 0.0261 |
| HD 1195 | 00:16:18.6 | – 14:28:18.8 | 79.11 0.44 | 0.02 0.01 | 134 12 | – 0.0007 0.0089 | – 0.0210 0.0090 |
| HD 1064 | 00:14:54.5 | – 09:34:10.2 | 110.49 1.36 | 0.07 0.01 | 141 5 | 0.0136 0.0111 | – 0.0676 0.0110 |
| HD 223774 | 23:52:30.1 | – 14:15:04.3 | 112.70 1.97 | 0.11 0.06 | 150 14 | 0.0553 0.0570 | – 0.0974 0.0577 |
| HD 604 | 00:10:26.1 | – 14:27:05.0 | 132.17 0.89 | 0.09 0.01 | 135 4 | 0.0010 0.0140 | – 0.0910 0.0140 |
| HD 1231 | 00 16 34.1 | – 13:24:12.2 | 150.19 1.39 | 0.11 0.01 | 17 3 | 0.0924 0.0120 | 0.0633 0.0121 |
| HD 224481 | 23:58:21.2 | – 15:50:50.6 | 164.00 1.91 | 0.10 0.04 | 121 10 | – 0.0469 0.0347 | – 0.0883 0.0349 |
| HD 223559 | 23:50:33.3 | – 14:24:05.0 | 181.42 6.67 | 0.17 0.03 | 147 6 | 0.0667 0.0340 | – 0.1542 0.0340 |
| HD 1114 | 00:15:24.4 | – 13:03:15.1 | 210.34 2.54 | 0.16 0.02 | 136 3 | 0.0079 0.0170 | – 0.1618 0.0170 |
| HD 1268 | 00:16:52.9 | – 14:43:03.7 | 259.07 5.85 | 0.16 0.02 | 145 3 | 0.0529 0.0169 | – 0.1520 0.0170 |
| S1† | 00:03:47.5 | – 11:28:35.1 | 3640.3 551.3 | 0.52 0.02 | 159 1 | 0.3822 0.0184 | – 0.3482 0.0181 |
| S2† | 00:03:51.2 | – 11:27:04.4 | 1588.1 86.2 | 0.29 0.21 | 61 15 | – 0.1519 0.1728 | 0.2517 0.1980 |
| S3† | 00:04:00.9 | – 11:26:47.7 | 549.1 9.9 | 0.24 0.22 | 5 18 | 0.2364 0.2144 | 0.0415 0.1544 |
| S4† | 00:04:04.3 | – 11:30:02.6 | 1843.0 131.1 | 0.65 0.39 | 165 15 | 0.5647 0.3773 | – 0.3260 0.3483 |
† Field stars around SN 2017hcc within the FOV of AIMPOL.
Imaging polarimetric observations of SN 2017hcc were also made using the Hiroshima Optical and Near-InfraRed camera (HONIR; Akitaya et al., 2014) mounted on the 1.5-m Kanata telescope at Higashi-Hiroshima Observatory, in the -band ( = 0.65 m) on 2017 November 9.5 and December 22.5. The observations consisted of a sequence of exposures at four position angles of the achromatic HWP (i.e. , and ). The position angle of the polarization was calibrated using the observations of the polarized standard stars (BD59∘389, BD64∘106; Schmidt et al., 1992) as listed in Table 1. Since the instrumental polarization was estimated to be negligible ( 0.02 per cent), it has not been corrected for.
The Ultra Violet Optical Telescope (UVOT) on-board the Swift satellite monitored SN 2017hcc from JD 2458054.9 to 2458099.8 in , , , , and bands (see Poole et al., 2008, for filter specifications). These data sets were retrieved from the Swift data archive. To estimate the SN magnitude in each band, aperture photometry was performed using various modules of the HEASOFT (High Energy Astrophysics Software). A detailed description can be found in Kumar et al. (2018) and Sahu et al. (2018). The UVOT magnitudes (in Vega-system) are listed in Table 2.
We obtained a low-resolution spectrum of SN 2017hcc with the Himalayan Faint Object Spectrograph Camera (HFOSC), mounted on the f/9 Cassegrain focus of the 2-m Himalayan Chandra Telescope (HCT) of Indian Astronomical Observatory (IAO), Hanle, India. Observations were performed on 2017 November 23 ( 27 d post-maximum) using two grisms Gr#7 (3500 – 7800 Å) and Gr#8 (5200 – 9250 Å), having a resolution of 7 Å. A description on the data reduction procedure can be found in our previous studies (e.g. Kumar et al., 2018; Sahu et al., 2018; Singh et al., 2018; Singh et al., 2019). The spectrum was brought to an absolute flux scale using the blackbody fit to the extinction ( = 0.029 mag) corrected Swift UVOT fluxes.
3 Results and discussion
In this section, we constrain the interstellar polarization (ISP) and derive the intrinsic polarization characteristics of SN 2017hcc. The evolution of light curves, spectral properties and physical parameters are also discussed.
3.1 Interstellar polarization
The interstellar polarization originates (both due to the Milky Way (MW) and/or the host galaxy) owing to directional extinction of the dust grains situated along the line-of-sight of an observer. Accordingly, the intrinsic signal of a source gets altered when it passes through the interstellar medium. The situation becomes more complicated in case of extragalactic SNe as the host galaxy dust and local environment may further contaminate the propagating signal. Consequently, the intervening ISP contribution should be accounted for from the observed SN measurements in order to derive the intrinsic polarization characteristics of SN. While temporal variation may be observed in the SN polarization properties, the ISP should be constant towards a particular direction. Therefore, if ISP can be constrained appropriately (or at-least setting an upper limit), it will be easier to estimate intrinsic SN parameters by subtracting it from the observed values. Fortunately, the Galactic ISP has been properly documented in literature (e.g. Serkowski, Mathewson & Ford, 1975; Whittet & van Breda, 1978).
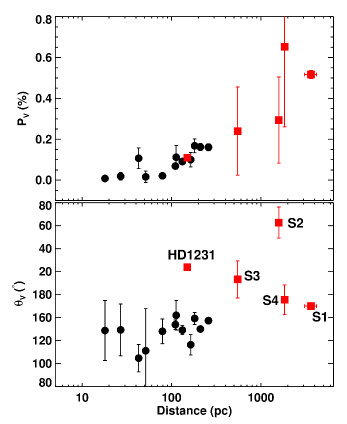
In order to examine the ISP towards the SN arising due to the MW, the nearby field stars (well above the Galactic plane) can serve as good probe (Tran, 1995). For this purpose, we selected 13 isolated field stars within a radius of 5∘ around the location of SN 2017hcc which do not show emission, variability and double characteristics in SIMBAD database. The polarization and distance information of these sources were collected from the polarization data catalog of Heiles (2000) and the newly available Gaia data (DR2) (Gaia Collaboration et al., 2018), respectively. Additionally, 4 stars (indicated with IDs 1 – 4 in Fig. 1) lying within the 8 arc min AIMPOL field of SN 2017hcc were also considered. Different parameters of all 17 stars are listed in Table 3 and their and measurements are plotted against distance in Fig. 2 (left panel). An increasing trend can be seen in the values as a function of distance up to 260 pc. The values are generally distributed between 100∘ and 150∘ (except for a few sources).
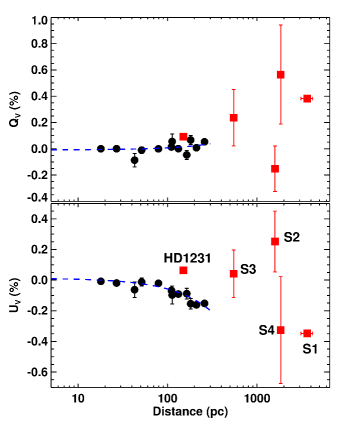
The and of the field stars were converted into Stokes parameters ( and ) using the relations = cos(2) and = sin(2). The distribution of and with respect to distance is shown in Fig. 2 (right panel). Further, weighted linear fits on the distance versus Stokes parameters were performed as shown with dotted lines in the same figure. It is to be noted that the Heiles catalogue stars have reliable information on their spectral types. However, this is not the case for field stars situated in the field-of-view (FOV) of AIMPOL (except for the RR Lyrae variable, S1, Gavrilchenko et al., 2014). Stars S2, S3 and S4 are faint and have large polarization error bars due to low SNR. HD 1231 is deviant amongst the Heiles catalogue stars. Consequently, these stars (S1-S4 and HD 1231) were excluded from the fitting.
The fitted slopes and intercepts at the distance 260 pc of HD 1268 were used to estimate the Stokes parameters and values corresponding to the ISP contribution in the MW. From these parameters, the derived and were found to be 0.17 0.02 per cent and 140.3∘ 3.0∘, respectively.
The MW reddening in the direction of SN 2017hcc was estimated as = 0.029 0.001 mag using the all-sky dust extinction map (Schlafly & Finkbeiner, 2011). Polarimetric studies of Galactic stars along different directions have provided a correlation between ISP and reddening (e.g. Serkowski et al., 1975). According to this, the mean and maximum polarization efficiency are correlated with interstellar extinction as and , respectively. Assuming that MW dust grains follow mean polarization efficiency along the SN direction, the first relation yields of 0.15 per cent. This value is similar to the ISP value ( = 0.17 per cent) computed using the polarization measured for the field stars. Using the maximum polarization efficiency relation, an upper limit of i.e. = 0.26 per cent is obtained.
The 3D dust extinction map555http://argonaut.skymaps.info/ (Green et al., 2018) was used to further explore the MW dust extinction along the line-of-sight towards SN 2017hcc. The map is based on high-quality stellar photometry data from Pan-STARRS 1 and 2MASS surveys, and provides information of as a function of distance. The extinction map indicates the best fit reddening value remains constant around 0.033 mag beyond a distance of 650 pc. This implies the predicted degree of polarization, as per the mean polarization efficiency relation, would be 0.17 per cent. This again confirms our ISP estimate using the weighted linear fits on distance versus Stokes parameters.
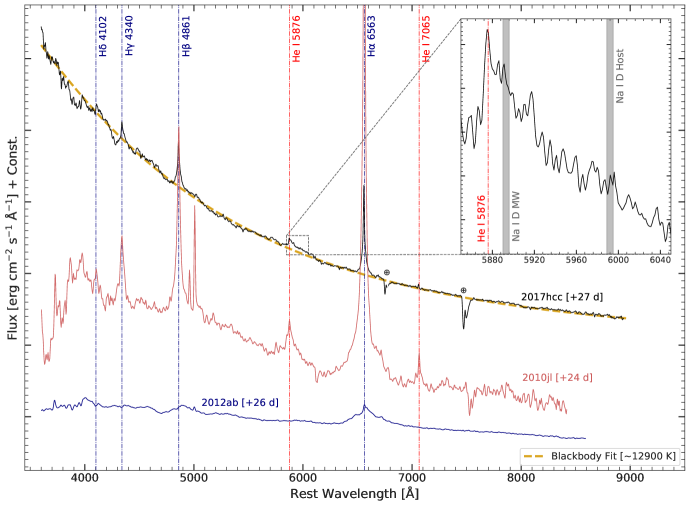
The colour excess of the host-galaxy can be inferred using the equivalent width (EW) of Na i D absorption lines (Turatto et al., 2003; Poznanski et al., 2012; Stritzinger et al., 2018). This signature is very weak at the redshift of the host galaxy in the low-resolution spectrum presented here (see inset in Fig. 4). We estimate an upper limit of 0.06 Å on Na i D EW, indicating negligible host extinction. Mauerhan et al. (2017b) have made a similar observation based on spectropolarimetric data obtained close to maximum light.
The direct and indirect methods discussed above, indicate that the MW aligned dust grains exhibit mean polarization efficiency. Therefore, in the present analysis we have considered only MW dust as the major source of ISP along the LOS of SN 2017hcc. An average ISP as a function of wavelength was estimated using the formulation of Serkowski et al. (1975) and found to be similar for both and bands ( = 0.17 per cent and = 140.3∘). The corresponding and values are 0.032 0.018 and – 0.170 0.019 per cent which are subtracted from the observed SN polarization measurements (see Section 3.4). A similar methodology has been used to derive the ISP contribution in dark globules and B[e] stars (Lee et al., 2018; Eswaraiah et al., 2019).
3.2 Light curves and spectral features
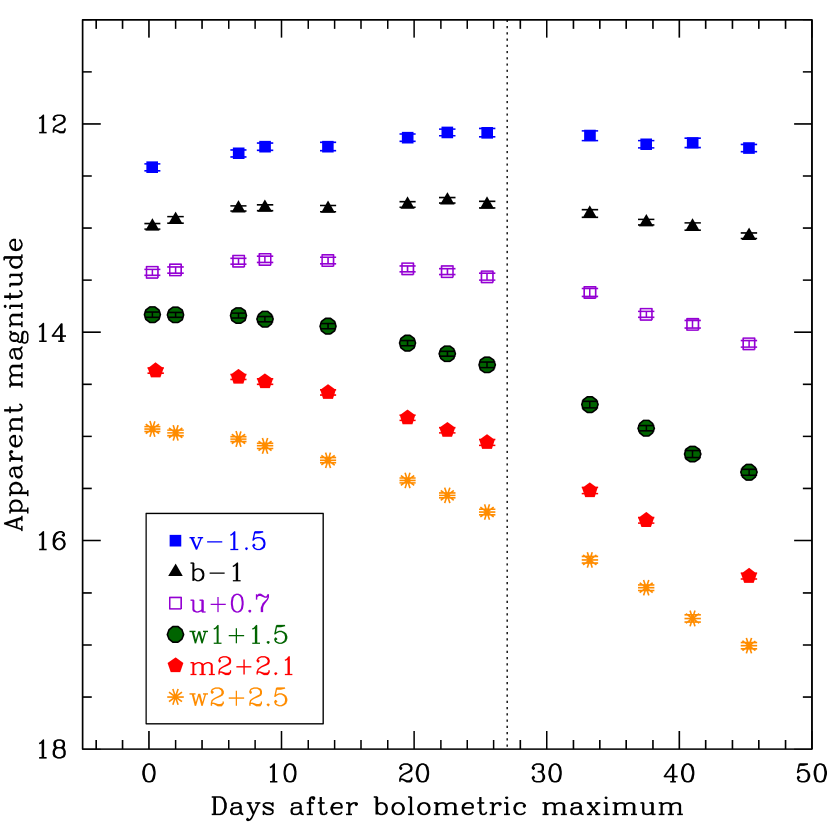
The Swift UVOT light curves of SN 2017hcc are displayed in Fig. 3. We adopt JD 2458054.5 as the epoch of maximum from Prieto et al. (2017) as inferred from their bolometric light curve. The and band light curves are almost flat compared to the bluer bands. The decay rates (between 0 to 45 d) in , , and bands are 0.02, 0.04, 0.05 and 0.05 mag d-1, respectively.
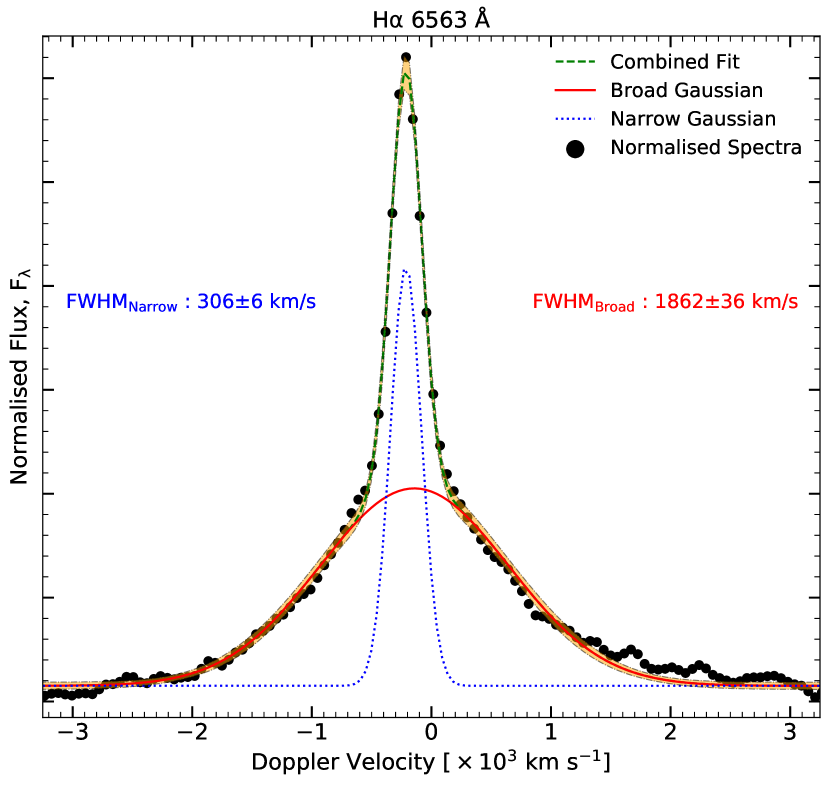
In Fig. 4, the redshift corrected ( = 0.0168, Prieto et al., 2017) spectrum of SN 2017hcc, obtained on 2017 November 23 ( +27 d) is displayed. Spectra of SN 2010jl (Zhang et al., 2012) and SN 2012ab (Gangopadhyay et al., 2019), at a similar epoch are also shown in the Figure for comparison. It is evident from the figure that the spectrum of SN 2017hcc is considerably bluer in comparison to the other two events. Prieto et al. (2017) obtained a spectrum of SN 2017hcc on 2017 October 20 ( +8 d) which also reported a significantly bluer continuum. The primary spectral features are also marked in Fig. 4. The emission lines of hydrogen i.e. H (6563 Å), H (4861 Å), H (4341 Å) and H (4102 Å) are prominent in all the three events but the H and H lines are broader in SN 2012ab and SN 2010jl compared to SN 2017hcc. The blackbody fit to the continuum indicates a temperature of 12900 680 K (shown with a dotted line in Fig. 4). The flux ratio of H to H lines is estimated as 4 for SN 2017hcc whereas the same ratio is found to be 5 and 8 for SN 2010jl and SN 2012ab, respectively. The H line profile is decomposed into narrow and broad components by fitting a two-component Gaussian as shown in Fig. 5. The best fit yields an FWHM of 306 km s-1 and 1862 km s-1 for the narrow and broad components, respectively.
The He i 5876, 7065 Å features are stronger in SN 2017hcc and SN 2010jl than in SN 2012ab. An unblended signature of a Na i D feature was found in SN 2012ab (Bilinski et al., 2018) which is negligible in SN 2017hcc and SN 2010jl (Zhang et al., 2012) indicating negligible reddening (see Section 3.1) along the line of sight caused by the host galaxies.
3.3 Basic physical parameters
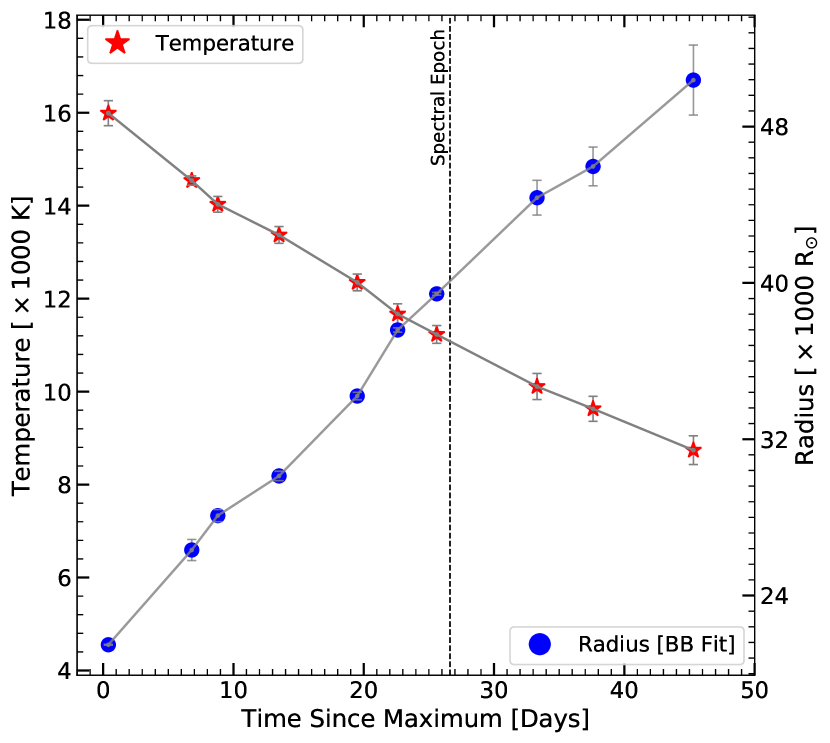
The temperature and radius evolution of SN 2017hcc was computed by fitting a blackbody function to the Spectral Energy Distribution (SED) constructed using the Swift magnitudes (c.f. Table 2). Weighted Least-Squares optimization was employed for the fit with the weights being the inverse of the 1 error on the Swift magnitudes. The evolution of these parameters are shown in Fig. 6. The temperature at the earliest epoch ( 0 d), estimated at 16000 K is similar to the temperature obtained in Prieto et al. (2017). The temperature subsequently decreased to 8700 K at the last epoch ( +45 d). In comparison, SN 2012ab had a temperature of 12000 K at d, which decreased to 10500 K close to the maximum. The peculiar Type IIn SN 2006gy displayed a temperature of 12000 K (Smith et al., 2007) whereas SN 2006tf reached a temperature of 7800 K near the peak (Smith et al., 2008).
The temperature evolution of SN 2017hcc clearly indicates that it is hotter than other Type IIn events at similar epochs. The blackbody radius of Type IIn SNe is found to steadily increase with time, reach a peak and subsequently decline, as observed in several events like SN 1998S (Fassia et al., 2001), SN 2005gj (Prieto et al., 2007) and SN 2006gy (Smith et al., 2010). The peak represents a transition to the optically thin CSM shell (Smith et al., 2010). In SN 2017hcc, the blackbody radius was found to be increasing until the last epoch of Swift observation (c.f. Fig. 6) which is likely due to the optically thick SN atmosphere until day +45.
The overall light curve evolution and spectral features suggests the presence of CSM interaction in SN 2017hcc. Assuming that the luminosity is mainly powered by the ejecta-CSM interaction (Chevalier & Fransson, 1994), the mass-loss rate () can be estimated using the relation of Chugai & Danziger (1994):
| (1) |
where is the observed luminosity at a particular epoch, represents the efficiency of converting the shock’s kinetic energy into visual light. and are the velocities of the pre-explosion stellar wind and the post-shock shell, respectively. We adopt a magnitude of on day +27 by interpolating the Swift magnitude provided in Table 2 and estimate the luminosity to be = 6.0 1042 erg s-1. No bolometric correction has been applied in this calculation. Assuming a constant value of km s-1 for a Red Supergiant (RSG) wind and km s-1 for the SN ejecta (see Section 3.2). For a value of = 0.5 (though, is optical depth dependent, Smith & McCray, 2007), is estimated as 0.12 M☉ yr-1. The typical mass-loss rates in RSGs, yellow hypergiants and luminous blue variables (LBVs) are found to have a range of 10-6 – 10-4 M☉ yr-1, 10-4 – 10-3 M☉ yr-1 and 0.1 – 10 M☉ yr-1, respectively (see Smith, 2014). The mass loss rate estimated for SN 2017hcc is closer to that seen in LBVs, indicating that its progenitor is likely to be an LBV star.
| ut Date | JD | Phasea | Band | Observed | Intrinsic (ISP subtracted) | ||||
| (2017) | 2458000 | (Days) | (per cent) | (per cent) | |||||
| (per cent) | ( | (per cent) | (∘) | ||||||
| Oct 30∗ | 56.5 | +2.1 | 4.84 0.02 | 96.5 0.1 | 4.84 0.03 | 95.5 0.2 | – 4.747 0.027 | – 0.922 0.026 | |
| Dec 25 | 113.1 | +58.6 | 1.40 0.10 | 104.2 2.0 | 1.36 0.10 | 100.8 2.2 | – 1.262 0.105 | – 0.498 0.102 | |
| Nov 9.5 | 67.1 | +12.6 | 3.22 0.13 | 96.41 1.4 | 3.22 0.13 | 95.0 1.4 | – 3.170 0.133 | – 0.553 0.157 | |
| Dec 22.5 | 110.0 | +55.5 | 1.39 0.17 | 104.8 5.0 | 1.35 0.20 | 101.4 4.7 | – 1.240 0.191 | – 0.523 0.228 | |
∗ Observation of this epoch has been reported by Mauerhan et al. (2017b).
a With reference to the maximum light JD 2458054.5.
3.4 Intrinsic polarization
To derive the intrinsic polarization parameters of SN 2017hcc, ISP contribution must be subtracted from the observed polarization values. The intrinsic Stokes parameters were estimated by the relations: = – and = – . Here , and , represent the observed and ISP Stokes parameters, respectively. Therefore, at each epoch vectorial subtraction was performed and the resulted and were converted back to and with the help of following equations:
| (2) |
| (3) |
Both the observed and the intrinsic (ISP corrected) polarization parameters of SN 2017hcc are listed in Table 4 along with the spectropolarimetric observation of Mauerhan et al. (2017b).
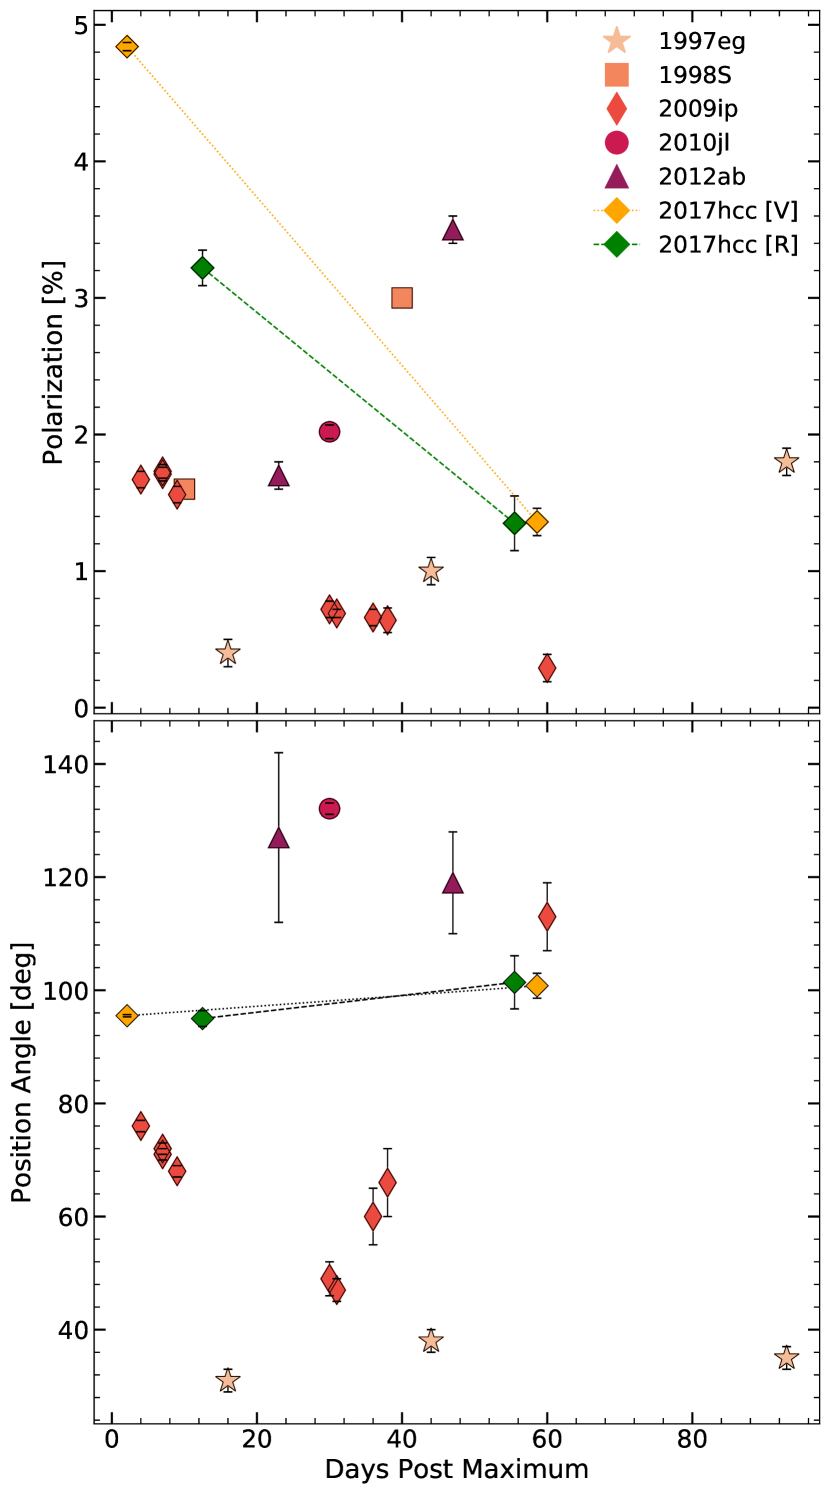
The polarization in -band at +2 d was estimated as 4.84 0.03 per cent by Mauerhan et al. (2017b), and a value of 1.36 0.10 per cent is estimated at +59 d. The -band polarization at +13 d and +56 d are estimated at 3.22 0.13 and 1.35 0.20 per cent, respectively. The position angle in both the bands is 100∘ at all epochs. Accounting for the maximum ISP contribution (see Section 3.1), marginal changes are seen in the intrinsic polarization values. Here, a -band polarization of 4.84 per cent (95.0∘) and 1.34 per cent (98.9∘) were estimated on the +2 d and +59 d, respectively. Similarly, an -band polarization of 3.22 per cent (94.1∘) and 1.33 per cent (99.5∘) were estimated on +13 d and +56 d, respectively. This clearly indicates that the observed polarization values are intrinsic, and the degree of polarization decreased by 3.5 per cent in -band, and by 2.3 per cent in the -band within a period of 2 months. No significant variation is observed in the polarization angle in both the bands during this period.
3.5 Comparison of SN 2017hcc with other Type IIn events
Only a handful of Type IIn SNe other than SN 2017hcc have been monitored polarimetrically close to the maximum. These are SN 1997eg (Hoffman et al., 2008), SN 1998S (Li et al., 1998), SN 2009ip (Mauerhan et al., 2014; Reilly et al., 2017), SN 2010jl (Newton & Puckett, 2010) and SN 2012ab (Vinko et al., 2012). The evolution of polarization parameters of SN 2017hcc along with the above events is shown in Fig. 7. In general, the temporal evolution in the intrinsic polarization of the comparison sample (except SN 2009ip) display an increasing trend with no significant variation in their polarization angle. In the case of SN 1997eg, Hoffman et al. (2008) discussed the polarization properties of SN 1997eg in the context of three ISP values. Their preferred ISP subtracted polarization exhibited an increasing trend whereas the other two ISP values resulted in decreasing trend of the intrinsic polarization (see Figure 11 in Hoffman et al., 2008).
The peculiar SN 2009ip (2012b outburst, Mauerhan et al., 2013; Prieto et al., 2013; Smith et al., 2014) displayed a high degree of polarization ( 1.7 per cent) at maximum ( –18.5 mag) and followed a decreasing trend similar to the decay in its light curve, until day 70. This behaviour is indicative of a correlation between the intrinsic polarization and photometric luminosity. A similar trend is seen in SN 2017hcc, with a higher intrinsic polarization ( 4.84 per cent), and a brighter maximum ( –20.7 mag). Further, there is almost no variation seen in the polarization angle in the case of SN 2017hcc, whereas, a substantial variation ( 30∘) was seen in the case of SN 2009ip (Mauerhan et al., 2014; Reilly et al., 2017).
The emergence of polarization among Type IIn SNe is generally attributed to either electron scattering in an asymmetric photosphere, or asymmetries in the interaction region. In several studies, departure of the SN ejecta from spherical symmetry is a favoured explanation. This line of reasoning makes it rather straightforward to explain the temporal increase of intrinsic polarization as the core becomes progressively exposed. This also suggests that the inner layers of the ejecta are quite aspherical, indicating an aspherical explosion (see Wang et al., 1996; Tran et al., 1997; Kawabata et al., 2002; Leonard et al., 2006; Maund et al., 2007a, b; Chornock et al., 2010; Kumar et al., 2014, 2016; Mauerhan et al., 2017a, and references therein).
The maximum light in Type IIn SNe is primarily powered by an interaction of the ejecta with a massive CSM, implying that the major source of intrinsic polarization at maximum is due to this interaction, particularly with an asymmetric CSM. The luminosity from the interaction becomes progressively weaker as the CSM around the SN evolves into an optically thin state. The asymmetry in the SN photosphere (resulting from an aspherical explosion) can also complement the polarization signal arising from the CSM. The percentage contribution from the photosphere increases temporally and plays a dominant role during the later phases as the luminosity from interaction dies off slowly. Overall, the relative contribution to the net luminosity from the photosphere and the CSM interaction decides the strength of net intrinsic polarization.
The high degree of intrinsic polarization at initial phases displayed by SN 2017hcc is an exceptional example among CCSNe. A significant decline of 3.5 per cent in the intrinsic polarization was seen within a period of 2 months. During the late phase ( 2 months from maximum) polarization values are wavelength independent (c.f. 1.4 per cent polarization in and -bands). The decline in polarization seen in SN 2017hcc is very similar to the early decline observed in SN 2009ip (Mauerhan et al., 2014), and explained as due to interaction with an aspherical CSM. As discussed in Section 3.3, the progenitor of SN 2017hcc is likely an LBV star. These type of stars undergo episodic mass loss or giant eruption immediately before the explosion leading to the formation of circumstellar shells and/or equatorial disks/rings around them (Smith, 2017). These structures distort a spherically symmetric SN photosphere upon interaction, enhancing the advancing polarization signal. While a detailed modelling is beyond the scope of this work, it appears that the strong polarization seen in SN 2017hcc could be a possible outcome of an interaction of the SN ejecta with an highly aspheric CSM (Mauerhan et al., 2017b).
Additionally, one can not rule out other possibilities, such as net reduction in the number density of the scatterers (such as electrons and dust grains) as a function of time in a non-spherical ejecta. This is expected because the cooling in the SN ejecta as a function of time (c.f. star symbols in Fig. 6) would result in a corresponding decay in the electron number density. Furthermore, the continuous expansion of SN ejecta as a function of time (c.f. blue filled circles in Fig. 6) may also cause a net reduction in the clumpiness (if any) leading to a decrease in the net polarization.
4 Summary
We have presented imaging (Swift UVOT), spectroscopy and polarimetry of the luminous Type IIn SN 2017hcc and compared the results with similar events. The light curve evolution was very slow during post-maximum phase ( 0.2 mag 100 d-1 in -band during 0 – 45 d). The , and band light curves evolved with similar rate however, the evolution was almost flat in and bands. The broad-band polarization characteristics were examined following robustly determined ISP contribution, which is found to be 0.17 per cent and 140∘ (mainly arising from the Galactic dust and assuming a mean polarization efficiency). The intrinsic degree of polarization (in -band) near the maximum light was 4.84 per cent which reduced to 1.36 per cent after 2 months. Similarly in -band also, the intrinsic polarization values are high i.e. 3.22 per cent ( +13 d) and 1.35 per cent ( +56 d). Such large amount of polarization is unusual for a SN. Interestingly, the intrinsic polarization angle was found to remain constant around 100° at all epochs. There is no significant change in the intrinsic polarization parameters even if maximum polarization efficiency relation is considered towards the SN direction.
We note that SN 2017hcc is not only peculiar in terms of polarization inferred but also belongs to the group of bright Type IIn events ( = –20.7 mag, Prieto et al., 2017). Its peak luminosity is equivalent to SN 2006tf ( = –20.8 mag, Smith et al., 2008). The 27 d post-maximum spectrum of SN 2017hcc exhibited prominent narrow lines of H and He as typically seen in Type IIn SNe but the spectrum is bluer relative to SN 2010jl and SN 2012ab. The evolution of blackbody temperature and radius signifies a hotter and optically thick environment of SN 2017hcc than those of typical Type IIn SNe. The Na i D lines are not visible in our spectrum, indicating a negligible host extinction. The mass-loss rate of SN 2017hcc is estimated to be 0.12 M☉ yr-1 based on a simple CSM-ejecta interaction model which suggests an LBV progenitor for this event.
The high degree of polarization values found in SN 2017hcc support the fact that events belonging to this class are in general significantly polarized in comparison to other CCSNe and thermonuclear SNe (Type Ia) (Wang & Wheeler, 2008; Patat, 2017). A disc-like or toroidal CSM around the ejecta seems to be a common characteristic among Type IIn SNe that induces polarization signal. As described in Section 3.4, diversity exists in the polarization properties of Type IIn SNe. This indicates variation in the electron-scattering atmosphere which is regulated by complexity of the SN ejecta and/or CSM composition. A cumulative effect of the highly aspherical CSM and the ejecta density profile may have produced such a strong polarization in SN 2017hcc without significant change in the overall geometry (Kasen et al., 2003, 2006; Hole et al., 2010; Tanaka et al., 2017). Better temporal coverage in polarimetric monitoring could reveal a wealth of crucial information including the CSM/ejecta geometry, clumpy structure and underlying progenitor nature etc. In this context the upcoming large aperture observing facilities shall be extremely useful.
Acknowledgments
We thank the referee for his/her several useful comments that have significantly improved the manuscript. We also thank Masaomi Tanaka for useful discussions on various polarimetric aspects and Ashish Raj who kindly agreed to obtain HFOSC spectra during his observations. BK acknowledges the Science and Engineering Research Board (SERB) under the Department of Science & Technology, Govt. of India, for financial assistance in the form of National Post-Doctoral Fellowship (Ref. no. PDF/2016/001563). CE acknowledges (i) The National Key R & D Program of China grant No. 2017YFA0402600 and (ii) The International Partnership Program of Chinese Academy of Sciences grant No. 114A11KYSB20160008. BK, DKS and GCA also acknowledge BRICS grant DST/IMRCD/BRICS/PilotCall1/MuMeSTU/2017(G) for the present work. DKS and GCA also acknowledge DST/JSPS grant, DST/INT/JSPS/P/281/2018. SBP acknowledges BRICS grant DST/IMRCD/BRICS/Pilotcall/ProFCheap/2017(G) for this work.
We thank the staff of IAO, Hanle and CREST, Hosakote that made HFOSC observations possible. The facilities at IAO and CREST are operated by the Indian Institute of Astrophysics, Bangalore. This work has made use of data from the European Space Agency (ESA) mission Gaia (https://www.cosmos.esa.int/gaia), processed by the Gaia Data Processing and Analysis Consortium (DPAC, https://www.cosmos.esa.int/web/gaia/dpac/consortium). Funding for the DPAC has been provided by national institutions, in particular the institutions participating in the Gaia Multilateral Agreement. This research has made use of the SIMBAD data base, operated at CDS, Strasbourg, France. This research made use of RedPipe666https://github.com/sPaMFouR/RedPipe, an assemblage of data reduction and analysis scripts written by AS.
References
- Akitaya et al. (2014) Akitaya H., et al., 2014, in Ramsay S. K., McLean I. S., Takami H., eds, SPIE Conf. Ser. Vol. 9147, Ground-based and Airborne Instrumentation for Astronomy V. p. 91474O
- Bilinski et al. (2018) Bilinski C., et al., 2018, MNRAS, 475, 1104
- Bose et al. (2016) Bose S., Kumar B., Misra K., Matsumoto K., Kumar B., Singh M., Fukushima D., Kawabata M., 2016, MNRAS, 455, 2712
- Branch & Wheeler (2017) Branch D., Wheeler J. C., 2017, Supernova Explosions, Springer-Verlag GmbH Germany
- Chandra et al. (2017) Chandra P., Fransson C., Chevalier R. A., 2017, The Astronomer’s Telegram, 10936
- Chevalier & Fransson (1994) Chevalier R. A., Fransson C., 1994, ApJ, 420, 268
- Chornock et al. (2010) Chornock R., Filippenko A. V., Li W., Silverman J. M., 2010, ApJ, 713, 1363
- Chugai (2001) Chugai N. N., 2001, MNRAS, 326, 1448
- Chugai & Danziger (1994) Chugai N. N., Danziger I. J., 1994, MNRAS, 268, 173
- Das et al. (2013) Das H. S., Medhi B. J., Wolf S., Bertrang G., Deb Roy P., Chakraborty A., 2013, MNRAS, 436, 3500
- Dastidar et al. (2019) Dastidar R., et al., 2019, MNRAS, 486, 2850
- Dwarkadas (2011) Dwarkadas V. V., 2011, MNRAS, 412, 1639
- Eswaraiah et al. (2012) Eswaraiah C., Pandey A. K., Maheswar G., Chen W. P., Ojha D. K., Chandola H. C., 2012, MNRAS, 419, 2587
- Eswaraiah et al. (2013) Eswaraiah C., Maheswar G., Pandey A. K., Jose J., Ramaprakash A. N., Bhatt H. C., 2013, A&A, 556, A65
- Eswaraiah et al. (2019) Eswaraiah C., et al., 2019, ApJ, 875, 64
- Fassia et al. (2001) Fassia A., et al., 2001, MNRAS, 325, 907
- Filippenko (1997) Filippenko A. V., 1997, ARA&A, 35, 309
- Fox et al. (2013) Fox O. D., Filippenko A. V., Skrutskie M. F., Silverman J. M., Ganeshalingam M., Cenko S. B., Clubb K. I., 2013, AJ, 146, 2
- Fransson et al. (2002) Fransson C., et al., 2002, ApJ, 572, 350
- Gaia Collaboration et al. (2018) Gaia Collaboration et al., 2018, A&A, 616, A1
- Gal-Yam et al. (2007) Gal-Yam A., et al., 2007, ApJ, 656, 372
- Gangopadhyay et al. (2019) Gangopadhyay A., et al., 2019, To be submitted in MNRAS
- Gavrilchenko et al. (2014) Gavrilchenko T., Klein C. R., Bloom J. S., Richards J. W., 2014, MNRAS, 441, 715
- Green et al. (2018) Green G. M., et al., 2018, MNRAS, 478, 651
- Habergham et al. (2014) Habergham S. M., Anderson J. P., James P. A., Lyman J. D., 2014, MNRAS, 441, 2230
- Heiles (2000) Heiles C., 2000, AJ, 119, 923
- Hoffman et al. (2008) Hoffman J. L., Leonard D. C., Chornock R., Filippenko A. V., Barth A. J., Matheson T., 2008, ApJ, 688, 1186
- Hoflich (1991) Hoflich P., 1991, A&A, 246, 481
- Hole et al. (2010) Hole K. T., Kasen D., Nordsieck K. H., 2010, ApJ, 720, 1500
- Kasen et al. (2003) Kasen D., et al., 2003, ApJ, 593, 788
- Kasen et al. (2006) Kasen D., Thomas R. C., Nugent P., 2006, ApJ, 651, 366
- Kawabata et al. (2002) Kawabata K. S., et al., 2002, ApJ, 580, L39
- Kiewe et al. (2012) Kiewe M., et al., 2012, ApJ, 744, 10
- Kumar et al. (2014) Kumar B., Pandey S. B., Eswaraiah C., Gorosabel J., 2014, MNRAS, 442, 2
- Kumar et al. (2016) Kumar B., Pandey S. B., Eswaraiah C., Kawabata K. S., 2016, MNRAS, 456, 3157
- Kumar et al. (2018) Kumar B., Singh A., Srivastav S., Sahu D. K., Anupama G. C., 2018, MNRAS, 473, 3776
- Lee et al. (2018) Lee C. D., Eswaraiah C., Chen W. P., Pandey A. K., 2018, AJ, 156, 115
- Leonard & Filippenko (2005) Leonard D. C., Filippenko A. V., 2005, in Turatto M., Benetti S., Zampieri L., Shea W., eds, Astronomical Society of the Pacific Conference Series Vol. 342, 1604-2004: Supernovae as Cosmological Lighthouses. p. 330 (arXiv:astro-ph/0409518)
- Leonard et al. (2000) Leonard D. C., Filippenko A. V., Barth A. J., Matheson T., 2000, ApJ, 536, 239
- Leonard et al. (2006) Leonard D. C., et al., 2006, Nature, 440, 505
- Li et al. (1998) Li W.-D., Li C., Filippenko A. V., Moran E. C., 1998, IAU Circ., 6829
- Li et al. (2011) Li W., Chornock R., Leaman J., Filippenko A. V., Poznanski D., Wang X., Ganeshalingam M., Mannucci F., 2011, MNRAS, 412, 1473
- Mauerhan et al. (2013) Mauerhan J. C., et al., 2013, MNRAS, 430, 1801
- Mauerhan et al. (2014) Mauerhan J., et al., 2014, MNRAS, 442, 1166
- Mauerhan et al. (2017a) Mauerhan J. C., et al., 2017a, ApJ, 834, 118
- Mauerhan et al. (2017b) Mauerhan J. C., Filippenko A. V., Brink T. G., Zheng W., 2017b, The Astronomer’s Telegram, 10911
- Maund et al. (2007a) Maund J. R., Wheeler J. C., Patat F., Baade D., Wang L., Höflich P., 2007a, MNRAS, 381, 201
- Maund et al. (2007b) Maund J. R., Wheeler J. C., Patat F., Wang L., Baade D., Höflich P. A., 2007b, ApJ, 671, 1944
- Medhi et al. (2007) Medhi B. J., Maheswar G., Brijesh K., Pandey J. C., Kumar T. S., Sagar R., 2007, MNRAS, 378, 881
- Moriya et al. (2014) Moriya T. J., Tominaga N., Langer N., Nomoto K., Blinnikov S. I., Sorokina E. I., 2014, A&A, 569, A57
- Nayana & Chandra (2017) Nayana A. J., Chandra P., 2017, The Astronomer’s Telegram, 11015
- Neha et al. (2016) Neha S., Maheswar G., Soam A., Lee C. W., Tej A., 2016, A&A, 588, A45
- Newton & Puckett (2010) Newton J., Puckett T., 2010, Central Bureau Electronic Telegrams, 2532
- Ofek et al. (2014) Ofek E. O., et al., 2014, ApJ, 788, 154
- Pandey et al. (2009) Pandey J. C., Medhi B. J., Sagar R., Pandey A. K., 2009, MNRAS, 396, 1004
- Pastorello et al. (2013) Pastorello A., et al., 2013, ApJ, 767, 1
- Patat (2017) Patat F., 2017, Introduction to Supernova Polarimetry. Handbook of Supernovae. Springer, Cham. p. 1017
- Patat et al. (2011) Patat F., Taubenberger S., Benetti S., Pastorello A., Harutyunyan A., 2011, A&A, 527, L6
- Patel et al. (2013) Patel M. K., Pandey J. C., Savanov I. S., Prasad V., Srivastava D. C., 2013, MNRAS, 430, 2154
- Poole et al. (2008) Poole T. S., et al., 2008, MNRAS, 383, 627
- Poznanski et al. (2012) Poznanski D., Prochaska J. X., Bloom J. S., 2012, MNRAS, 426, 1465
- Prieto et al. (2007) Prieto J. L., et al., 2007, arXiv e-prints, p. arXiv:0706.4088
- Prieto et al. (2013) Prieto J. L., Brimacombe J., Drake A. J., Howerton S., 2013, ApJ, 763, L27
- Prieto et al. (2017) Prieto J. L., et al., 2017, Research Notes of the AAS, 1, 28
- Rakshit et al. (2017) Rakshit S., Stalin C. S., Muneer S., Neha S., Paliya V. S., 2017, ApJ, 835, 275
- Ramaprakash et al. (1998) Ramaprakash A. N., Gupta R., Sen A. K., Tandon S. N., 1998, A&AS, 128, 369
- Rautela et al. (2004) Rautela B. S., Joshi G. C., Pandey J. C., 2004, Bulletin of the Astronomical Society of India, 32, 159
- Reilly et al. (2017) Reilly E., Maund J. R., Baade D., Wheeler J. C., Höflich P., Spyromilio J., Patat F., Wang L., 2017, MNRAS, 470, 1491
- Sahu et al. (2018) Sahu D. K., Anupama G. C., Chakradhari N. K., Srivastav S., Tanaka M., Maeda K., Nomoto K., 2018, MNRAS, 475, 2591
- Schlafly & Finkbeiner (2011) Schlafly E. F., Finkbeiner D. P., 2011, ApJ, 737, 103
- Schlegel (1990) Schlegel E. M., 1990, MNRAS, 244, 269
- Schmidt et al. (1992) Schmidt G. D., Elston R., Lupie O. L., 1992, AJ, 104, 1563
- Serkowski et al. (1975) Serkowski K., Mathewson D. S., Ford V. L., 1975, ApJ, 196, 261
- Shapiro & Sutherland (1982) Shapiro P. R., Sutherland P. G., 1982, ApJ, 263, 902
- Singh et al. (2018) Singh A., Srivastav S., Kumar B., Anupama G. C., Sahu D. K., 2018, MNRAS, 480, 2475
- Singh et al. (2019) Singh A., et al., 2019, Accepted in ApJ
- Smith (2014) Smith N., 2014, ARA&A, 52, 487
- Smith (2017) Smith N., 2017, Interacting Supernovae: Types IIn and Ibn. Handbook of Supernovae. Springer, Cham. p. 403
- Smith & McCray (2007) Smith N., McCray R., 2007, ApJ, 671, L17
- Smith et al. (2007) Smith N., et al., 2007, ApJ, 666, 1116
- Smith et al. (2008) Smith N., Chornock R., Li W., Ganeshalingam M., Silverman J. M., Foley R. J., Filippenko A. V., Barth A. J., 2008, ApJ, 686, 467
- Smith et al. (2010) Smith N., Chornock R., Silverman J. M., Filippenko A. V., Foley R. J., 2010, ApJ, 709, 856
- Smith et al. (2014) Smith N., Mauerhan J. C., Prieto J. L., 2014, MNRAS, 438, 1191
- Soam et al. (2015) Soam A., Maheswar G., Lee C. W., Dib S., Bhatt H. C., Tamura M., Kim G., 2015, A&A, 573, A34
- Srivastav et al. (2016) Srivastav S., Ninan J. P., Kumar B., Anupama G. C., Sahu D. K., Ojha D. K., Prabhu T. P., 2016, MNRAS, 457, 1000
- Stritzinger et al. (2018) Stritzinger M. D., et al., 2018, A&A, 609, A135
- Taddia et al. (2013) Taddia F., et al., 2013, A&A, 555, A10
- Taddia et al. (2015) Taddia F., et al., 2015, A&A, 580, A131
- Tanaka et al. (2017) Tanaka M., Maeda K., Mazzali P. A., Kawabata K. S., Nomoto K., 2017, ApJ, 837, 105
- Tonry (2011) Tonry J. L., 2011, PASP, 123, 58
- Tran (1995) Tran H. D., 1995, ApJ, 440, 565
- Tran et al. (1997) Tran H. D., Filippenko A. V., Schmidt G. D., Bjorkman K. S., Jannuzi B. T., Smith P. S., 1997, PASP, 109, 489
- Turatto et al. (2003) Turatto M., Benetti S., Cappellaro E., 2003, in Hillebrandt W., Leibundgut B., eds, From Twilight to Highlight: The Physics of Supernovae. p. 200 (arXiv:astro-ph/0211219), doi:10.1007/10828549_26
- Vinko et al. (2012) Vinko J., et al., 2012, Central Bureau Electronic Telegrams, 3022
- Wang & Wheeler (2008) Wang L., Wheeler J. C., 2008, ARA&A, 46, 433
- Wang et al. (1996) Wang L., Wheeler J. C., Li Z., Clocchiatti A., 1996, ApJ, 467, 435
- Wang et al. (2001) Wang L., Howell D. A., Höflich P., Wheeler J. C., 2001, ApJ, 550, 1030
- Wang et al. (2017) Wang J.-W., Lai S.-P., Eswaraiah C., Clemens D. P., Chen W.-P., Pandey A. K., 2017, ApJ, 849, 157
- Whittet & van Breda (1978) Whittet D. C. B., van Breda I. G., 1978, A&A, 66, 57
- Zhang et al. (2012) Zhang T., et al., 2012, AJ, 144, 131