Dynamic in-situ imaging of methane hydrate formation and self-preservation
Abstract
We present the results of dynamic in-situ 3D X-ray imaging of methane hydrates microstructure during methane hydrate formation and decomposition in sand samples. Short scanning times and high resolution provided by synchrotron X-rays allowed for better understanding of water movement and different types of gas-hydrate formation. Complementing previous observations, we conclude that the process of gas-hydrate formation is accompanied by the water movements caused by cryogenic water suction that happens in short sequences with longer equilibrium states in between (when the water is immobile). Based on the 3D microstructure we identified two types of gas-hydrate formation: (i) into the gas pockets and (ii) inside water volumes. During the decomposition in the self-preservation mode (pressure drop at negative temperatures) the latter remains more stable compared to the hydrate formed as growing into the gas pocket. This means that the history of the gas-hydrate formation influences its behaviour at the decomposition stage (e.g. gas-hydrate production).
keywords:
gas hydrates , X-ray synchrotron tomography , phase-contrast tomography1 Introduction
Natural gas hydrates are solid crystals that are mostly formed from water and methane. They accumulate worldwide in favorable thermobaric conditions (in permafrost regions on land and in bottom sediments offshore) and form hydrocarbon resources exceeding those in traditional and shale deposits (Birchwood et al., 2010). They may also affect humanity in various other ways including flow assurance, safety issues, possible impact on ecology and climate change (Koh and Sloan, 2007). There are different ways of learning more about natural gas-hydrate systems: studying natural pressurized hydrate-bearing cores (Yoneda et al., 2017; Jin et al., 2016), geophysical characterization of natural gas-hydrate accumulations (Riedel et al., 2010), pilot experiments on the gas-hydrate production (White and McGrail, 2009; Sun et al., 2014b).
For a better understanding of natural gas-hydrate systems we need a better knowledge of the hydrate formation/decomposition and associated processes in realistic systems. We are also interested in studying how these processes affect the rock physical properties. This is important for further development of the geophysical methods for gas-hydrate accumulations exploration and monitoring. In most cases this is done by using specialized laboratory setups for forming synthetic gas hydrates in rock samples and studying their physical properties (Waite et al., 2009). It turns out that macro-properties highly depend on the sample microstructure including matrix composition, pore structure, hydrate morphology, etc.
So it is clearly beneficial to combine the laboratory experiments on forming and studying hydrate-bearing samples with their imaging at different scales. For example, different scenarios of hydrate formation result in different hydrate morphology in pore filling, which considerably affects acoustic macro-properties (Waite et al., 2009; Priest et al., 2009; Dugarov et al., 2019): non-cementing (pore-filling) hydrate formation does not affect acoustic velocities much, while cementing hydrate formation type results in a faster increase of acoustic velocities. X-ray Computed Tomography (CT) is widely used to image the detailed structure of rocks which have a complicated porous structure consisting of materials very different in properties: mineral particles, gas, multi-phase liquids. Standard laboratory X-ray CT devices require long exposure time (typically from half an hour to several hours) for imaging with micrometer resolution. They work well for imaging the microstructure of a static sample or follow very slow processes. microstructure of the methane-hydrate formation was reported in (Zhao et al., 2015) with some conclusions on distribution of the gas-hydrate particles and the matrix grains. Lei and Santamarina (2018) showed that the gas-hydrate formation is displacive and segregated since the hydrate extracts water from the sediments. Later Lei et al. (2019b) reported evidence of water movement and described 3 types of hydrate formation mechanisms: hydrate growth over sand particles, hydrate growth by water invasion into gas pockets (via hydrate tubes), and poet-formation hydrate morphology evolution (via diffusion of water vapor or dissolved methane).
During the last decade, X-ray imaging has developed into a useful tool to visualize in-situ processes in geomaterials. At the resolution level of for parallel X-ray geometry (Fusseis et al., 2014b; Saif et al., 2016), and of for transmission X-ray microscope geometry (De Andrade et al., 2016), synchrotron-based tomography is outperforming all other three-dimensional imaging methods for fast dynamic processes in bulky samples (Gibbs et al., 2015). Characteristic time for one full scan is about 1-5 min for microtomography and about 5- for nanotomography, depending on the sample size, instrument optics, and hardware limitations. Recent instrument developments (Mokso et al., 2017) allow to capture processes with sub-second temporal resolution. Important applications of fast imaging include multi-phase fluid flow in porous rocks (Youssef et al., 2013; Blunt et al., 2013; Fusseis et al., 2014a), deformation and geomechanical testing of samples (Baker et al., 2012; Li et al., 2015; Wang et al., 2016), and hydraulic fracturing (Kiss et al., 2015).
Natural gas-hydrate systems are specifically rich in dynamic chemical-physical processing with a wide range of time scales. Therefore dynamic tomographic imaging can contribute substantially to the understanding of these systems. Just to mention some of them: gas-hydrate formation takes hours to days in the laboratory experiments, gas-hydrate decomposition takes several seconds (or minutes to hours in the self-conservation mode), water/gas redistribution during gas-hydrate formation/decomposition may take seconds to minutes, water freezing/thawing cycles take minutes, etc.
In our experiments we aim at working with the methane hydrate in order to mimic natural gas-hydrate systems while increasing resolution and decreasing the scanning time to image fast processes. Use of synchrotron-based micro-CT imaging allows for fast scanning rate (up to ) compared to laboratory X-ray sources requiring several hours to measure high-resolution datasets (Chen and Espinoza, 2018; Lei et al., 2019b). At the same time, a high-intense coherent beam yields improvement in reconstruction quality with employing phase retrieval procedures. In (Chaouachi et al., 2015) and (Yang et al., 2016) the authors used synchrotron X-ray micro-CT for imaging formation and dissociation of Xenon hydrate which ensures good contrast between gas-hydrate and water phases. However, Xenon and methane gas hydrates may have different properties and differ in formation/decomposition processes as well (Lei et al., 2018; Haynes, 2014). In this work, we operate with the methane gas and salty water in order to model the close to reality process.
The rest of the paper is organized as follows. In Section 2 we present the setup of the tomography experiment, a scheme for the data acquisition process, and reconstruction procedures. Section 3 shows main results and observations made from analyzing the reconstructed images. In Section 4 we summarize the results and present outlook for our next tomographic experiments for studying gas hydrates.
2 Experiment Setup and Data Acquisition
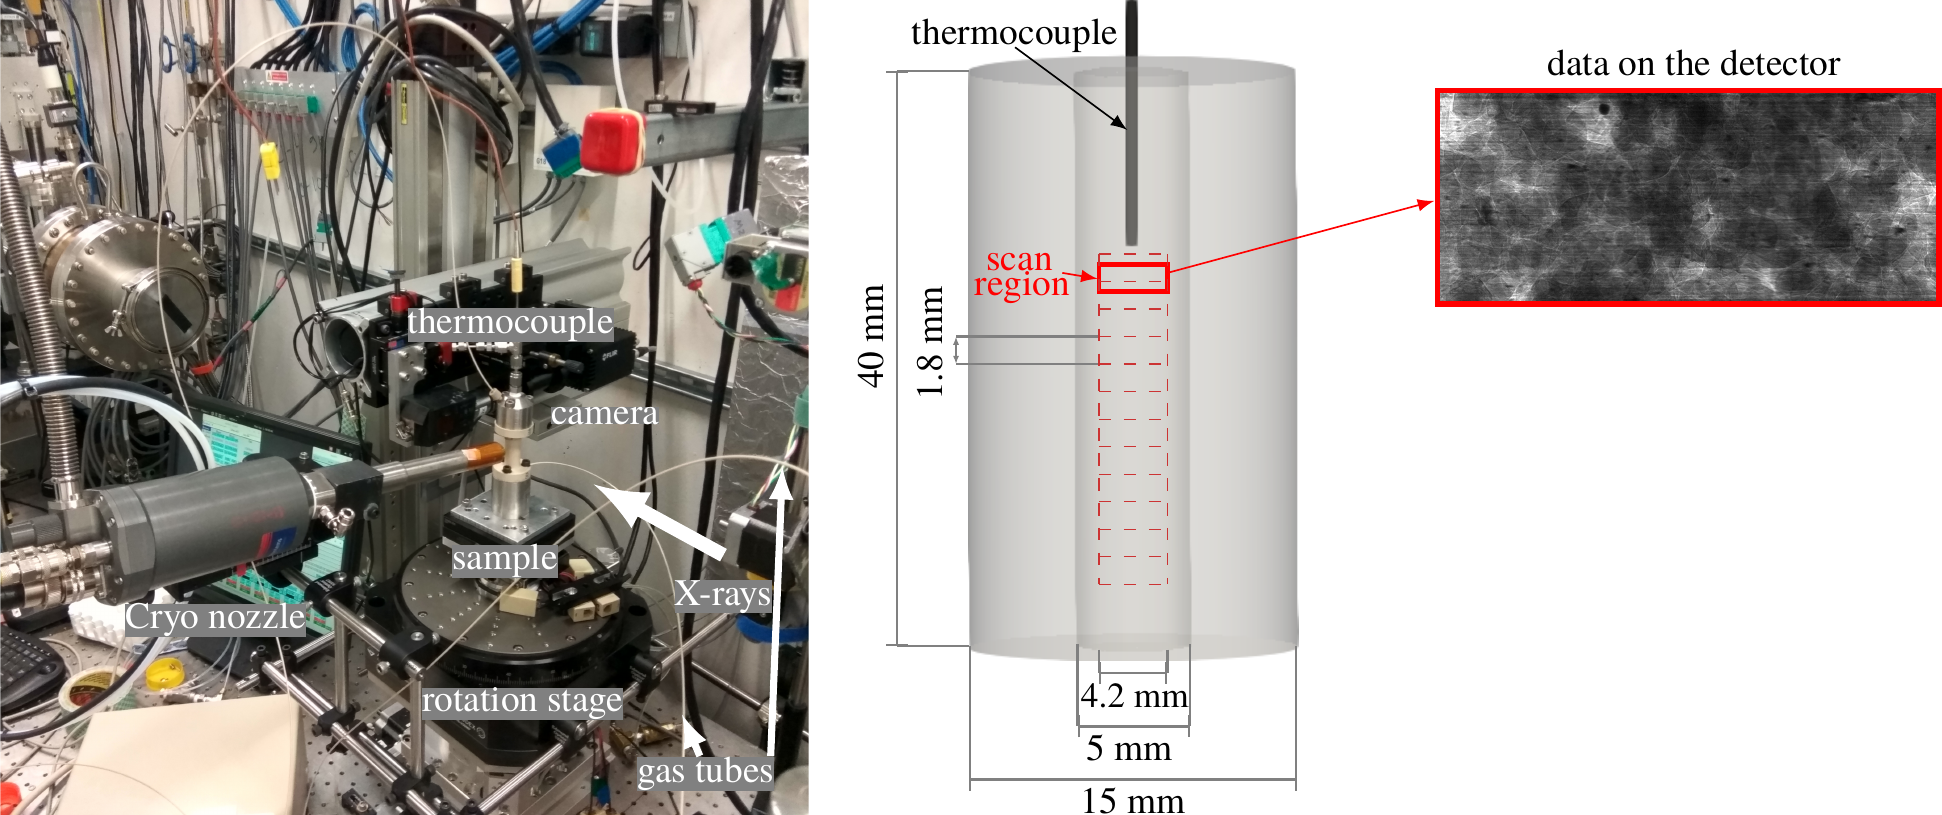
Tomographic experiments were conducted at the bending-magnet 2-BM beamline of the Advanced Photon Source (APS) using the setup shown in Figure 1, left. The environmental cell is the same as the one used in (Fusseis et al., 2014a) except that the middle vessel is produced with Polyether ether ketone (PEEK) material for better X-ray penetration. The cell is filled with wet sand, and methane gas is served via PEEK high-pressure tubes from the top and bottom sides of the cell. A thermocouple sensor for controlling the temperature in the sample is inserted from the top side. Oxford 700 Cryostream system is used for cooling the sample by a flow of nitrogen gas of low temperature. Methane gas pressure in the cell is controlled by the Teledyne ISCO D-Series single-pump system. FLIR Oryx ORX-10G-51S5M camera with pixels (pixel size ) was used in a fly scan mode where projections are recorded while the sample is continuously rotated. We were able to measure data from the detector region because of the reduced size of the X-ray beam passing the monochromator adjusted for the energy of . The camera recorded projections from a -thick LuAG:Ce single-crystal scintillator, magnified through a lens yielding a resulting isometric voxel size of .
For the experiment we used Ottawa fine white sand (grain sizes 125-), chemically pure 2.5-grade methane gas, deionized water, sodium bromide \chNaBr and potassium iodide \chKI (both SIGMA-ALDRICH, purity99%). The sample was prepared by mixing sand with salty water and packed into the environmental cell. We performed experiments for 10% mass fraction of water in relation to sand, which corresponds to the excess-gas condition of hydrate formation. We used water with different salinity levels for achieving better X-ray contrast between water, methane, and gas hydrate.
A scheme for scanning the environmental cell is shown in the center of Figure 1. The sample is located inside a cylindrical vessel of the height , with inner and outer diameters. The scanned region is large and is located close to the thermocouple for more accurate temperature monitoring, see solid-red rectangle frame in Figure 1. During the experiment we also performed several overview scans of the whole sample to analyze water re-distribution in time. The dashed-red rectangle frames in the figure show scan positions for obtaining vertical data stacks by using a total of 12 scan positions.
The right-most part of Figure 1 demonstrates an example of recorded data for one projection angle after scanning the sample at the desired region. For the measurements we used a monochromatic X-ray beam of the energy and the exposure time . Tomographic projections were collected in a fly scan mode while the sample was continuously rotated over 180∘ at 2.3∘s-1, yielding for each 180∘-scan of 2000 projection angles.
For data processing we use the SAVU tomography framework (Wadeson and Basham, 2016) consisting of a set of plugins for tomographic data processing and reconstruction. The constructed pipeline for studying gas-hydrate formation processes includes plugins for flat field correction, ring removal, and phase-retrieval filter. We also prepared our own plugin for tomography data reconstruction by using the log-polar-based imaging algorithm optimized for GPUs (Andersson et al., 2016).
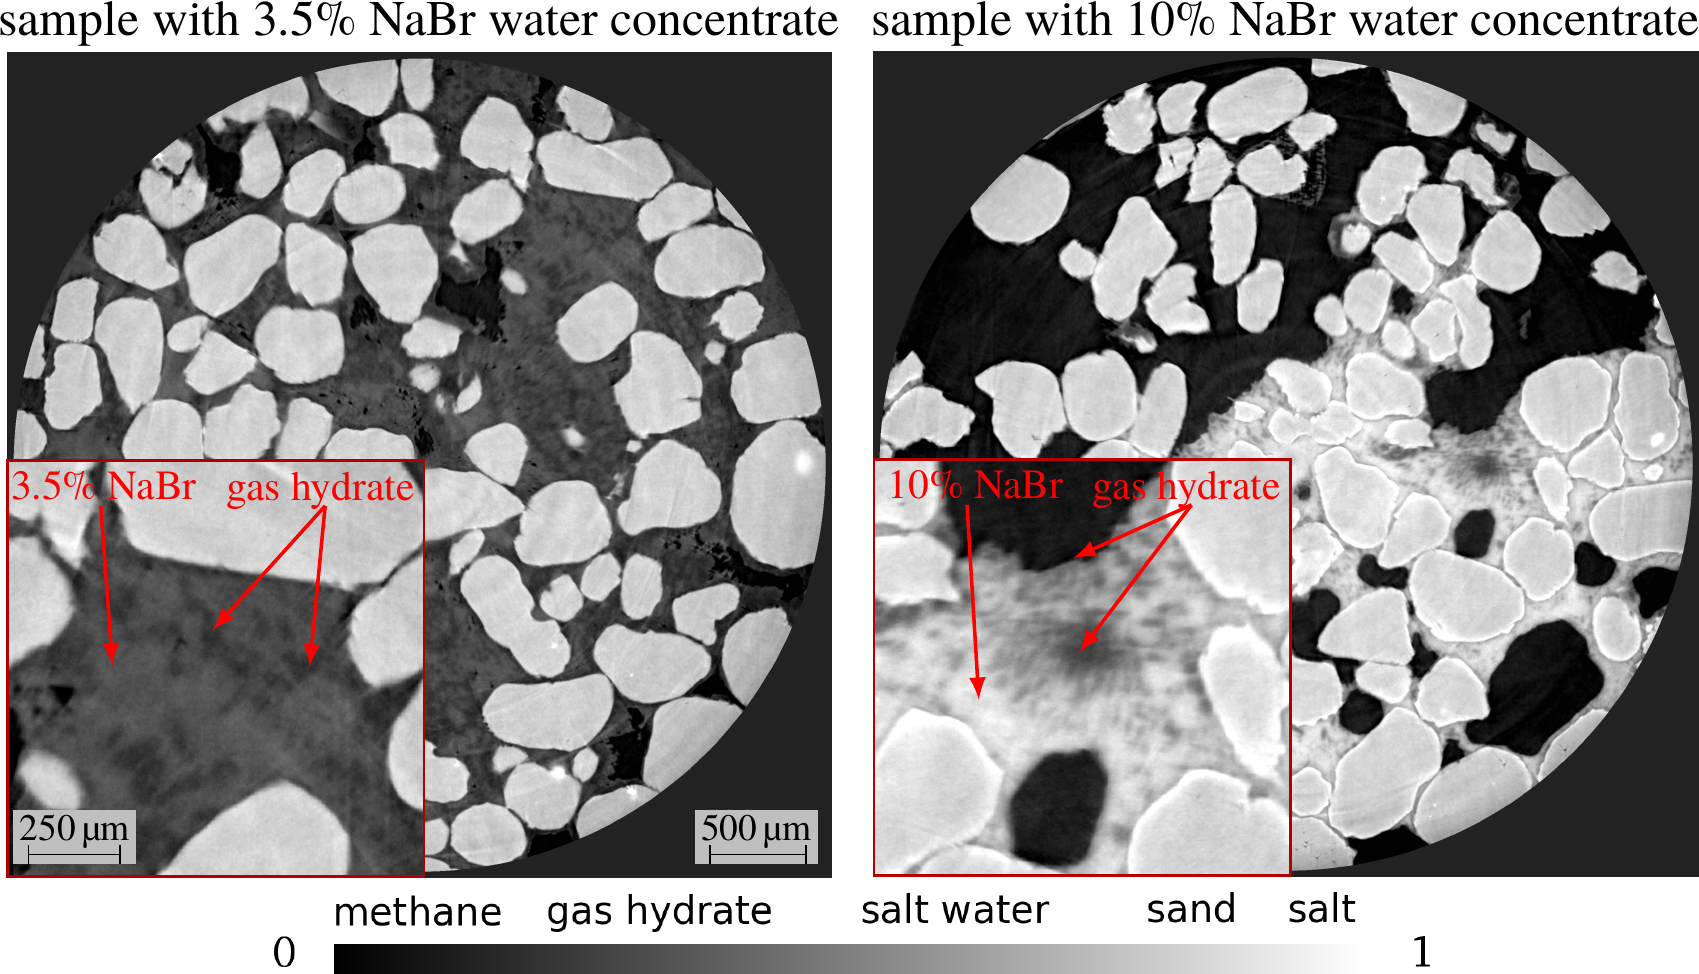
Following (Lei et al., 2018) we conducted experiments for choosing optimal water salinity for optimal contrasts between different phases: sand grains, water, methane hydrate, gas. By testing two most popular contrast-enhancing compounds, sodium bromide \chNaBr and potassium iodide \chKI, we picked the first one since it has higher X-ray attenuation for the energy range - which is optimal for the 2-BM beamline. Then we conducted two experiments on imaging gas-hydrate formation in sand with water of different salinity levels: 3.5% \chNaBr water concentrate which is close to that of the natural sea water, and 10% \chNaBr solution for better contrast between water and hydrate. These salinity values are consistent with data for natural hydrate-bearing samples. Pore water salinity for the natural samples from the Mallik 2L-38 well, Mackenzie Delta, Canada, is between 4% and 12% (Winters et al., 2007). And the fluids recovered from the Mount Elbert Well, Alaska North Slope, show salinity values from 2.5% to 7.5% (Torres et al., 2011).
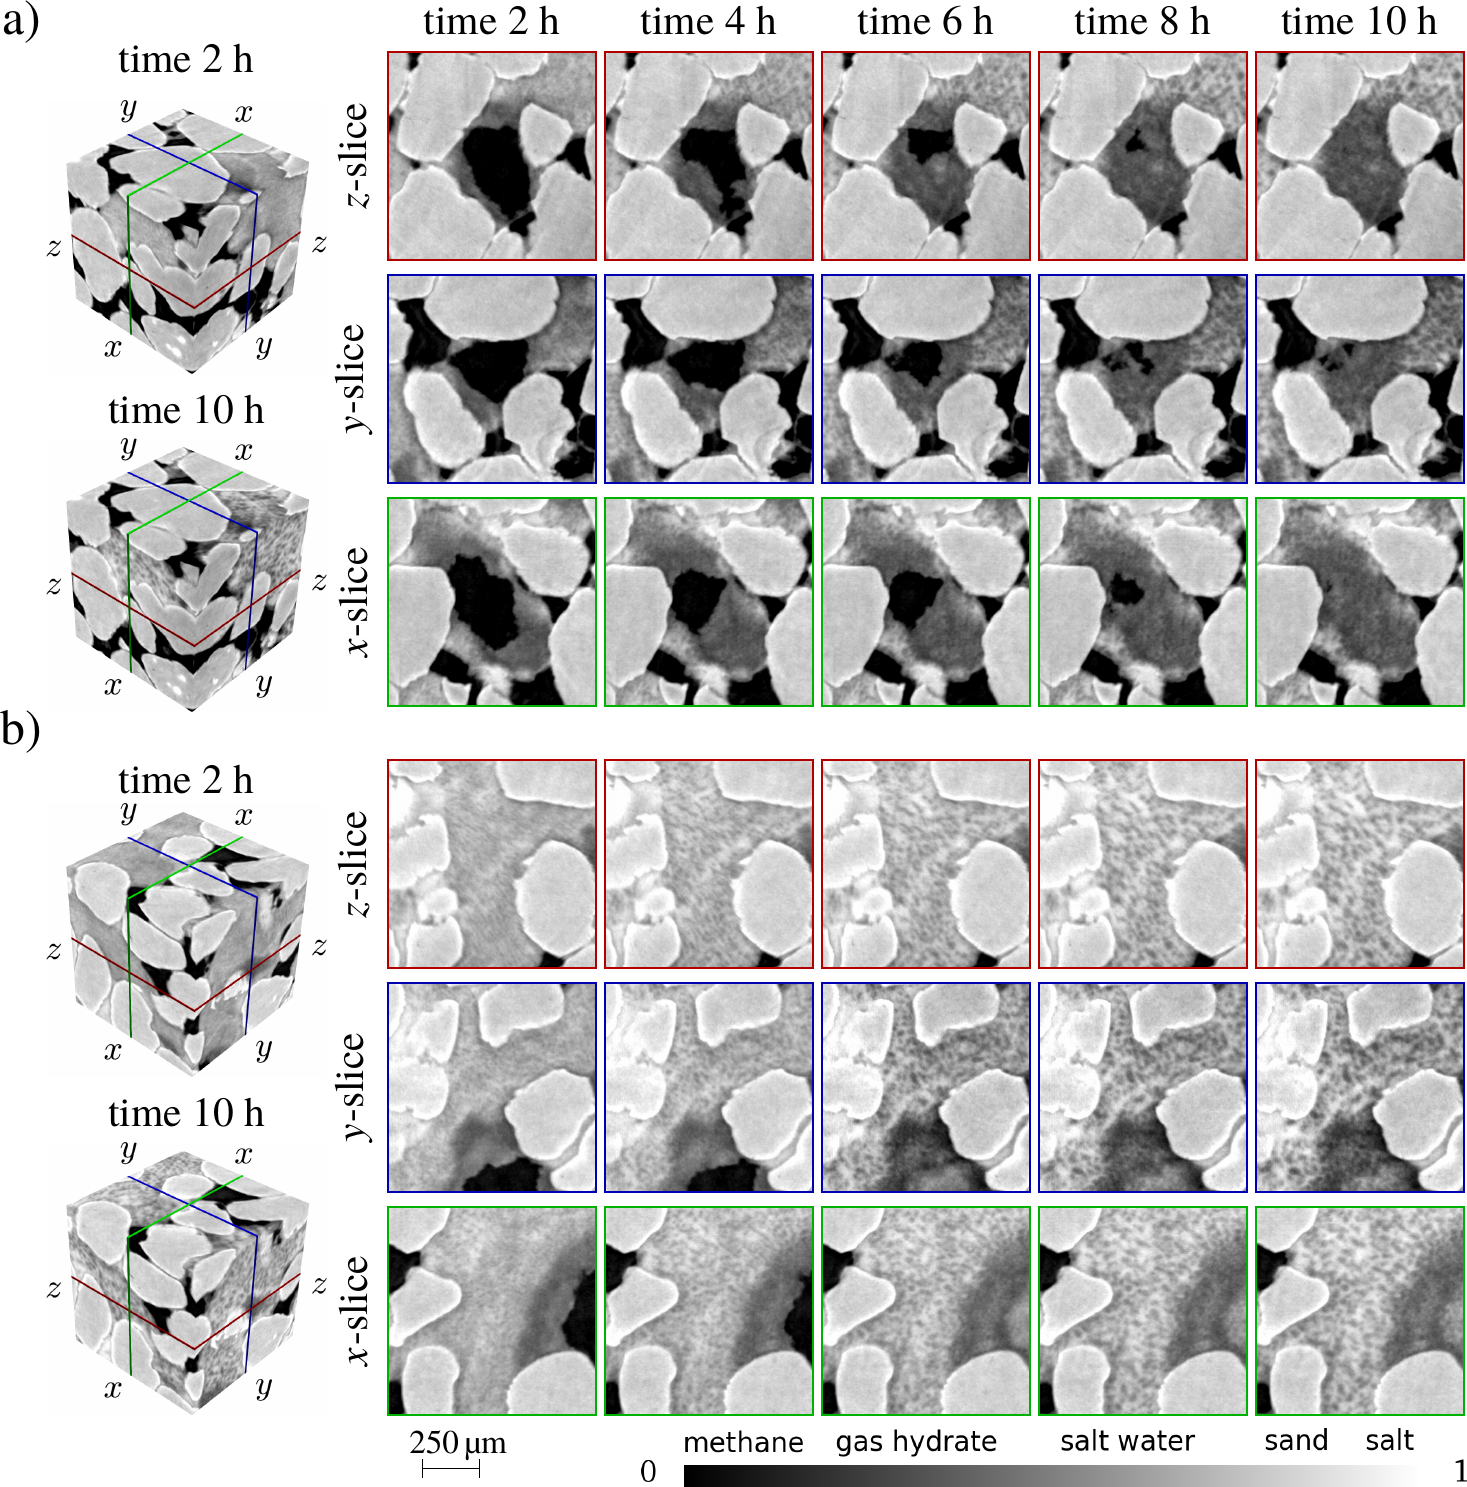
In Figure 2 one can see examples of reconstructed images during the hydrate formation from water with salinity 3.5% (left) and 10% (right). The figure is equipped with the colorbar: black corresponds to the methane gas, dark gray - to the gas hydrate, light gray - to salty water, which in the case of 10% \chNaBr solution is very close to or even lighter gray of sand grains. White color also appears at the end of the experiments when the hydrate formation consumes almost all water leaving very salty brine or even pure salt. According to reconstruction results, the contrast between gas hydrate and water for the 3.5% NaBr is not sufficient to reliable segment out the gas hydrate. Therefore, we chose to use 10% \chNaBr water concentrate for further experiments. In this case, the attenuation coefficient of salty water becomes close to the coefficient of sand, which is not a problem though because sand particles are almost static during the experiment and can clearly be distinguished from water by using standard segmentation techniques.
3 Imaging Results and Discussion
In this section, we present results by describing different phenomena observed inside the sample during the whole experiment time. To simulate gas-hydrate growth we followed certain temperature and gas pressure conditions, see (Sun et al., 2014a). Specifically, we used the temperature T = and the pressure P = , which correspond to the methane-hydrate stability zone. Temperature is positive so that all non-smooth boundaries appearing correspond to the methane gas hydrate (water forms smooth boundaries with curvatures formed by the surface tension forces). Note that we use the excess-gas method of the hydrate formation in this case as we have about 10 % initial water saturation in the sand sample.
We followed the gas-hydrate formation process by scanning the sample automatically every 15 minutes. We also performed continuous scanning (without delays) during the hydrate-decomposition stage. Each full scan is used to reconstruct an image of the sample volume of size ( pixels). At certain times we performed scanning of the whole sample as a vertical stack of 12 scan regions, cf. Figure 1. For better understanding the processes, we were zooming into the particular pore-space sub-volumes of the size ( pixels) as shown in the following Figures 5-7.
Later in the text we present some observation on the dynamic processes during the methane-hydrate formation. We find it convenient to refer to different gas-hydrate formation types reported from previous micro-CT imaging studies:
-
1.
Formation of the hydrate film at the water-gas boundary (Lei et al., 2019b); this hydrate shell should form quickly and remain stable after formation.
-
2.
Hydrate growth into the gas pocket by formation of hydrate spikes (Lei et al., 2019b); spike formation should take some time and should be noticed on successive images.
-
3.
gas hydrates were considered to nucleate and grow as lens-shaped clusters in the pore space without contact to grains in (Zhao et al., 2015); in the dynamic imaging it should look like growing hydrate clusters.
Normally, the hydrate shell (type 1) should prevent the exchange of gas and water slowing down and preventing the hydrate formation of type 2 or 3. Thus (Chen and Espinoza, 2018) proposed various hypotheses explaining Xenon hydrate formation in sandpack in the case when there was no obvious access to free water (thin water film that forms a capillary bridge with spontaneous water recharge or water vapor mass transport through hydrate shells). Our studies show high mobility of water, i.e. gas-hydrate formation creates structures which do not prevent water flows with no considerable water volumes getting trapped in the hydrate shells.
3.1 Water Migration
Water migration in the pore space during hydrate formation was first observed by (Gupta et al., 2006) and (Kneafsey et al., 2007). This observation was confirmed later by using a micro-focus X-ray CT apparatus (Yang et al., 2015; Lei et al., 2019a). It can be explained by the cryogenic suction phenomenon, i.e. capillary forces are pulling water towards regions becoming water-depleted due to hydrate formation. Lei et al. (2019a) reported overall displacement of water towards the metallic walls of the chamber (that should serve as an efficient heat dissipation sink).
We also observed migration of considerable water volumes. Water flows happened randomly, several times during the experiment. It first occurred 1.5 hours reaching gas-hydrate stability PT-conditions. Then water flows repeated several times in the following 12 hours. Water movement episodes are illustrated in Figure 3. The same horizontal slice is shown in both rows. The upper row (Figure 3a) shows the initial phase of the hydrate formation. Big red oval highlights typical water migration during this stage. There was mostly gas in pores in these regions 2 hours after the experiment beginning. At 2 h 15 min we see imaging artifacts indicating water movement in progress. It means that most of the water comes in in less than 70 s (scanning time). At 2 h 30 min we see that all the water is settled. Even more complicated water migration behaviour is shown in the zoom-in window in the upper row (Figure 3a): the pore is empty at 2 h 00 min, water appears on the grains at 2 h 15 min, it starts flowing away at 2 h 45 min producing imaging artifacts, at 3 h 00 min water have moved away leaving gas-hydrate shell marking previous water position. At later times water is mostly leaving this particular slice in a few stages, unveiling complicated hydrate structure, see regions marked by red circles in Figure 3b (bottom row). In the zoom-in windows one can see a similar process: water stays in the pore at 7 and 8 h, then part of water disappears leaving the hydrate structure at 9 h, hydrate formation continues also attracting some additional water at 11 h.
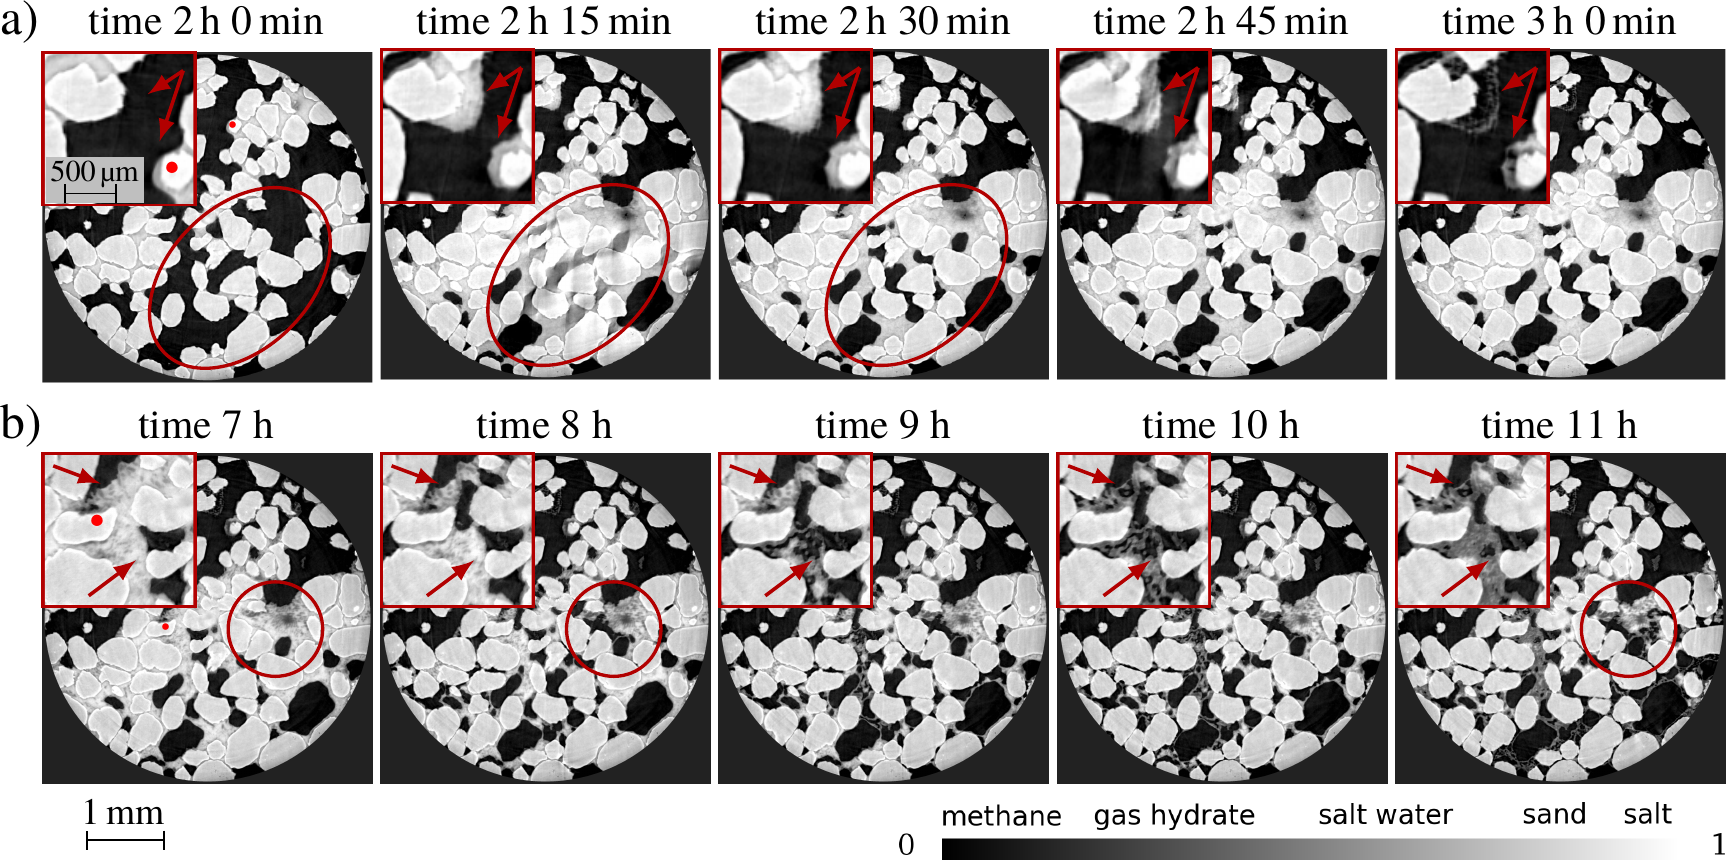
A few summarizing observations on water migration. First, water flow is not continuous. Water does not move slowly for a long time as one could expect from considering the phase transition process and action of capillary forces. It repeatedly moves several times staying steel in between. Second, water moves fast. Imaging artifacts or blurring (e.g. Figure 3, panel 2 h 15 m) indicates that large water volumes move faster than the scanning time of . Third, hydrate structures remain permeable for water. Water movement is not prevented by the hydrate shells and does not destroy them (e.g. zoom-in window in Figure 3, panel 3 h and 10 h). These hydrate structures are similar to those shown in the second figure in (Chaouachi et al., 2015). Note that if successive images are not available then these thin hydrate structures can be misinterpreted as the hydrate growth of type 2 (growth into a gas pore) from (Yang et al., 2015; Lei et al., 2019a).
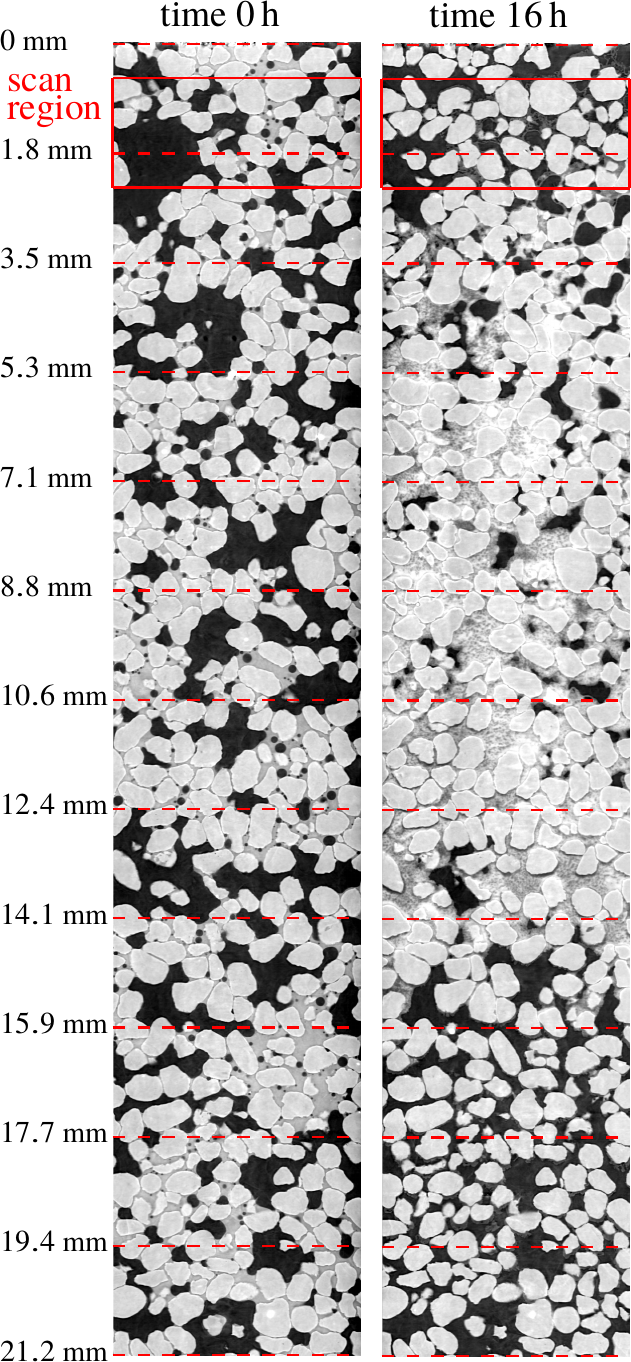
The overall pattern of water migration can be understood while comparing vertical sections through the full sample at the beginning of the experiment (Figure 4, left) and after a sufficiently long period of gas-hydrate formation (Figure 4, right). Overall water moved away from the top and bottom of the sample to support predominant gas-hydrate formation in the central part of the sample. After hydrate decomposition, water has redistributed in the sample more uniformly again due to capillary forces. In our experiments we did not notice a tendency of preferable hydrate formation near the sample side walls as reported in (Lei et al., 2019a). The reason could be the difference in the material of the walls of the environment cell: in our case they were made of plastic (PEEK) as opposed to metal walls in (Lei et al., 2019a).
3.2 Different Types of Gas-hydrate Formation
In Figure 5 we show two zooms into particular pores of our sample, that illustrate the two types of the hydrate growth:
- 1.
-
2.
Hydrate formation in a water-filled pore (central pore in Figure 5b).
The process of growing into the pore is clearly seen in the successive images. Note that the central pore in z-slice gets fully filled with the hydrate in 8 hours while left and right pores in y-slice remain free of the hydrate. It means that continuous water supply goes into one pore and does not go into the other. Also note that in this case we do not see the hydrate spikes as reported in (Lei et al., 2019a). Pore filling looks more like a frost growth.
The process of hydrate formation in a water-filled pore is shown in the central pore in Figure 5b. One can see how homogeneous gray region gains “foam” structure - becomes segmented with time due to formation of hydrate particles (darker regions) and separation of salty water (lighter regions). In some places the salinity of the remaining water gets so high that it becomes even brighter than sand particles. Note again that - and -slices in Figure 5b show both types of hydrate growth: growing into a pore and formation in a water. Note that formally we have the excess-water environment for the hydrate formation in this case. However, we see that the hydrate formation rate in this high assuming efficient mechanism of the methane transfer inside the water-filled pore.
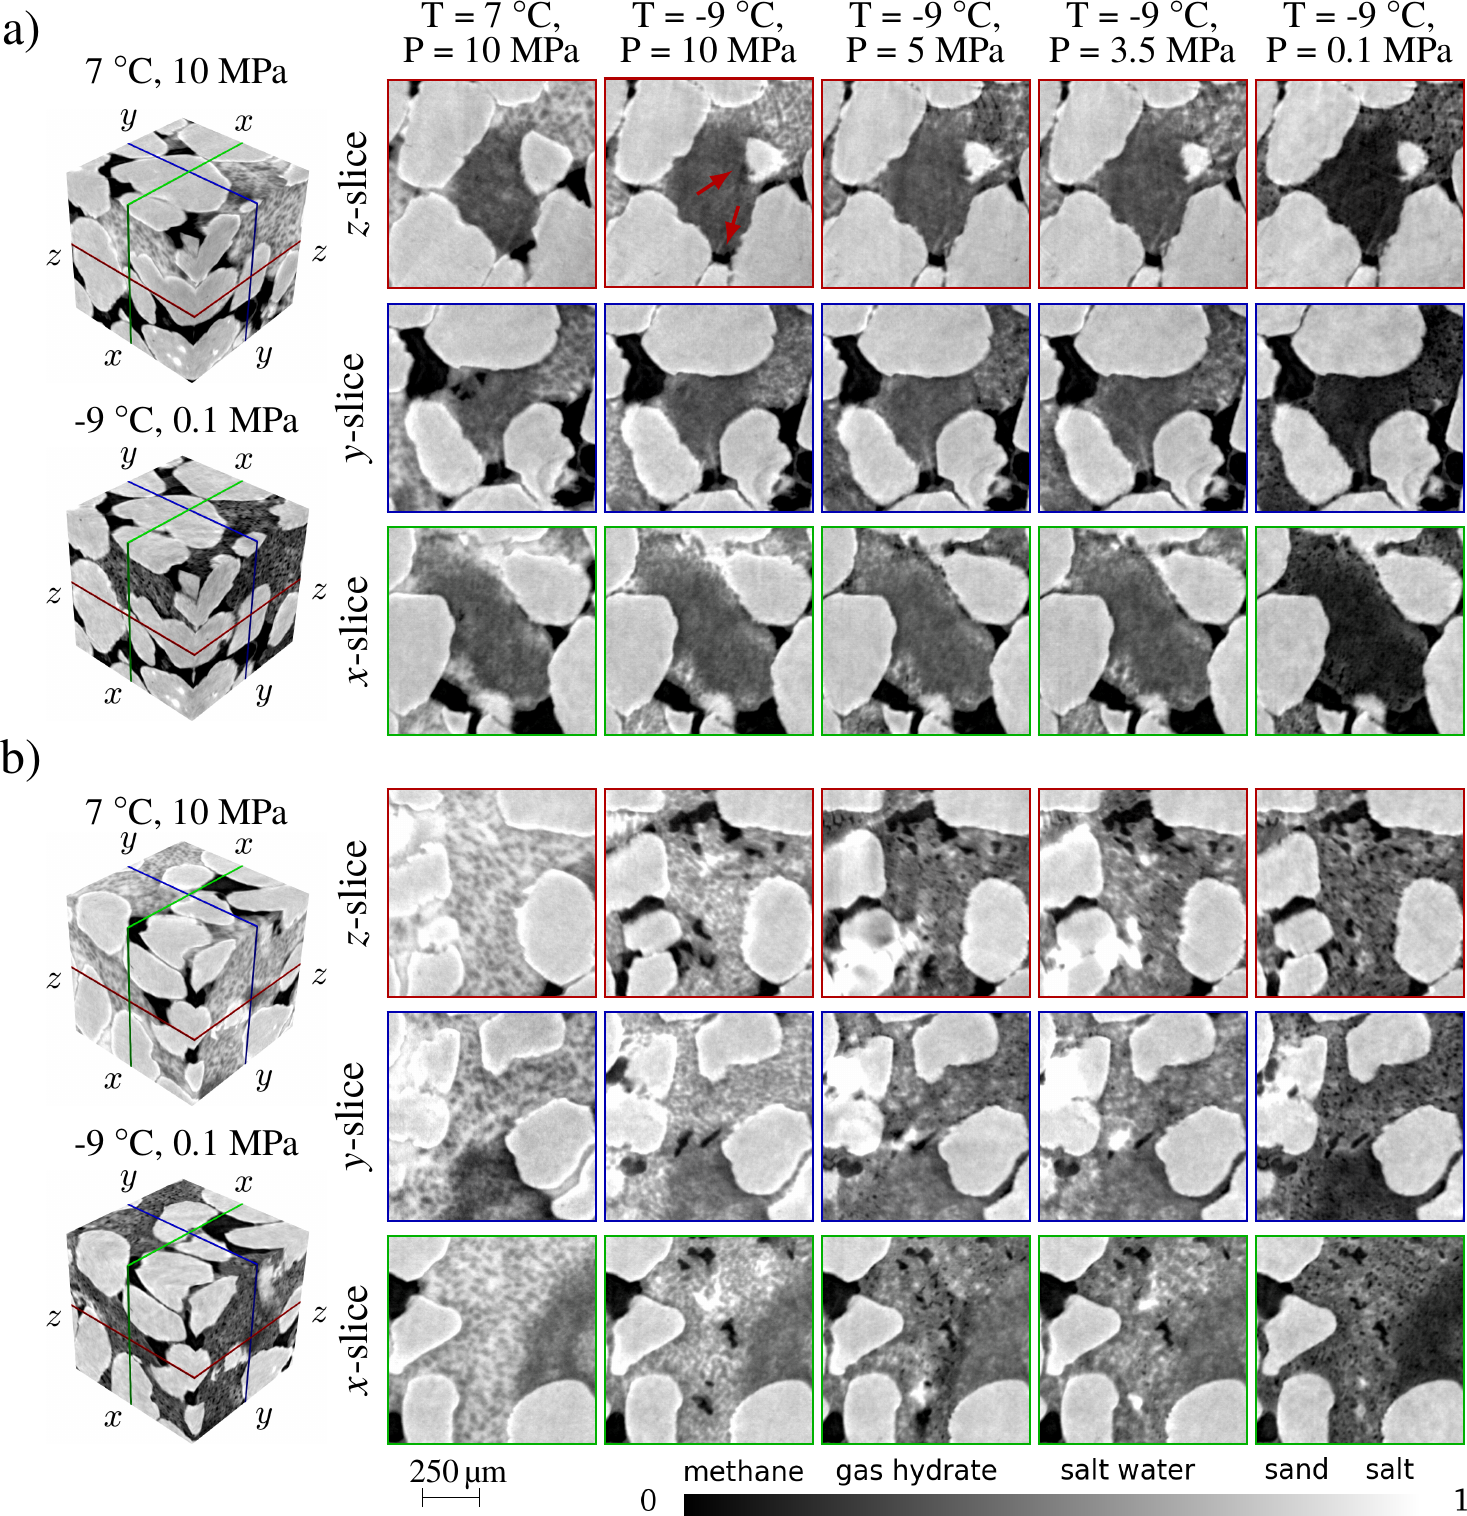
3.3 Self-preservation Effect
In this experiment, we also check the self-preservation effect of gas hydrates, see (Stern et al., 2001; Hachikubo et al., 2011; Chuvilin et al., 2018). It is known that gas hydrates can be stored at atmospheric pressure below the melting point of ice, even though this condition is outside of the hydrate stability zone. After freezing the sample to T = - we were gradually dropping the gas pressure from P = (gas hydrate stability zone) to P = (atmospheric pressure) and acquire tomography data for different pressure levels. As shown in Figure 6, the gas hydrate formed into gas pockets (Figure 5a) evaporates whenever the gas pressure dropped to . At the same time, the gas hydrate formed in water volumes is preserved. Note that water inflows and outflows during the pressure drops do not affect the hydrate structure. This means that the method of hydrate formation – excess-gas or excess-water (Waite et al., 2009; Manakov and Duchkov, 2017), has a great impact on the self-preservation effect of formed hydrates. And also, hydrate formation type should be taken into account in the modeling of gas production from hydrate deposits located in permafrost regions (for example, in (Sun et al., 2014b)).
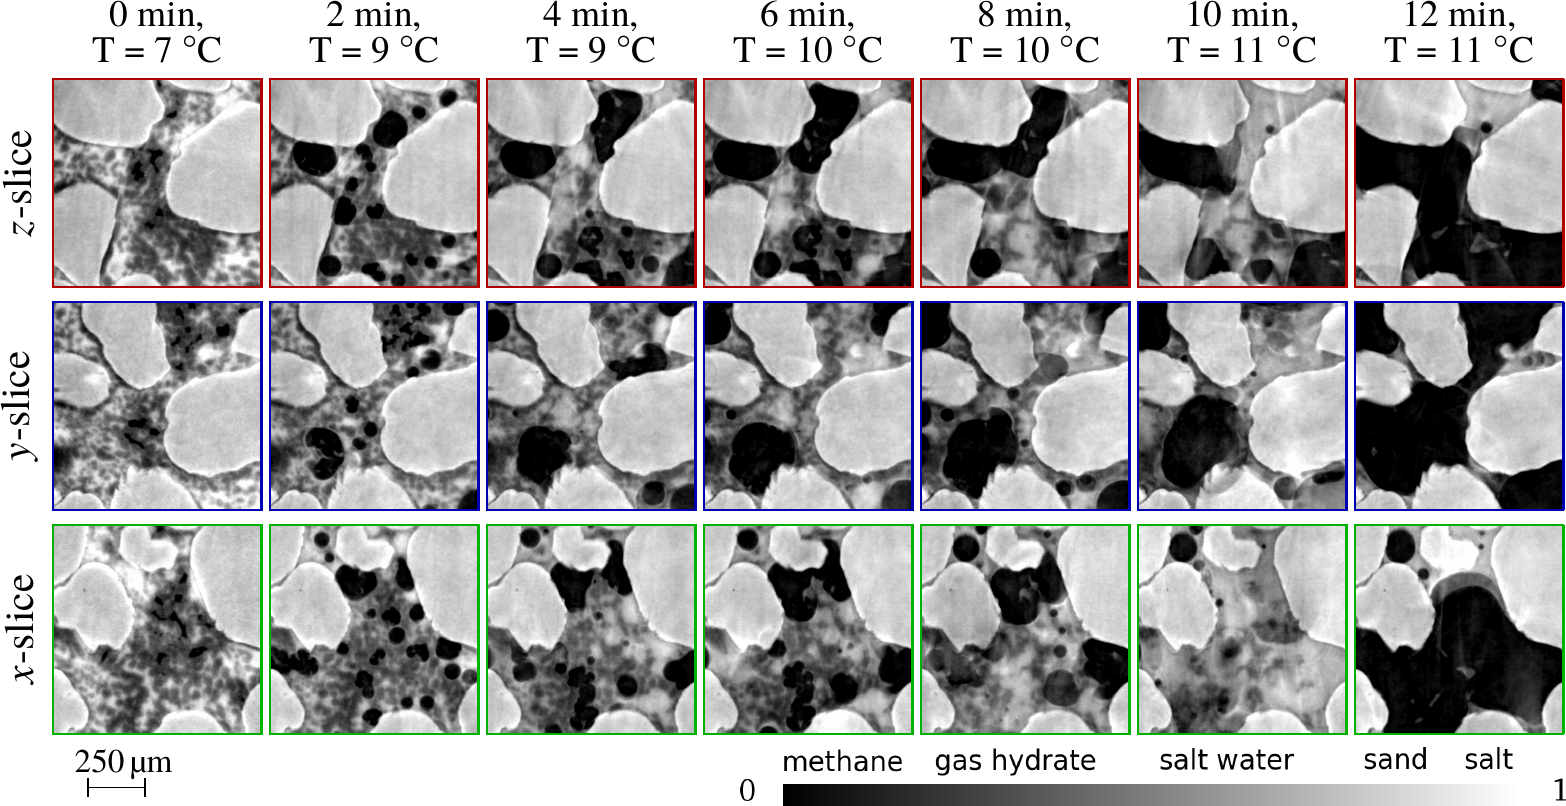
3.4 Decomposition
Synchrotron-based tomography allows capturing fast changes of the sample inner structure. The gas-hydrate decomposition process is a fast process even when it is caused by temperature increase (not pressure drop). New volumes of water and gas appear causing their redistribution in the pore space. In Figure 7 we demonstrate reconstructions of the data acquired every 2 minutes. We see seven successive images covering 12 minutes of the temperature growth from T = to T = . We see the formation of methane bubbles at the beginning. With increasing temperature one can still follow faster movement of gas, water and hydrate particles, even though there are some motion artifacts in the last images.
In fig. 3 of (Yang et al., 2016) the authors show decomposition of Xenon hydrate with a interval. First, we see that the hydrates formed from Xenon and methane have different morphology. Xenon hydrates mostly form envelopes attached to the sand grains, whereas methane hydrates have more complex heterogeneous structure. Second, the Xenon hydrate started to dissociate from water-gas boundaries, forming meniscus-shaped water layers. In the methane hydrate case the decomposition process starts in the whole hydrate volume with forming of internal methane bubbles, see Figure 7. This comparison confirms the need to use methane instead of Xenon in studies of gas hydrates.
3.5 Matrix Deformation
We noticed an interesting difference between water freezing and the hydrate formation. (Lei et al., 2019a) mentioned that matrix deformation (movement of sand grains) were caused by the hydrate formation and freezing processes. In our experiments we see that grains do not move during the hydrate formation, for example, see Figure 5, top row. However, freezing always caused some grain movement, see Figure 6, top row. One can see that the image of the triangle-like grain changed between the first image in the row (T = , T = a), and the second image in the row (T = -, T = a). While checking other images we see that freezing always caused the grain movement while the hydrate formation did not cause the particle displacement. This difference in mechanical interaction between the hydrate particles and the matrix grains may cause a difference in mechanical properties between frozen and hydrate-bearing materials.
4 Conclusions and Outlook
In this paper, we visualized the formation and decomposition of methane gas hydrates using in-situ X-ray synchrotron tomography at voxel size in 3D. The excellent spatio-temporal resolution of the instrument (single scan time was ) allows for detailed insight into the processes of interest with the added value of sufficient statistics (over 500 3D volumes were acquired over the course of the experiment)
We experimentally observed the time delay between formation of favorable PT-conditions and the actual start of the methane-hydrate formation. It took about 2 hours in the first experiment, and about 1.5 hours in the second one. We associate the beginning of the hydrate formation with the first water movement observed. Our studies show high mobility of water, i.e. gas-hydrate formation forms structures which do not prevent water flows with no considerable water volumes getting trapped in the hydrate shells.
During the hydrate formation we observed water movements that we associate with the cryogenic suction (capillary forces due to water consumption into the hydrate formation). It was not a steady slow flow of water but several fast movements (less than in duration) of considerable water volumes followed by steady-state periods. These fast water redistribution events happened in different areas at different times most likely controlled by the hydrate formation dynamics. In our experiments we did not notice a tendency of preferable hydrate formation near the sample side boundaries as reported in (Lei et al., 2019a), in contrary gas hydrates formed preferably in the central regions. A possible explanation is that the walls of high-pressure chambers were made out of different materials: plastic in our case, metal in (Lei et al., 2019a). We also observed that after the hydrate decomposition, water has redistributed to form the more uniform distribution. This effect of water redistribution should be studied in more detail and should be taken into account during the laboratory studies of physical properties of hydrate-bearing samples.
During the hydrate formation we captured two types of the gas-hydrate growth: into gas pockets and inside water volumes. These two gas-hydrate types show different properties during the decomposition in the self-preservation mode - pressure drop at negative temperatures. Gas hydrate formed in water volumes remains more stable compared to hydrate formed as growing into the gas pocket. This means that the history of the gas-hydrate formation influences its behaviour at the decomposition stage (e.g gas-hydrate production).
We noticed an interesting difference between two crystallization processes: water freezing and hydrate formation. In our experiments the water freezing caused the particle pushing (displacement of the sand grains), the hydrate formation did not result in the particle displacement. This difference in mechanical interaction between the hydrate particles and the matrix grains may cause a difference in mechanical properties of frozen and hydrate-bearing geomaterials.
Our results confirm a great variety of fast processes associated with methane gas-hydrate formation-decomposition. This justifies the necessity of using fast continuous scanning of the sample with many non-delayed rotations in order to capture fast water, gas, and gas-hydrate redistribution processes. In (Nikitin et al., 2019) we introduced a method for suppressing motion artifacts in the data acquired with continuous scanning and tested it on real data sets. Combining the developed method and fast acquisition we envision a 10-fold decrease of the scanning time that will help in suppressing motion artifacts observed in some of the images presented here.
Acknowledgments
This research used resources of the Advanced Photon Source, a U.S. Department of Energy (DOE) Office of Science User Facility operated for the DOE Office of Science by Argonne National Laboratory under Contract No. DE-AC02-06CH11357. The work is supported by the Swedish Research Council grant (2017-00583). The authors are grateful to A.D. Duchkov, A.Yu. Manakov, and K.E. Kuper for helpful discussions.
References
References
- Andersson et al. (2016) Andersson, F., Carlsson, M., Nikitin, V. V., 2016. Fast algorithms and efficient GPU implementation for the Radon transform and the back-projection operator represented as convolution operators. SIAM Journal on Imaging Sciences. 9 (2), 637–664.
- Baker et al. (2012) Baker, R. D., Brun, F., O’Shaughnessy, C., Mancini, L., Fife, L. J., Rivers, M., 2012. A four-dimensional X-ray tomographic microscopy study of bubble growth in basaltic foam. Nature Communications 3, 1135.
- Birchwood et al. (2010) Birchwood, R., Dai, J., Shelander, D., Boswell, R., Collett, T., Cook, A., Dallimore, S., Fujii, K., Imasato, Y., Fukuhara, M., et al., 2010. Developments in gas hydrates. Oilfield review 22 (1), 18–33.
- Blunt et al. (2013) Blunt, M. J., Bijeljic, B., Dong, H., Gharbi, O., Iglauer, S., Mostaghimi, P., Paluszny, A., Pentland, C., 2013. Pore-scale imaging and modelling. Advances in Water Resources 51, 197–216.
- Chaouachi et al. (2015) Chaouachi, M., Falenty, A., Sell, K., Enzmann, F., Kersten, M., Haberthür, D., Kuhs, W. F., 2015. Microstructural evolution of gas hydrates in sedimentary matrices observed with synchrotron X-ray computed tomographic microscopy. Geochemistry, Geophysics, Geosystems 16 (6), 1711–1722.
- Chen and Espinoza (2018) Chen, X., Espinoza, D., 2018. Ostwald ripening changes the pore habit and spatial variability of clathrate hydrate. Fuel 214, 614–622.
- Chuvilin et al. (2018) Chuvilin, E., Bukhanov, B., Davletshina, D., Grebenkin, S., Istomin, V., 2018. Dissociation and self-preservation of gas hydrates in permafrost. Geosciences 8 (9), 431.
- De Andrade et al. (2016) De Andrade, V., Deriy, A., Wojcik, M. J., Gürsoy, D., Shu, D., Fezzaa, K., De Carlo, F., 2016. Nanoscale 3d imaging at the advanced photon source. SPIE Newsroom, 2–4.
- Dugarov et al. (2019) Dugarov, G. A., Duchkov, A. A., Duchkov, A. D., Drobchik, A. N., 2019. Laboratory validation of effective acoustic velocity models for samples bearing hydrates of different type. Journal of Natural Gas Science and Engineering 63, 38–46.
- Fusseis et al. (2014a) Fusseis, F., Steeb, H., Xiao, X., Zhu, W.-l., Butler, I. B., Elphick, S., Mäder, U., 2014a. A low-cost X-ray-transparent experimental cell for synchrotron-based X-ray microtomography studies under geological reservoir conditions. Journal of synchrotron radiation 21 (1), 251–253.
- Fusseis et al. (2014b) Fusseis, F., Xiao, X., Schrank, C., De Carlo, F., 2014b. A brief guide to synchrotron radiation-based microtomography in (structural) geology and rock mechanics. Journal of Structural Geology 65, 1–16.
- Gibbs et al. (2015) Gibbs, J. W., Mohan, K. A., Gulsoy, E. B., Shahani, A. J., Xiao, X., Bouman, C. A., De Graef, M., Voorhees, P. W., Jul 2015. The three-dimensional morphology of growing dendrites. Scientific Reports 5, 11824.
- Gupta et al. (2006) Gupta, A., Kneafsey, T. J., Moridis, G. J., Seol, Y., Kowalsky, M. B., Sloan, E. D., 2006. Composite thermal conductivity in a large heterogeneous porous methane hydrate sample. The Journal of Physical Chemistry B 110, 16384–16392.
- Hachikubo et al. (2011) Hachikubo, A., Takeya, S., Chuvilin, E., Istomin, V., 2011. Preservation phenomena of methane hydrate in pore spaces. Physical Chemistry Chemical Physics 13, 17449–17452.
- Haynes (2014) Haynes, W. M., 2014. CRC Handbook of Chemistry and Physics. CRC Press.
- Jin et al. (2016) Jin, Y., Konno, Y., Yoneda, J., Kida, M., Nagao, J., 2016. In situ methane hydrate morphology investigation: natural gas hydrate-bearing sediment recovered from the Eastern Nankai Trough Area. Energy & Fuels 30 (7), 5547–5554.
- Kiss et al. (2015) Kiss, A. M., Jew, A. D., Joe-Wong, C., Maher, K. M., Liu, Y., Brown, G. E., Bargar, J., 2015. Synchrotron-based transmission X-ray microscopy for improved extraction in shale during hydraulic fracturing. In: SPIE Optical Engineering+ Applications. International Society for Optics and Photonics, pp. 95920O–95920O.
- Kneafsey et al. (2007) Kneafsey, T. J., Tomutsa, L., Moridis, G. J., Seol, Y., Freifeld, B. M., Taylor, C. E., Gupta, A., 2007. Methane hydrate formation and dissociation in a partially saturated core-scale sand sample. Journal of Petroleum Science and Engineering 56, 108–126.
- Koh and Sloan (2007) Koh, C. A., Sloan, E. D., 2007. Natural gas hydrates: Recent advances and challenges in energy and environmental applications. AIChE journal 53 (7), 1636–1643.
- Lei et al. (2019a) Lei, L., Liu, Z., Seol, Y., Boswell, R., Dai, S., 2019a. An investigation of hydrate formation in unsaturated sediments using X-ray computed tomography. Journal of Geophysical Research: Solid Earth 124, 3335–3349.
- Lei and Santamarina (2018) Lei, L., Santamarina, J., 2018. Laboratory strategies for hydrate formation in fine-grained sediments. Journal of Geophysical Research: Solid Earth 123 (4), 2583–2596.
- Lei et al. (2019b) Lei, L., Seol, Y., Choi, J.-H., Kneafsey, T. J., 2019b. Pore habit of methane hydrate and its evolution in sediment matrix–laboratory visualization with phase-contrast micro-CT. Marine and Petroleum Geology 104, 451–467.
- Lei et al. (2018) Lei, L., Seol, Y., Jarvis, K., 2018. Pore-scale visualization of methane hydrate-bearing sediments with micro-CT. Geophysical Research Letters 45 (11), 5417–5426.
- Li et al. (2015) Li, T., Fan, D., Lu, L., Huang, J., Zhao, F., Qi, M., Sun, T., Fezzaa, K., Xiao, X., Zhou, X., et al., 2015. Dynamic fracture of C/SiC composites under high strain-rate loading: microstructures and mechanisms. Carbon 91, 468–478.
- Manakov and Duchkov (2017) Manakov, A. Y., Duchkov, A. D., 2017. Laboratory modeling of hydrate formation in rock specimens (a review). Russian Geology and Geophysics 58 (2), 240–252.
- Mokso et al. (2017) Mokso, R., Schlepütz, C. M., Theidel, G., Billich, H., Schmid, E., Celcer, T., Mikuljan, G., Sala, L., Marone, F., Schlumpf, N., et al., 2017. GigaFRoST: the gigabit fast readout system for tomography. Journal of synchrotron radiation 24 (6), 1250–1259.
- Nikitin et al. (2019) Nikitin, V., Carlsson, M., Andersson, F., Mokso, R., 2019. Four-dimensional tomographic reconstruction by time domain decomposition. IEEE Transactions on Computational Imaging 5 (3), 409–419.
- Priest et al. (2009) Priest, J. A., Rees, E. V., Clayton, C. R., 2009. Influence of gas hydrate morphology on the seismic velocities of sands. Journal of Geophysical Research: Solid Earth 114, B11205.
- Riedel et al. (2010) Riedel, M., Willoughby, E. C., Chopra, S., 2010. Geophysical characterization of gas hydrates. Society of Exploration Geophysicists.
- Saif et al. (2016) Saif, T., Lin, Q., Singh, K., Bijeljic, B., Blunt, M. J., 2016. Dynamic imaging of oil shale pyrolysis using synchrotron X-ray microtomography. Geophysical Research Letters 43 (13), 6799–6807.
- Stern et al. (2001) Stern, L., Circone, S., Kirby, S., Durham, W., 2001. Anomalous preservation of pure methane hydrate at 1 atm. Journal of Physical Chemistry B 105 (9), 1756–1762.
- Sun et al. (2014a) Sun, S.-C., Liu, C.-L., Ye, Y.-G., Liu, Y.-F., 2014a. Phase behavior of methane hydrate in silica sand. The Journal of Chemical Thermodynamics 69, 118–124.
- Sun et al. (2014b) Sun, Y., Li, B., Guo, W., Lü, X., Zhang, Y., Li, K., Wang, P., Jin, G., Jia, R., Qu, L., 2014b. Comparative analysis of the production trial and numerical simulations of gas production from multilayer hydrate deposits in the Qilian Mountain permafrost. Journal of Natural Gas Science and Engineering 21, 456–466.
- Torres et al. (2011) Torres, M., Collett, T., Rose, K., Sample, J., Agena, W., Rosenbaum, E., 2011. Pore fluid geochemistry from the Mount Elbert gas hydrate stratigraphic test well, Alaska North slope. Marine and Petroleum Geology 28, 332–342.
- Wadeson and Basham (2016) Wadeson, N., Basham, M., 2016. Savu: a Python-based, MPI framework for simultaneous processing of multiple, N-dimensional, large tomography datasets. arXiv preprint arXiv:1610.08015.
- Waite et al. (2009) Waite, W. F., Santamarina, J. C., Cortes, D. D., Dugan, B., Espinoza, D., Germaine, J., Jang, J., Jung, J., Kneafsey, T. J., Shin, H., et al., 2009. Physical properties of hydrate-bearing sediments. Reviews of geophysics 47 (4).
- Wang et al. (2016) Wang, M., Lu, L., Li, C., Xiao, X., Zhou, X., Zhu, J., Luo, S., 2016. Deformation and spallation of a magnesium alloy under high strain rate loading. Materials Science and Engineering: A 661, 126–131.
- White and McGrail (2009) White, M., McGrail, P., 2009. Designing a pilot-scale experiment for the production of natural gas hydrates and sequestration of CO2 in class 1 hydrate accumulations. Energy Procedia 1 (1), 3099–3106.
- Winters et al. (2007) Winters, W., Waite, W., Mason, D., Gilbert, L., Pecher, I., 2007. Methane gas hydrate effect on sediment acoustic and strength properties. Journal of Petroleum Science and Engineering 56, 127–135.
- Yang et al. (2016) Yang, L., Falenty, A., Chaouachi, M., Haberthür, D., Kuhs, W. F., 2016. Synchrotron X-ray computed microtomography study on gas hydrate decomposition in a sedimentary matrix. Geochemistry, Geophysics, Geosystems 17 (9), 3717–3732.
- Yang et al. (2015) Yang, L., Zhao, J., Liu, W., Li, Y., Yang, M., Song, Y., 2015. Microstructure observations of natural gas hydrate occurrence in porous media using microfocus X‑ray computed tomography. Energy & Fuels 29, 4835–4841.
- Yoneda et al. (2017) Yoneda, J., Masui, A., Konno, Y., Jin, Y., Kida, M., Katagiri, J., Nagao, J., Tenma, N., 2017. Pressure-core-based reservoir characterization for geomechanics: Insights from gas hydrate drilling during 2012–2013 at the eastern Nankai Trough. Marine and Petroleum Geology 86, 1–16.
- Youssef et al. (2013) Youssef, S., Deschamps, H., Dautriat, J., Rosenberg, E., Oughanem, R., Maire, E., Mokso R., 2013. 4D imaging of fluid flow dynamics in natural porous media by ultrafast X-ray microtomography. SCA Proceedings 12, 1–12.
- Zhao et al. (2015) Zhao, J., Yang, L., Liu, Y., Song, Y., 2015. Microstructural characteristics of natural gas hydrates hosted in various sand sediments. Physical Chemistry Chemical Physics 17 (35), 22632–22641.