Tracking the time-evolution of the electron distribution function in Copper by femtosecond broadband optical spectroscopy
Abstract
Multi-temperature models are nowadays often used to quantify the ultrafast electron-phonon (boson) relaxations and coupling strengths in advanced quantum solids. To test their applicability we study the time evolution of the electron distribution function, f(E), in Cu over large range of excitation densities using broadband time-resolved optical spectroscopy. Following intraband optical excitation, f(E) is found to be athermal over several 100 fs, while substantial part of the absorbed energy already being transferred to the lattice. We show, however, that the electron-phonon coupling constant can still be obtained using the two-temperature model analysis, provided that the data are analyzed over the time-window, when the electrons are already quasi thermal, and the electronic temperature is determined experimentally.
Cooperative phenomena in quantum solids arise from a delicate balance among interactions between charge, spin and lattice degrees of freedom. The knowledge of the interaction strengths between the different subsystems is thus crucial for their understanding. The knowledge of the Eliashberg electron-boson coupling constant is of particular interest in novel superconductors, as it provides information on the significance of the electron-boson interaction (or the lack thereof) for superconducting pairing. One of the promising approaches to determine is to use femtosecond (fs) time-resolved techniques AllenEx . Here, fs optical pulses are used to excite the electronic system, while the recovery dynamics is probed by measuring the resulting transient changes in optical constants BrorsonEx or the electronic occupation near the Fermi energy Perfetti ; Cnano . Considering simple metals and assuming the electron-electron () thermalization being much faster than the electron-phonon () relaxation, the so called two-temperature model (TTM) has been put forward Kaganov ; AllenEx . Within this description, the electrons rapidly thermalize to a temperature , which can be much higher than that of the lattice, . This process is followed by the thermalization on a timescale , which is inversely proportional to the coupling strength. This widely used model suggests a particularly simple relationship between the measured relaxation time and , when experiments are performed at ; being the Debye temperature. With the electronic specific heat , where is the Sommerfeld constant, the time evolutions of and are given by a set of coupled heat equations AllenEx ; BookChapter . Here , with AllenEx
| (1) |
where while is the product of the coupling strength , and the phonon density of states . Often the Debye approximation is used, where the coupling strength is mode independent. In this case is the mean square phonon frequency.
Following pioneering works on noble metals Eesley83 ; Fujimoto ; Schoenlein ; Elsayed ; ElsayedAliIntDep ; Sun numerous time-resolved experiments on superconductors have been performed, ranging from conventional BrorsonEx , to high-Tc cuprate Perfetti ; Brorson2E ; ChekalinE ; Gadermaier ; DalConte ; Chia2013 and pnictide MansartPnic ; Stojchevska superconductors, aiming at the determination of . Similar studies were performed also on other advanced materials ranging from carbon nanotubes Cnano ; Cnanotubes , ferromagnets CarpeneFe , to metallic nanoparticles Voisin . Moreover, several extensions to multi-temperature models have also been proposed to account for experimental observations DalConte ; Chia2013 . Despite the reasonable agreement between the experimentally extracted and theoretically estimated values of BrorsonEx numerous studies shed doubts on the applicability of the TTM. The time-resolved photoemission data on Au showed that even at room temperature and high excitation densities, the thermalization time is as long as 800 fs while the electronic distribution at earlier times is strongly athermal Fann . The second major shortcoming of the TTM is the prediction that in the limit of weak excitations as K, which was never observed in simple metals Groenevald ; Ahn . Both, the absence of slowing down of relaxation at low- and long thermalization times were attributed to Pauli blocking, where scattering into states below the Fermi level () is reduced due to the small fraction of unoccupied states to which electrons can be scattered to Groenevald ; Ahn . Moreover, several recent studies of dynamics in advanced solids suggest that the and thermalization timescales are actually comparable Kusar ; Pashkin ; Beyer .
In this Letter we present an all-optical approach to study the time-evolution of the photoinduced changes in the electronic distribution function near the Fermi energy, , in thin copper films. We achieve that by studying the temporal evolution of the complex dielectric function, , following intraband photoexcitation. In Cu is in the visible spectral range largely governed by the interband transition from the d-band to the Fermi level. With the combination of static , thermomodulation, , and the simple model of the electronic density of states, which accounts for , we show that can be extracted from . We show that in Cu the is quasi-thermal only for time delays larger ps. Moreover, the experimentally determined ’s are - for short time delays - substantially lower than the expected values based on the absorbed energy density. This implies a substantial energy transfer to the lattice already in the early stage of relaxation. Despite the obvious disparity of the presented results and the TTM, we demonstrate that the TTM can account for the data, yet just for the time delays when the electron subsystem is already quasi-thermal, and provided that ’s are determined experimentally, as in our case. The presented approach could be generalized to other systems with interband optical transitions in the visible range.
The broadband fs time-resolved optical studies were performed on thin (24 nm) Cu films sputtered on (100) MgO substrate. The reflectivities and transmissions of films were measured with commercial FTIR and UV-Vis spectrometers. The measured optical constants were found to be in good agreement with literature values Cudielectric . The samples were photoexcited by 50 fs near-infrared (NIR) pulses ( nm, 1.55 eV). The absorbed energy densities, , calculated from the measured eV SI were varied between 4-250 J/cm3. The photoinduced changes of both transmission and reflectivity between 1.25 - 2.8 eV were measured with white light supercontinuum pulses generated in sapphire Alfano . Combining the static and the measured transient changes in reflectivity and transmission, is determined by numerically solving a system of appropriate Fresnel equations SI ; Dupertuis1 ; Dupertuis2 .
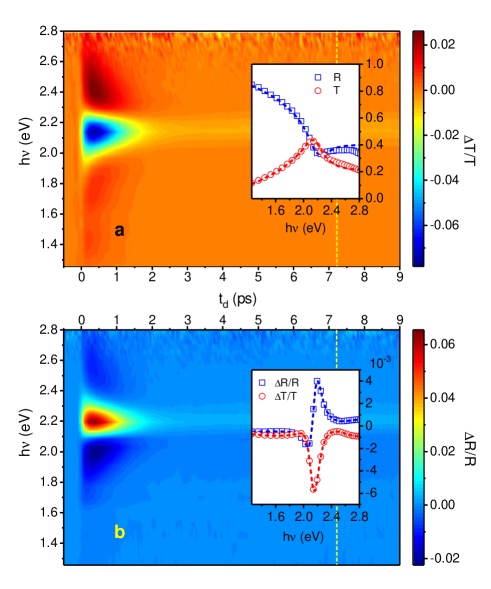
Figure 1 shows the time evolution of the induced transmission, Tr/Tr, and reflectivity, Re/Re, of a 24 nm thick Cu film on MgO substrate, recorded at room temperature, in the spectral range between 1.25 and 2.8 eV. The equilibrium reflectivity and transmission of the Cu thin film are presented in insert to panel (a). The anomaly centered at eV is a result of the interband transition () between the d-band, located at eV below the Fermi level, and the Cu s-p band. The time-resolved data show strong changes in optical properties near , arising from photoinduced changes in Rosei . Since the NIR pump-pulse excites the s-p band electrons, it is the photoinduced Fermi-level smearing, i.e. broadening of the electronic distribution near , that is mainly responsible for changes in (see Figure 2a). Assuming the validity of the TTM, should reach K at U = 54 J/cm3. Following the and thermalization processes, a quasi-equilibrium is reached within a few picoseconds (the photoinduced spectra show no measurable changes between 5 and 30 ps), with the subsequent decay governed by the heat diffusion into the substrate. Therefore, we can assume that ps , where is the resulting temperature increase, given by , where is the total specific heat. Indeed, the recorded T/T( ps) and R/R( ps), shown in inset to Fig. 1(b), match well the changes obtained by simply heating up the sample using a hot-plate (conventional thermomodulation). For U = 54 J/cm3 we obtain K (to be compared with the estimated maximal K for early times).
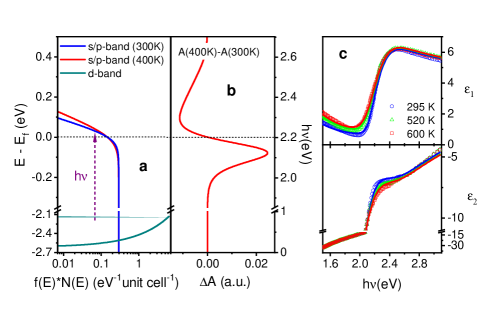
As noted, the dominant contribution to changes in the optical constants in the visible range stems from the photoinduced Fermi level smearing. The Fermi level smearing results in opening/blocking the optical transitions from the fully occupied -band at eV below EF, to s-p band states below/above the EF Rosei , as sketched in Figure 2(a). Thus, a proper parametrization of provides means to a direct access to changes in the electronic distribution function - also for time-delays where the distribution may be athermal.
To model the equilibrium and the thermomodulation optical spectra in the visible range SI , we consider . Here is the free carrier Drude response of the s/p electrons, describes the interband transition between the uppermost d-band and the s-p band, while sums up the contributions of higher energy interband transitions to . All contributions are temperature dependent. The T-dependence of is governed by the T-dependence of the Drude scattering rate, SI . For temperatures above 300 K, is governed by the scattering and thus depends linearly on . The changes due to the Fermi level smearing are, for the thermomodulation, sketched in Figure 2b. They give rise to a bipolar change in the interband absorption near , with the amplitude proportional to . In addition, a small shift of can be expected, either due to the shift of the chemical potential (proportional to ) or due to the thermal lattice expansion (proportional to ). In Cu, the electronic DOS at EF is nearly constant and the former can be neglected, thus the shift in is governed by . Finally, the induced changes in higher energy interband transitions ( 4 eV) may also contribute to in the visible range. These changes, driven by the thermal expansion () give rise to a weak frequency-independent offset in the real part of SI . The findings are tested on published optical data at different temperatures and presented in Figure 2c.
Since only is dominated by , and is much smaller than , we can parametrize the changes of that are a result of , thereby getting access to . We start by modeling the equilibrium , to account for Tr and Re at room temperature, as well as for the bolometric responses. The latter is given by Tr/Tr ps and Re/Re ps and was recorded at 12 different excitation levels with J/cm3. To model , which dominates in the visible range, we developed a simple model (see SI ) considering the Fermi golden rule, and using the band dispersions that give rise to densities of states of the d-band and the s-p band, as shown in Fig. 2a. For the Drude scattering rate, , and we assume they depend linearly on lattice temperature (e.g., for we assume that ). Such a linear expansion is justified since the maximal changes in the lattice temperature (for highest excitation densities used here) are of the order of K. We determined these parameters by globally fitting the equilibrium and ps for spanning nearly two orders of magnitude. The resulting is shown to describe well Tr and Re (inset to Fig. 1a) as well as the bolometric (thermomodulation) response (inset to Fig. 1b).
To determine from experimental data, we assume that , where is the decay time of the spectrally averaged transient. Both experimental studies Ralph and detailed numerical calculations Oppeneer demonstrated that the phonon subsystem is also athermal on the picosecond timescale. However, the relatively small contribution of the components linked to changes in to the overall changes in make the result relatively insensitive to the variation of . With this, and the extracted coefficients describing , , , we obtain by fitting the model to the experimental data.
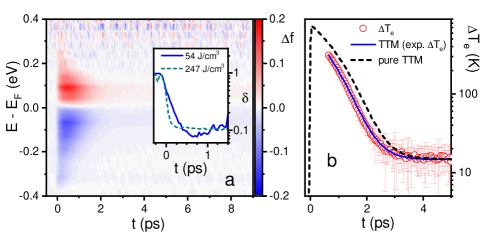
Figure 3 (a) presents the time evolution of extracted from the data shown in Fig. 1. To evaluate we first compare the experimental around EF with the best fit assuming thermalized electrons, where K, and Te is obtained by the best fit to the experimental . The normalized error , where the sum spans the data for -0.4 eV 0.4 eV, is shown in inset to panel (a) for two excitation densities. It follows that for U 50 J/cm3 the reaches the quasi-thermal state only on the timescale of 00 fs, while for U 250 J/cm3 the electron thermalization time is reduced to 00 fs. Figure 3 (b) presents the time-evolution of the extracted electronic temperature ( J/cm3) from the point, where is quasi-thermal. Analyzing experimental ps using the TTM (solid blue line) we obtain meV2, which is in excellent agreement with theoretical estimates Beaulac . Importantly, the measured ’s are throughout the thermalization process substantially lower than expected from the pure TTM, using the same value of and (dashed line in Figure 3b). This implies a substantial energy transfer to the phonon subsystem already during the e-e thermalization process.
Not being able to properly determine , as in most all-optical studies, can be a major source of error in estimating . Thus, the values of obtained by time-resolved optical methods vary substantially. In Figure 4 we plot the extracted obtained at different excitation densities (black spheres). As expected for moderate excitation densities Lin ; Rethfeld1 , is found to be independent of , provided that we use the experimentally extracted for the TTM analysis. Applying the common approach of extracting using , either by i) an exponential decay fit and Eq.(1) or ii) by the full TTM fit, the extracted is shown to strongly vary with (Figure 4a). Indeed, the previously published data on in Cu BrorsonEx ; ElsayedAliIntDep seem to follow this trend.
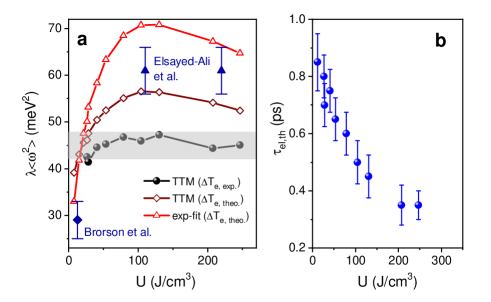
Figure 4b presents the excitation dependence of the extracted electron thermalization time, . It shows that the main reason for the departure of the observed relaxation dynamics from the standard TTM lies in the slow thermalization at low excitation densities. The observation is consistent with the relaxation of Pauli-blocking for high excitation densities, and in-line with calculations using Boltzmann collision integrals Rethfeld1 .
Our study demonstrates that, for simple metals with relatively weak e-ph coupling, can indeed be extracted using the TTM, provided that the analysis is restricted to times after the electronic distribution reached a quasi thermal one, and that the electronic distribution function and is determined experimentally. However, such studies should be performed as a function of excitation density to test if the data are consistent with the TTM model predictions to begin with (e.g. fluence dependent relaxation rate).
In numerous advanced solids, the (initial) carrier relaxation dynamics are found to proceed on a sub-picosecond timescale, with the excitation dependent studies showing fluence independent dynamics Gadermaier . It has been argued that, in the weak excitation limit, in many systems the thermalization times may actually be longer than the relaxation times over most of the accessible temperature range KabAlex ; Baranov . For such a case, where the electronic distribution is athermal through most of the time window of interest, an alternative analytic expression, linking the experimentally measured relaxation time to the coupling constant has been derived: KabAlex ; Baranov . Note, that the expression is very similar to the one for the TTM, with the main difference being a factor of 2 and the instead of the . In the low excitation density limit in Cu, the relaxation time becomes independent on fluence SI , and the extracted (Fig. 4b) becomes comparable to the . Indeed, in the low excitation density limit, we obtain meV2 using the above expression of for the fully non-thermal case. The value is close to the value extracted at high excitation densities using the TTM. However, upon increasing the excitation density, the value of obtained from the non-thermal model starts to decrease, signifying the change from the non-thermal to the thermal regime.
As demonstrated above, the values of extracted from the time-resolved data may vary by as much as a factor of 2, depending on the excitation density and the approximation used. While this factor may appear to be small, we should note that this difference may correspond to the difference between the strong and weak coupling limits for superconductivity TheoryTc . The demonstrated all-optical approach, where the time evolution of the electronic distribution function in a thin (bulk) film can be recorded, may provide a way to unambiguously extracting ’s also for advanced superconductors.
Acknowledgements.
This work was supported by the Carl-Zeiss Stiftung and the DFG in the framework of the Collaborative Research Centre SFB TRR 173 “Spin +X”. We gratefully acknowledge valuable discussions with V.V. Kabanov and B. Rethfeld.References
- (1) P.B. Allen, Phys.Rev.Lett. 59, 1460 (1987).
- (2) S.D. Brorson, et al., Phys.Rev.Lett. 64, 2172 (1990).
- (3) L. Perfetti, et al., Phys. Rev. Lett. 99, 197001 (2007).
- (4) T. Hertel, R. Fasel, and G. Moos, Appl. Phys. A 75, 449 (2002).
- (5) M.I. Kaganov, I.M. Lifshitz, L.V. Tantarov, Zh. Exsp. Theor. Fiz. 31, 232 (1956) [Sov.Phys. JETP 4, 173 (1957)].
- (6) J. Demsar und T. Dekorsy, in Optical Techniques for Solid-State Materials Characterization, Edited by R.P. Prasankumar and A.J. Taylor (Francis & Taylor, New York, 2011).
- (7) G. L. Eesley, Phys. Rev. Lett. 51, 2140 (1983).
- (8) J.G. Fujimoto, J.M. Liu, E.P. Ippen, N. Bloembergen, Phys. Rev. Lett. 53, 1837 (1984).
- (9) R.W. Schoenlein, W.Z. Lin, J.G. Fujimoto, G.L. Eesley, Phys. Rev. Lett. 58, 1680 (1987).
- (10) H.E. Elsayed-Ali, T.B. Norris, M.A. Pessot, and G.A. Mourou, Phys. Rev. Lett. 58, 1212 (1987).
- (11) H.E. Elsayed-Ali, and T. Juhasz, Phys. Rev. B 47, 13599 (1993).
- (12) C.K. Sun, F. Vallee, L.H. Acioli, E.P. Ippen, J.G. Fujimoto, Phys. Rev. B 50, 15337 (1994).
- (13) S.D. Brorson, et al., Sol. Stat. Comm. 74, 1305 (1990).
- (14) S.V. Chekalin, et al., Phys. Rev. Lett. 67, 3860 (1991).
- (15) C. Gadermaier, et al., Phys. Rev. Lett. 105, 257001 (2010).
- (16) S. Dal Conte, et al., Science 335, 1600–1603 (2012).
- (17) E.E.M. Chia, et al., New J. of Phys. 15, 103027 (2013).
- (18) B. Mansart, et al., Phys. Rev. B 82, 024513 (2010).
- (19) L. Stojchevska, et al., Phys. Rev. B 82, 012505 (2010).
- (20) F. Wu, et al., Appl. Phys. Lett. 97, 262115 (2010).
- (21) E. Carpene, et al., Phys. Rev. B 78, 174422 (2008).
- (22) C. Voisin, et al., Phys. Rev. B 69, 195416 (2004).
- (23) W.S. Fann, R. Storz, H.W.K. Tom, and J. Bokor, Phys. Rev. Lett. 68, 2834 (1992); ibid. Phys. Rev. B 46, 13592 (1992).
- (24) R.H.M. Groeneveld, R. Sprik, and A. Lagendijk, Phys. Rev. B 51, 11433 (1995).
- (25) K.H. Ahn, et al., Phys. Rev. B 69, 045114 (2004).
- (26) P. Kusar, et al., Phys. Rev. Lett. 101, 227001 (2008).
- (27) A. Pashkin, et al., Phys. Rev. Lett. 105, 067001 (2010).
- (28) M. Beyer, et al., Phys. Rev. B 83, 214515 (2011).
- (29) P. B. Johnson, R. W. Christy, Phys. Rev. B 6, 4370 (1972).
- (30) see Supplementary Information at http:
- (31) R. R. Alfano, The Supercontinuum Laser Source: Fundamentals With Updated References (Springer, 2006), 2nd ed.
- (32) M.A. Dupertuis, B. Acklin, and M. Proctor, J. Opt. Soc. Am. A 3, 1159 (1994).
- (33) M.A. Dupertuis, B. Acklin, and M. Proctor, J. Opt. Soc. Am. A 3, 1167 (1994).
- (34) R. Rosei and D. W. Lynch, Phys. Rev.B 5, 3883 (1972).
- (35) L.J. Hanekamp, W. Lisowski, and G.A. Bootsma, Surface Science118, 1-18 (1982).
- (36) L. Waldecker, R. Bertoni, R. Ernstorfer, and J. Vorberger, Phys. Rev. X 6, 021003 (2016).
- (37) P. Maldonado, K. Carva, M. Flammer, and P.M. Oppeneer, Phys. Rev. B 96, 174439 (2017).
- (38) T. P. Beaulac, P. B. Allen, and F. J. Pinski, Phys. Rev. B 26, 1549 (1982).
- (39) Z. Lin, L.V. Zhigilei, and V. Celli, Phys. Rev. B 77, 075133 (2008).
- (40) B.Y. Mueller and B. Rethfeld, Phys. Rev. B 87, 035139 (2013).
- (41) V.E. Gusev and O.B. Wright, Phys. Rev. B 57, 2878 (1998).
- (42) V.V. Kabanov, and A.S. Alexandrov, Phys. Rev. B 78, 174514 (2008).
- (43) V.V. Baranov and V.V. Kabanov, Phys. Rev. B 89, 125102 (2014).
- (44) P.B.Allen and B. Mitrovic, Solid State Physics 37, 1-92 (1983).