Present address: ]Subatech, IMT-Atlantique, Université de Nantes, CNRS-IN2P3, F-44307, Nantes, France
Total absorption -ray spectroscopy of the -delayed neutron emitters 137I and 95Rb
Abstract
The decays of the -delayed neutron emitters 137I and 95Rb have been studied with the total absorption -ray spectroscopy technique. The purity of the beams provided by the JYFLTRAP Penning trap at the ion guide isotope separator on-line facility in Jyväskylä allowed us to carry out a campaign of isotopically pure measurements with the decay total absorption -ray spectrometer, a segmented detector composed of eighteen NaI(Tl) modules. The contamination coming from the interaction of neutrons with the spectrometer has been carefully studied, and we have tested the use of time differences between prompt -rays and delayed neutron interactions to eliminate this source of contamination. Due to the sensitivity of our spectrometer, we have found a significant amount of -intensity to states above the neutron separation energy that de-excite by -rays, comparable to the neutron emission probability. The competition between de-excitation and neutron emission has been compared with Hauser-Feshbach calculations, and it can be understood as a nuclear structure effect. In addition, we have studied the impact of the -intensity distributions determined in this work on reactor decay heat and reactor antineutrino spectrum summation calculations. The robustness of our results is demonstrated by a thorough study of uncertainties, and with the reproduction of the spectra of the individual modules and the module-multiplicity gated spectra. This work represents the state-of-the-art of our analysis methodology for segmented total absorption spectrometers.
I Introduction
Neutron-rich nuclei far from stability may exhibit -decay energy windows larger than the neutron separation energy in the daughter nucleus. In those cases with , neutron emission competes strongly with -ray emission in the de-excitation of excited levels populated above in the -decay. This decay mode, known as -delayed neutron emission, was discovered in 1939 by Roberts et al. Roberts et al. (1939) and becomes dominant when the neutron excess is sufficiently large.
The -delayed neutron emission process plays an important role in stellar nucleosynthesis. Heavy nuclei beyond iron can be produced by means of the rapid-neutron-capture process, the so-called r-process Margaret Burbidge et al. (1957). The main characteristic of the r-process is the availability of a large number of neutrons that are added in a short time interval to elements of the iron group in successive neutron capture processes followed by -decays. Very neutron-rich -delayed neutron emitters up to very heavy nuclei are formed in this way. Core collapse supernovae of massive stars or neutron star mergers have been considered as possible astrophysical sites for the r-process. Recently, the combined detection of gravitational waves and electromagnetic radiation from the GW170817 neutron star merger, gave support to the idea that such mergers are important sources of r-process elements Kasen et al. (2017).
The detailed study of the r-process requires nuclear data such as nuclear masses, half-lives (), -delayed neutron emission probabilities () and neutron capture (n,) reaction cross sections Mumpower et al. (2016) for nuclei far away from stability. In spite of considerable experimental effort, a large amount of data is still lacking, and are thus obtained theoretically from nuclear models.
In the case of (n,) cross sections, when no experimental information is available, statistical calculations using the Hauser-Feschbach formalism (HFF) Hauser and Feshbach (1952) are used. These calculations rely on parameters obtained close to the valley of stability for Nuclear Level Densities (NLD), Photon Strength Functions (PSF) and Neutron Transmission Coefficients (NTC) Rauscher and Thielemann (2000). In recent years the connection between the -delayed neutron emission process and (n,) reactions as a possible source of experimental information has been highlighted Tain et al. (2015a); Valencia et al. (2017); Tain et al. (2017a, b). In both processes resonances that decay either by or neutron emission are populated, though they usually have different spin-parity values. The experimental difficulty when taking advantage of this connection is related to the accurate measurement of the -intensity followed by emission above . Traditional high-resolution experiments with HPGe detectors have been shown to be limited in detecting -intensity at high excitation energies. This is due to the so-called Pandemonium systematic error Hardy et al. (1977), associated with the limited efficiency of such detectors. The Total Absorption -ray Spectroscopy (TAGS) technique allows one to overcome this effect and it has proven to be capable of extracting the intensity followed by -rays above in previous works Alkhazov et al. (1989); Tain et al. (2015a); Spyrou et al. (2016); Valencia et al. (2017). This technique uses large scintillator crystals covering almost the full solid angle in order to maximize the -detection efficiency. The sum of the -rays de-exciting each level fed in the daughter nucleus is detected, instead of the individual -rays. The TAGS technique allows one to obtain the -intensity distribution followed by -ray emission, , by means of a deconvolution process.
On the other hand, in the case of and values, predictions from QRPA -strength calculations Moeller et al. (2003); Borzov et al. (2003) have been compared in recent years with experimental results to test the accuracy of the nuclear models. A more stringent cross-check implies a comparison of calculated and measured -strength distributions, since they are particularly sensitive to the details of the nuclear model. A key ingredient to determine the -strength distributions are the intensity probabilities, which can be obtained free from the Pandemonium effect with TAGS, as mentioned above.
The -decay of fission fragments plays a crucial role in nuclear reactors, where on average six -decays follow each fission reaction. A precise knowledge of the energy released by their radioactive decay, the so-called Decay Heat (DH), turns out to be important in order to maintain the safe operation of a reactor after shutdown. Furthermore it can help to understand the occurrence of accidents, as shown in the case of the Fukushima-Daiichi plant Okumura et al. , a consequence of the non-effective dissipation of the DH in the reactor core and in the adjacent cooling pool for spent-fuel. In addition, predictions of the DH associated with innovative fuels and reactors are needed.
Apart from its importance for the safe operation of reactors, accurate information on the -decay of the resulting fission fragments can be used to improve our understanding of the reactor antineutrino spectrum, important for reactor-based antineutrino experiments on fundamental neutrino physics Abe et al. (2012); An et al. (2012); Ahn et al. (2012) and for reactor monitoring Kim (2017). The standard approach used in antineutrino spectrum calculations is based on the conversion of integral spectra measurements for the main fissile isotopes Hahn et al. (1988); Haag et al. (2014). However, the recent observation of discrepancies between experimental data and calculations of the absolute flux Mention et al. (2011) and shape Choi et al. (2016); An et al. (2016); Abe et al. (2016) of the reactor antineutrino spectrum, has encouraged further improvements in the alternative summation approach, which relies on the information from nuclear databases. In this approach, the total antineutrino spectrum is calculated as the sum of the antineutrino spectra associated with the decay of each fission product weighted by the corresponding activity. The antineutrino spectrum for each decay is constructed by using the -intensity probabilities. An improvement in the summation method from the point of view of decay data consists of the provision of data free from the Pandemonium systematic error Fallot et al. (2012). The same applies for the calculation of the reactor DH, where a summation over the inventory of fission products provides an alternative to integral measurements. The DH as a function of time is computed by summing the energy released by the decay of each nucleus (average and energies for -decaying nuclei) weighted by the activity at this time. For the calculation of the average energies, the -intensity distributions are needed, so that the use of intensities suffering from Pandemonium limits the accuracy of such calculations Algora et al. (2010).
Here we study the decays of two important -delayed neutron emitters by means of the TAGS technique: the decay of 137I (=6.027 MeV) into 137Xe (=4.025 MeV), and the decay of 95Rb (=9.228 MeV) into 95Sr (=4.348 MeV). The decay properties of their respective -n branches (neutron emission probability, neutron branching to states in the final nucleus and neutron spectra) are well known, hence one can make a detailed study of the neutron/ competition. 137I is identified as an important contributor to the reactor DH and to the reactor antineutrino spectrum. In fact, a high priority has been assigned to measurements of this decay with the TAGS technique by the International Atomic Energy Agency (IAEA) IAE (2015). Although 95Rb has a smaller contribution to the total decay energy released in a reactor, its large value makes it a good candidate for investigating the Pandemonium systematic error.
The paper is organized as follows. In Section II we describe the experimental measurements of these decays and in Section III a detailed discussion of the TAGS analyses will be presented. The competition between neutron emission and -ray emission will be addressed in Section IV. In Section V we compare the energy spectra obtained from the results of this work with previous measurements, as well as the new average and energies with previous values. Finally, in Section VI the impact of these results in reactor DH and reactor antineutrino spectrum summation calculations will be discussed.
II Experiment
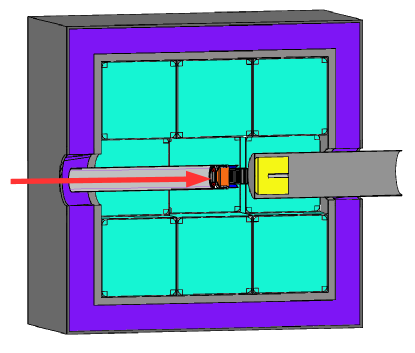
A campaign of measurements, including 137I and 95Rb decays, was carried out in 2014 at the upgraded Ion Guide Isotope Separator On-Line (IGISOL) facility at the University of Jyväskylä Moore et al. (2013). We employed the new Decay Total Absorption -ray Spectrometer (DTAS), composed of 18 NaI(Tl) crystals Tain et al. (2015b). In the set-up a plastic detector of 3 mm thickness was located close to the center of DTAS, and a HPGe detector was placed behind the detector. A schematic picture of the set-up can be seen in Fig. 1. The fission ion guide was used to extract the nuclei produced by 25 MeV proton-induced fission on natural uranium. The IGISOL separator magnet was employed to separate the radioactive nuclei based on their mass to charge ratio before using the double Penning trap system JYFLTRAP Eronen et al. (2012) for isobaric separation. The ions extracted from the trap were implanted on a tape placed in front of the plastic detector. A tape transport system was employed to remove the activity from DTAS during the measurements. The collection cycles of the tape transport system were selected to allow the reduction of the descendant activity in the measurements. For the decay of 137I (=24.5 s) the collection cycle was 4, while for 95Rb (=377.7 ms) it was 7.
II.1 Experimental spectra
A coincidence between DTAS and the detector was required to get a spectrum free from environmental background. The total sum energy of DTAS was reconstructed off-line from the signals in the individual modules as described in Guadilla et al. (2018), with threshold values of 90 keV for DTAS modules and 70 keV for the detector. Standard calibration sources were used to obtain the energy and resolution calibration of DTAS (22,24Na, 60Co, 137Cs and 152Eu-133Ba) Guadilla et al. (2018). There are three main sources of contamination in our TAGS spectra that need to be corrected: 1) the summing-pileup distortion, 2) the activity of the descendants and 3) the contribution of the -delayed neutrons interacting with the detector. The first two are discussed here, while the third one is discussed in subsection II.2.
The summing-pileup distortion was calculated as in previous works Zakari-Issoufou et al. (2015); Valencia et al. (2017); Rice et al. (2017); Guadilla et al. (2017), with a Monte Carlo (MC) procedure based on the random superposition of two stored events within the ADC gate length Cano-Ott et al. (1999a); Guadilla et al. (2018).
The decay of 137Xe (=3.818 m) was measured and its contribution to the measurement of 137I was calculated using the transition at 455.5 keV from the decay of 137Xe as normalization. In the case of 95Rb, both the daughter (95Sr, with =23.90 s) and the granddaughter (95Y, with =10.3 m) contaminate the measurement. Both decays were measured, and their contribution was estimated with the help of the Bateman equations. Contaminant fractions of 3.13 and 0.38 were calculated for daughter and granddaughter respectively. The contamination of 95Y in the measurement of 95Sr (3.96) was also taken into account in the same way.
II.2 -delayed neutron background
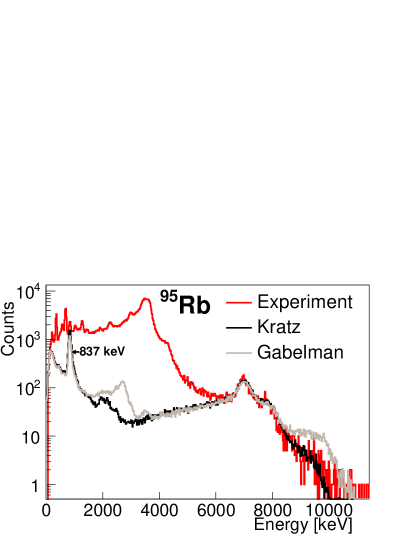
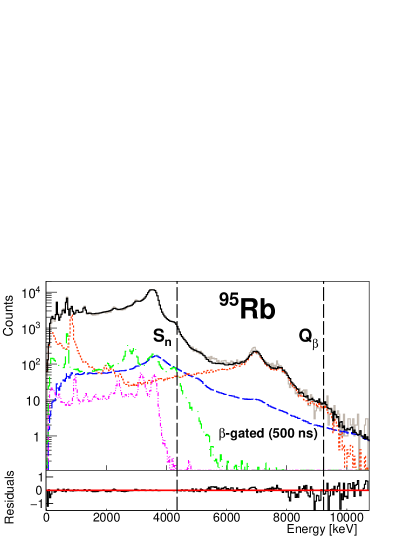
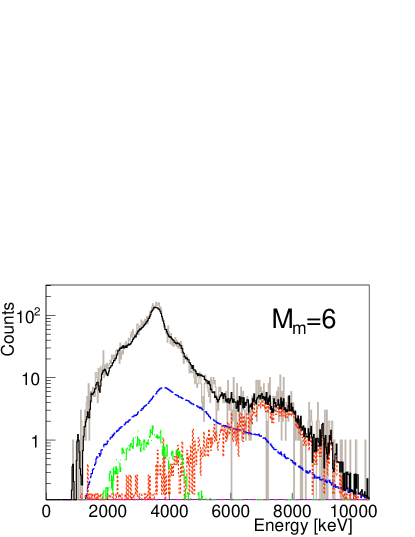
-delayed neutrons interact with the NaI(Tl) material of the detector producing -rays, either in an inelastic reaction or after neutron capture, that are easily detected in DTAS. The most clear evidence of these interactions is a structure in the spectra above 6.8 MeV, mainly due to neutron capture in the 127I of the crystals, that can be seen in Fig. 2. On the other hand, -rays from inelastic scattering, less evident, concentrate at low energy. This contamination was treated in two different ways. In the first method it is calculated using dedicated MC simulations. In the second method we exploit the fact that -rays from neutron interactions are delayed, due to the low velocity of the neutrons, with respect to prompt -rays emitted after the decay.
The simulation of the contamination due to the -n branch was done using the Geant4 simulation code Agostinelli et al. (2003) and the DECAYGEN event generator, as described in Guadilla et al. (2018). The generator uses the -intensity distribution followed by neutron emission, , that was reconstructed from the measured neutron spectra using the information on neutron branching ratios to the excited levels in the final nucleus, . The neutron spectra are obtained from ENDF/B-VII.0, based on an evaluation of experimental data Brady (1989). In the case of 95Rb the experimental information is completed at high energies with QRPA and Hauser-Feshbach theoretical calculations Kawano et al. (2008). For 137I the neutron spectrum directly provides since neutron emission proceeds to the ground state (g.s.) only. For 95Rb there are several measurements of the neutron branching to the different levels in 94Sr Kratz et al. (1982); Hoff (1981); Gabelmann (1987). The values quoted in ENSDF come from H. Gabelmann Gabelmann (1987). However, we observe that our experimental spectrum is compatible with the simulation performed using the intensities coming from the experiment of K.-L. Kratz et al. Kratz et al. (1982) but not with the one using from ENSDF, as shown in Fig. 2.
As discussed in Guadilla et al. (2018), a 500 ns time window for accumulation of the energy deposited in DTAS was used for both the experimental spectra and in the MC simulations. This time is enough to allow the full energy deposition of delayed neutron-induced -rays. The simulated -n branch has been normalized to match the low-energy tail of the experimental neutron capture peak (see Fig. 2). In 95Rb this normalization matches at the same time the peak corresponding to the 837 keV -ray, emitted from the first excited state in 94Sr, which is populated in the -n decay (see Fig. 2).
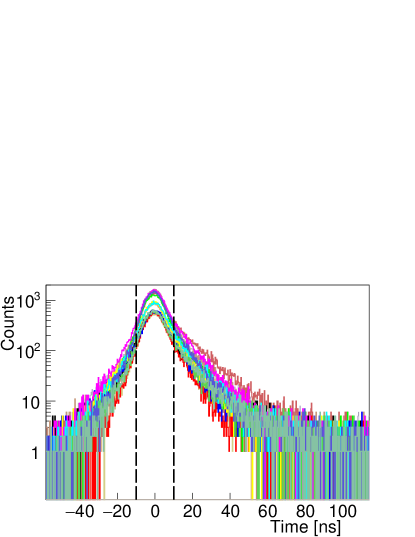
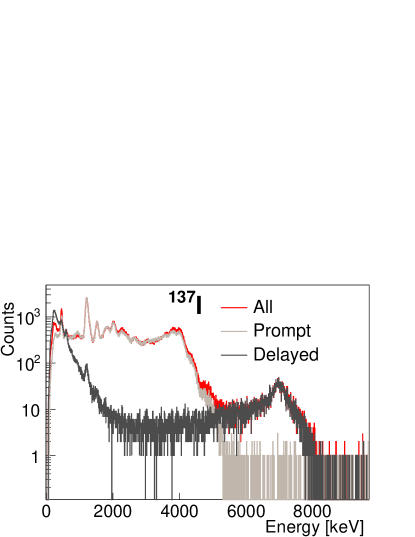
As discussed in Tain et al. (2015b), one can use the timing information between -rays detected in DTAS and -particles detected in the plastic scintillation detector in order to distinguish whether -rays are coming from neutron interactions or from the decay. Time correlation spectra were reconstructed for the individual modules as shown in Fig. 3. For convenience the peak positions of all spectra are aligned to zero applying an offset. We found that a time gate of 20 ns length (i.e. ns with respect to zero) is adequate to separate prompt contributions and delayed ones (those with ns). As shown in Fig. 4 the neutron capture peak disappears when we use the prompt gate. Unfortunately this gate impairs the reconstruction of the low energy part of the spectra (compare the light grey and the black spectra in Fig. 4). This is related to the relatively poor individual timing resolution of around 20 ns, not properly optimized in the present measurements and much worse than the 5 ns reported in Tain et al. (2015b) for the DTAS prototype module. As a consequence, the effective energy threshold is increased, affecting the sum energy reconstruction. In fact, in the measurement of 95Rb the intense -ray of 204 keV energy is cut with this procedure (as can be seen in Fig. 12), and we estimate that the effective threshold is about 280 keV instead of 90 keV. As we will show later, this has an impact on the determination of the intensity distribution. In the future, a proper optimization of the individual timing resolution and the use of narrower gates, could make this a better method than the MC simulation method for the study of isotopes with very large neutron emission probabilities or unknown -n decay properties.
III TAGS analyses
In the analysis we follow the method developed by the Valencia group to determine the -intensity distributions in TAGS experiments Cano-Ott et al. (1999b); Tain and Cano-Ott (2007a, b). For that, we have to solve the following inverse problem Tain and Cano-Ott (2007a):
| (1) |
where represents the number of counts in channel of the experimental spectrum, is the number of events that feed level in the daughter nucleus, is the contribution of all contaminants to channel , and is the response function of the spectrometer, that depends on the branching ratios () between the states in the daughter nucleus. The branching ratio matrix is calculated using the known decay information for the levels at low excitation energy complemented with an estimate based on the nuclear statistical model at high excitation energy.
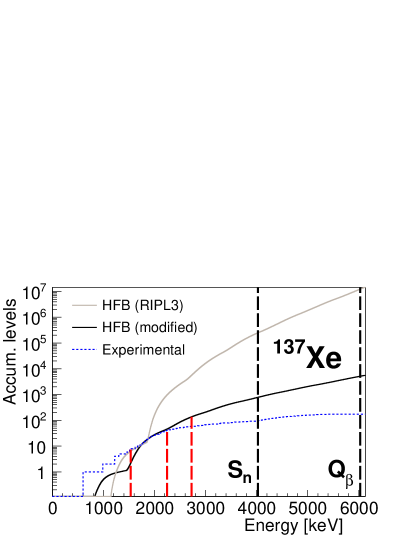
According to the Reference Input Parameter Library (RIPL-3) Capote et al. (2009), the level scheme of 137Xe is complete up to a level at 2726.140 keV, whereas for 95Sr it is only considered complete up to a level at 1259.7 keV. These limits define the known parts of the branching ratio matrices for the two cases studied. For 137Xe we considered, in addition, two alternative known parts of the level scheme: up to the level at 2244.1 keV, where there is good agreement between the experimental number of levels and the prediction of the statistical model (see Fig. 5), and up to the level at 1534.32 keV, where there is a substantial gap to the next level at 1621.1 keV.
In all cases, from the last known level included in the known level scheme up to the value (maximum decay energy window), a continuum region with 40 keV bins is defined. The branching ratios in this continuum region are determined with the statistical model, as presented in Tain and Cano-Ott (2007b). All parameters used for the statistical model calculations are extracted from RIPL-3 Capote et al. (2009) and summarized in Table 1, with PSF and deformation parameters based on Kopecky and Uhl (1990) and Raman et al. (2001), respectively. The level density parameter “a” at the neutron binding energy used to calculate the -strength function is obtained from Enhanced Generalized Superfluid Model (EGSM) calculations for 95Sr Capote et al. (2009), while for 137Xe it is taken from B. Fogelberg et al. Fogelberg et al. (1985). The Hartree-Fock-Bogoliubov (HFB) plus combinatorial nuclear level densities Goriely et al. (2008, 2007) have been used. For the level density of 95Sr the C and P correction parameters from RIPL-3 were used (0.0 and 0.78795, respectively). However, since the level density correction factors for 137Xe in RIPL-3 (C=2.96189 and P=1.09479) did not reproduce the available experimental information, we have calculated new corrections (C=-1.02 and P=0.69). In particular, the experimental number of resonances in 137Xe in the region 4.03-4.53 MeV, just above , according to the experimental work of B. Fogelberg et al. Fogelberg and Tovedal (1980) is 4 levels, (24 8) levels and (16 5) levels. With the original correction factors from RIPL-3 one obtains unrealistically large values: 618 levels, 12630 levels, and 24722 levels. The new correction factors have been calculated to obtain a more reasonable number of levels in the resonance region: 2.6 levels, 12 levels, and 24 levels. In addition, both sets of correction factors reproduce the accumulated number of levels at 1808.75 keV. A comparison of the original level density and the modified one for 137Xe is shown in Fig. 5. We should mention that the analysis of the DTAS spectra using the original level density did not allow a good reproduction of the experimental spectrum (see Subsection III.1).
| Nucleus | Level-density parameter | Deformation parameter | Photon strength function parameters | ||||||||
| E1 | M1 | E2 | |||||||||
| a() | E | E | E | ||||||||
| MeV-1] | [MeV] | [MeV] | [mb] | [MeV] | [MeV] | [mb] | [MeV] | [MeV] | [mb] | ||
| 137Xe | 12.3 | -0.018 | 15.279 15.043 | 4.621 4.487 | 94.649 194.973 | 7.966 | 4.000 | 0.329 | 12.241 | 4.466 | 2.851 |
| 95Sr | 15.802 | 0.31 | 14.069 18.236 | 3.951 6.467 | 77.156 94.264 | 8.999 | 4.000 | 0.476 | 13.828 | 4.970 | 1.829 |
Once the branching-ratio matrix is constructed, the response function is calculated by means of MC simulations Cano-Ott et al. (1999b). The detailed description of the geometry of the set-up and the nonproportionality of the light yield in NaI(Tl), as described in Cano-Ott et al. (1999b), are included in the simulations. The MC simulations were validated by comparison with measurements of well-known radioactive sources Guadilla et al. (2018). The TAGS analysis is then carried out by applying the expectation maximization (EM) algorithm to extract the -feeding distribution Tain and Cano-Ott (2007a).
The branching ratio matrix constructed combining the information from the statistical model and the known level scheme, provides a realistic guess of the true branching ratio matrix. Differences in model branching ratio matrices can appear not only because of the use of different nuclear statistical model parameters, but also because of ambiguities in the spin-parity values of levels in the known part of the level scheme. The impact of different choices of parameters can be used to estimate systematic uncertainties in the resulting -intensity distribution, as will be shown later. In fact, some choices can be ruled out because they do not lead to a good reproduction of the total absorption spectrum. In this respect, a significant advance in the TAGS technique is the introduction of segmented spectrometers like DTAS. The model branching ratio matrix can now be subjected to more restrictive tests, using the reproduction of the individual-module spectra and the module-multiplicity gated total absorption spectra as additional analysis criteria (where the module-multiplicity of an event, , is defined as the number of modules that fire above the threshold). All these tests improve significantly the reliability of the results, and they can provide a guide for empirical modification of the branching ratio matrix.
III.1 Decay of 137I
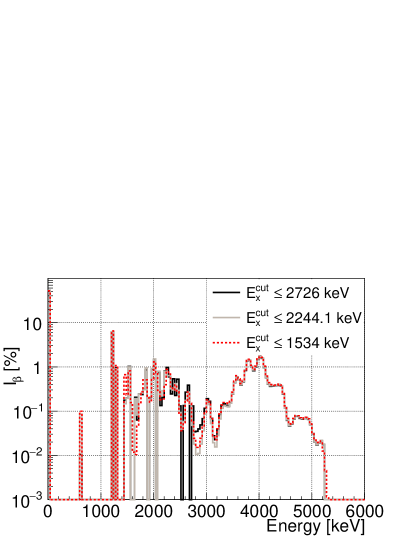
The spin-parity value of the ground state (g.s.) of 137I, according to ENSDF, is (), based on systematics Browne and Tuli (2007). In the analysis we used the value as the primary choice and we considered decays by allowed transitions and first forbidden transitions to states in the known part of the level scheme, while only allowed transitions were considered to states in the continuum. Alternative g.s. spin-parity values of and were also used to construct alternative branching ratio matrices that also gave a reasonable reproduction of the total absorption spectrum. The associated -intensities were considered in the evaluation of uncertainties. The three different choices for the known part of the level scheme in 137Xe mentioned above were also investigated. They were found to be equivalent, although the best reproduction of the total absorption spectrum was obtained with the known level scheme extending up to 2726.140 keV. Moreover, this choice was shown to reproduce better the module-multiplicity gated spectra, as will be discussed later. A comparison of the -intensities obtained with the three level schemes is shown in Fig. 6.
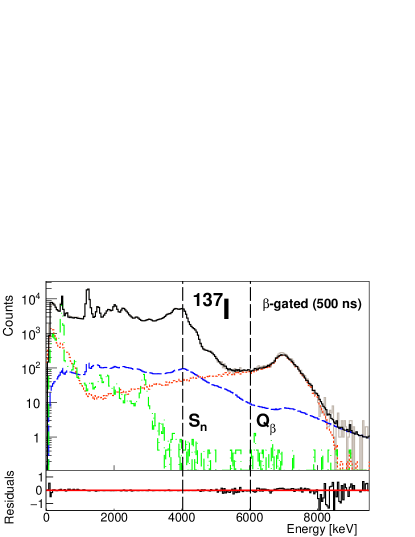
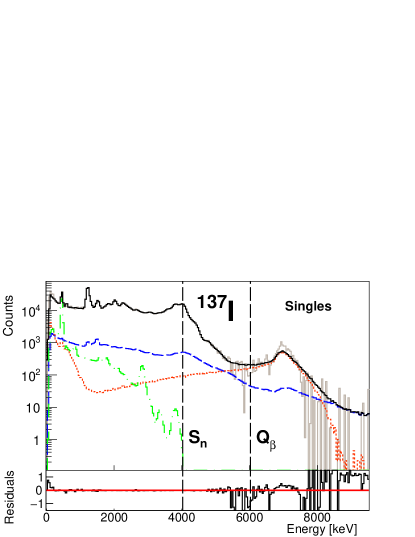
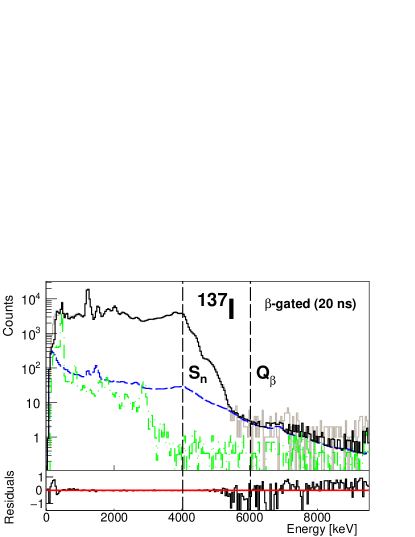
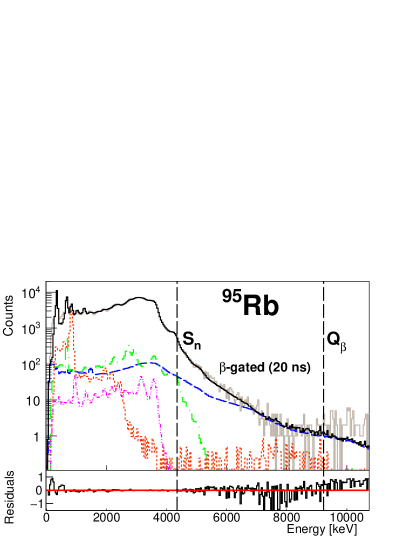
In Fig. 7 we show the quality of the analysis by comparing experimental spectra with the spectra reconstructed using Eq. (1) for different -gating conditions. In the top panel of the figure we show the analysis of the -gated spectrum with the 500 ns coincidence gate. In the central panel we show the analysis of the background subtracted singles spectrum (no -gated). In the bottom panel we show the analysis of the -gated spectrum with the 20 ns coincidence gate that eliminates neutron-induced -rays. The relative deviations between experimental and reconstructed spectra are shown in each case. They are small up to 5.2 MeV, except for the 20 ns gated spectrum in the first few hundred keV. This reflects the difficulty of reproducing the effective module threshold in the MC simulation. All three analyses were performed with the reference branching ratio matrix. It should be noted that the result of the analysis of the singles spectrum does not depend on the simulated -efficiency of the -detector, strongly varying close to , but is very sensitive to the proper background subtraction. On the other hand, the result of the analysis of the -gated spectrum with the neutron background suppressed does not depend on the MC simulation of the -n branch of the decay, but suffers from the higher threshold at low energies. A comparison of the -intensity distributions obtained from these three analyses is presented in Fig. 8. As can be seen the agreement is good except in the continuum region up to 3.5 MeV and for the weakly populated state at 601 keV.
We should mention that in the analysis of the singles spectrum the contribution of the daughter decay (dashed-dotted green line in the central panel of Fig. 7) was obtained from MC simulations. For that, the information on this decay available in ENSDF Browne and Tuli (2007) was used as input for the DECAYGEN event generator Tain and Cano-Ott (2007b). This information is reliable according to our TAGS analysis of the -gated 137Xe spectrum, and is in agreement with the recent TAGS result of Rasco et al. (2017). This procedure avoids the impact of the large statistical fluctuations of the experimental 137Xe singles spectrum after background subtraction. We would also like to point out that in the analysis of the -gated spectrum with the 20 ns time window, the same time window was applied to obtain the spectrum of the daughter decay contamination and the summing-pileup contribution.
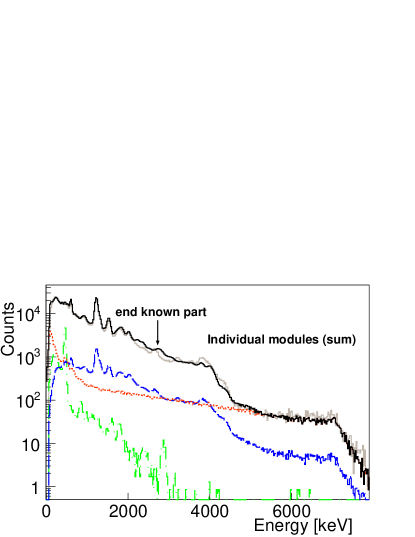
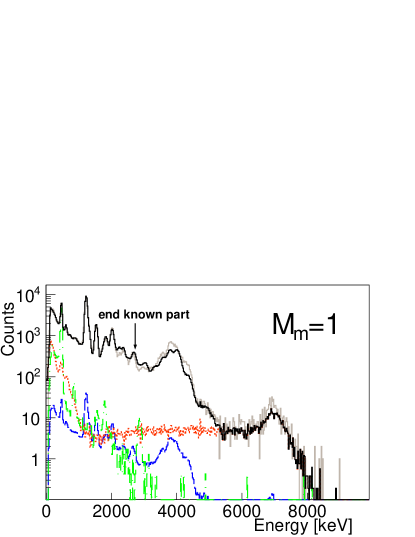
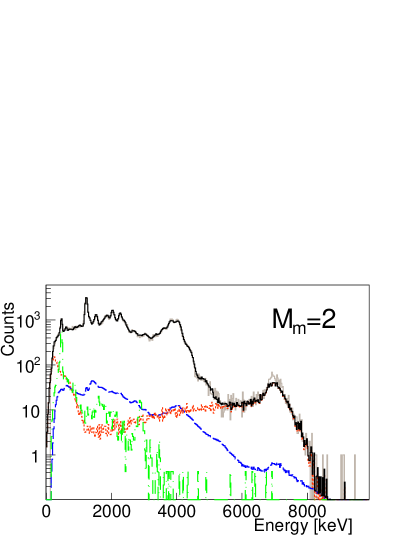
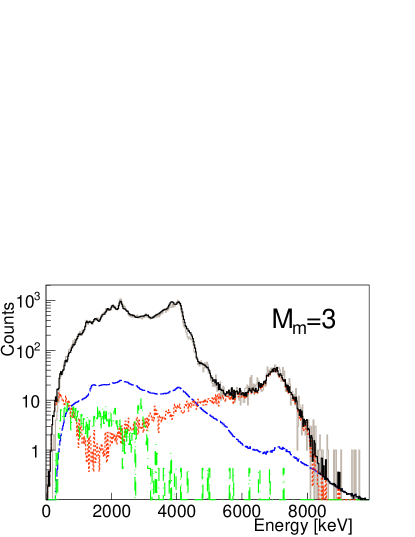
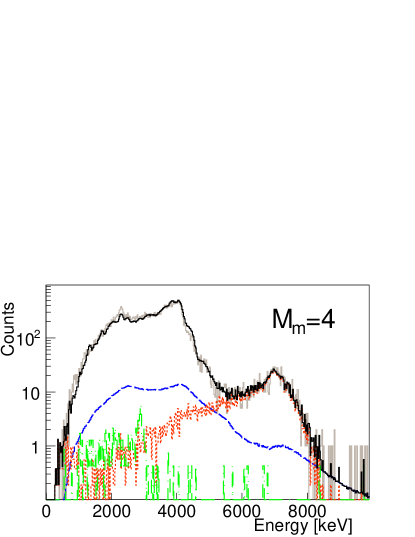
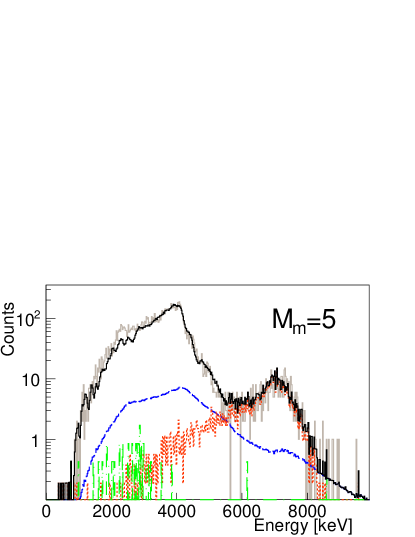
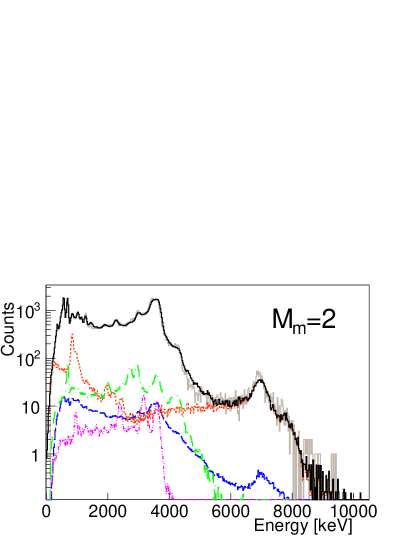
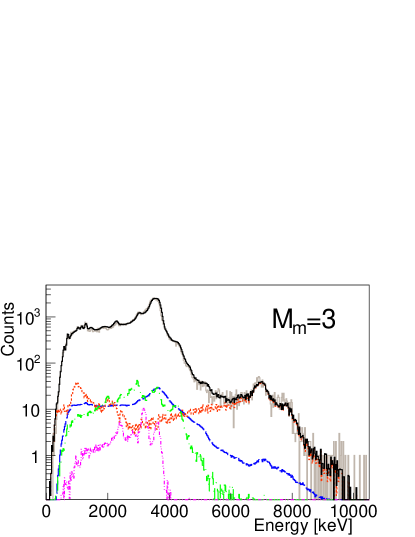
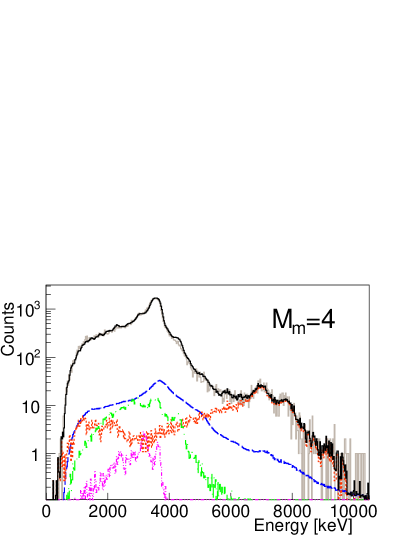
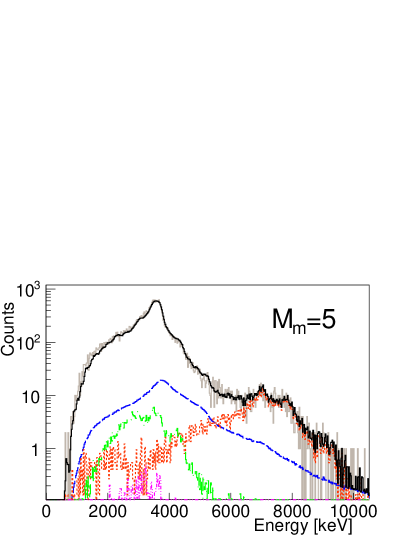
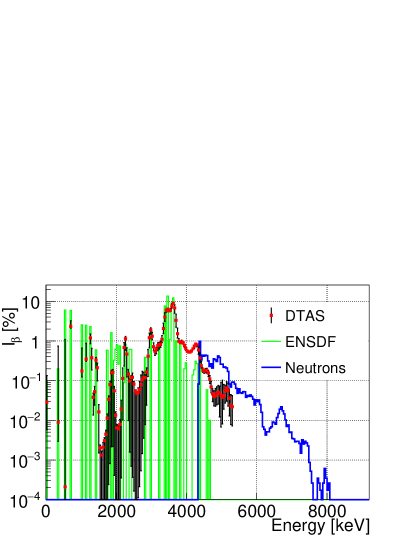
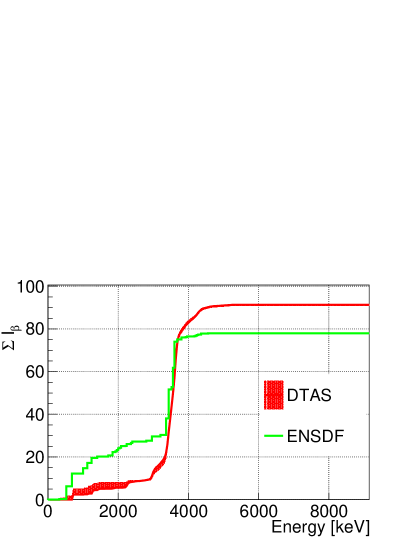
As mentioned before, the segmentation of DTAS allows one to make more stringent tests of the branching ratio matrix used to construct the spectrometer response function for the decay of interest. The quality of the reproduction of the individual-module spectra and the module-multiplicity gated total absorption spectra was investigated for these purposes. The spectra of the individual modules is sensitive to the single -ray energy distribution from the whole decay. A more powerful test is provided by the total absorption spectra for different module-multiplicity conditions, which reflect the -cascade energy and multiplicity distribution as a function of excitation energy. The corresponding experimental spectra were generated with a 500 ns -gating time window and are compared with MC simulations obtained with the DECAYGEN event generator Tain and Cano-Ott (2007b) using the reference branching-ratio matrix and the -intensity distribution from the analysis of the total absorption spectra (top panel in Fig. 7) as input. The comparison for the sum of the 18 single-module spectra can be seen in Fig. 9. A reasonable reproduction of the spectrum is obtained, except for an excess of counts in the simulation in the range MeV and a deficit of counts in the interval MeV. The quality of the reproduction of the total absorption spectra for module-multiplicities from 1 to 6 is shown in Fig. 10. We should emphasize that the same numerical factors used to normalize the contaminants for the total absorption spectrum (Fig. 7 top) were used to normalize the contaminants for all multiplicities. The agreement is excellent for to . The most significant differences are found for and in fact the behavior is similar to that observed for single-module spectra, not surprising since the spectrum is mostly sensitive to single -ray de-excitations. None of the changes in the branching ratio matrix that we have tested (see discussion below) resulted in a better agreement, thus we adopted this -intensity distribution as the reference solution. This distribution is obtained for the 500 ns time window and it is depicted with red points in the top panel of Fig 11. The black vertical bars indicate the uncertainty obtained with the procedure detailed below. For comparison we include in this figure the -intensity obtained in high-resolution -ray spectroscopy from ENSDF Browne and Tuli (2007), as well as the -intensity followed by neutron emission, , discussed above. In the lower panel of Fig 11 the accumulated -intensity as a function of excitation energy from DTAS is compared with the one from ENSDF, showing clearly the effect of Pandemonium in the high-resolution data and the importance of using the TAGS technique.
 |
 |
 |
 |
 |
 |
For the evaluation of the systematic uncertainty in the -intensity resulting from the TAGS analysis, we considered all possible solutions compatible with reproduction of the data. In comparison, the statistical uncertainty was found to be negligible. The envelope of all these -intensity distributions defines the uncertainty bars shown in Fig. 11. The -intensity distribution obtained in the analysis of the -gated spectrum with a 500 ns time window (shown in Fig. 7 top) is taken as the reference result, and it can be found in the Supplemental Material Sup . The other two -intensity distributions plotted in Fig. 8 obtained from the same data with different gating conditions are considered as cross-checks of the reference solution. The influence of other experimental parameters in the results was investigated for the evaluation of the uncertainties of the reference solution. One of these parameters is the normalization factor of the contaminants. The corresponding normalization was varied until the reproduction of the total absorption spectrum was no longer considered acceptable. The normalization factor of the summing-pileup was changed by a factor of 30 and the ones for the daughter contribution and the -n contribution were changed by 5. The resulting -intensity distributions were included in the uncertainty estimation. We also changed the energy threshold in the simulation of the -detector by 10 keV to evaluate the influence in the results of a change in the -efficiency curve. The uncertainty in the experimental calibration of DTAS was also taken into account: the experimental energy calibration parameters have been changed by 0.5, while the width calibration parameters were changed by 15.
The influence of different branching ratio matrices was considered as well. This includes the -intensity distributions obtained with the alternative spin-parity values for the g.s. level of 137I mentioned above. We tested the impact on the electric dipole PSF of alternative values of the level density parameter at : 7.118, from EGSM calculations, and 16.461, from TALYS Koning et al. (2005) (see Table 1). We introduced by hand modifications in the branching ratio matrix of the continuum in order to reproduce better the experimental -intensities at low excitation energies obtained in high resolution studies Fogelberg and Tovedal (1980); Ohm et al. (1980); Fogelberg et al. (1985) (see Table 2). Although it worsened the reproduction of the sum of the individual modules and the module-multiplicity gated spectra, it gave a good reproduction of the total absorption spectrum and it was included in the evaluation of the uncertainties.
| Energy [keV] | ENSDF | TAGS | TAGS∗ |
|---|---|---|---|
| 1218 | 0.128 | 0.071 | 0.127 |
| 352.01 | 0.490 | 0.659 | 0.491 |
| 556.06 | 0.151 | 0.252 | 0.150 |
| 680.7 | 0.244 | 0.263 | 0.242 |
The impact of the first bin of the experimental spectrum included in the analysis was also evaluated. We found that it affects significantly the g.s. feeding intensity determination and we considered variations of 1 bin in the result. We have also used the maximum entropy (ME) algorithm Tain and Cano-Ott (2007a) instead of the conventionally used EM algorithm to check the influence of the method of deconvolution in the analysis. The intensities determined in all cases were normalized to 100-, where we take as a reference the value from ENSDF: 7.14 Browne and Tuli (2007). However, we also considered two alternative values: 7.76 Agramunt et al. (2016) and 7.33 Abriola et al. (2011).
We obtained a g.s. feeding intensity of 50.8(43). In the analysis with a 20 ns window, an intensity of 47.4 was obtained, while the analysis of the background subtracted singles spectrum gives a value of 49.9. This intensity was also calculated by means of a - counting method for TAGS data proposed by Greenwood et al. Greenwood et al. (1992), and we obtained a similar value of 51.2(6). These two values are larger than the quoted number in ENSDF: 45.2(5). It is also worth mentioning that B. Fogelberg et al. Fogelberg and Tovedal (1980) reported a -intensity of 47 to the g.s., while a recent TAGS measurement determined a value of 49(1) Rasco et al. (2017).
III.2 Decay of 95Rb
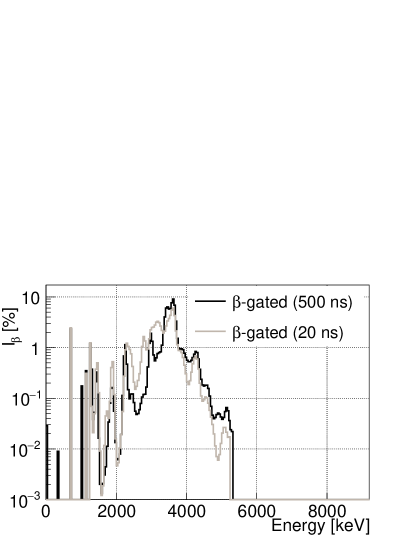
A spin-parity value of Basu et al. (2010) is used for the g.s. of 95Rb. For the analysis, we considered allowed transitions and first forbidden transitions to states of the known part of the level scheme, and only allowed transitions to states in the continuum. Using the known level scheme and the nuclear statistical model parameters described at the beginning of Section III, we performed the analysis of the -gated total absorption spectrum with the time window of 500 ns. The quality of the reproduction of the experimental spectrum is shown in the top panel of Fig. 12 and the corresponding -intensity distribution is shown in Fig. 13 (see also the Supplemental Material Sup ). We also performed the analysis of the -gated spectrum with a condition of 20 ns to eliminate the delayed contribution associated with neutron interactions of the -n branch (see bottom panel of Fig. 12). Note that here there is a prompt contribution due to the -rays de-exciting 94Sr. This did not happen in 137I, where only the g.s. of 136Xe is populated. This contribution can be identified as an 837 keV -transition peak visible in the spectra. In the -gated spectrum with the wide time coincidence window, the prompt contribution is partially added to the delayed contribution distorting the high energy side of the neutron capture bump, as shown in Section II.2. As seen in the bottom panel of Fig. 12, the use of a 20 ns time coincidence window in the MC simulation of the -n branch eliminates the neutron capture bump leaving a prominent peak at 837 keV used for normalization of this contamination. It should be noted (compare top and bottom panels in Fig. 12) that the increase of effective DTAS threshold associated with the narrow time window, strongly affects the shape of the total absorption spectrum in this case. The reason is that we are cutting some low-energy -rays that take part in many cascades de-exciting high energy levels. In particular, the intense -ray of 204 keV, which comes from a level at 556 keV, is clearly cut, thus shifting and distorting the spectrum. This explains the large differences in the -intensity distributions obtained from the analysis of both spectra, as shown in Fig. 13.
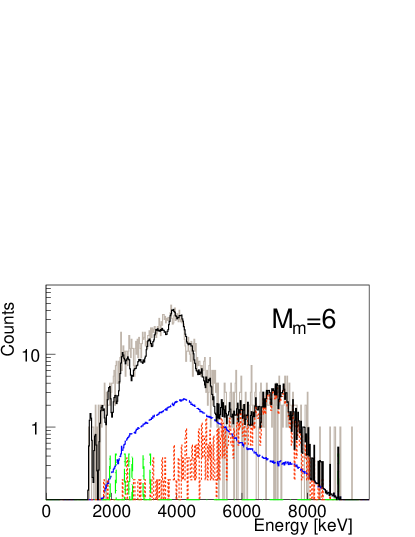
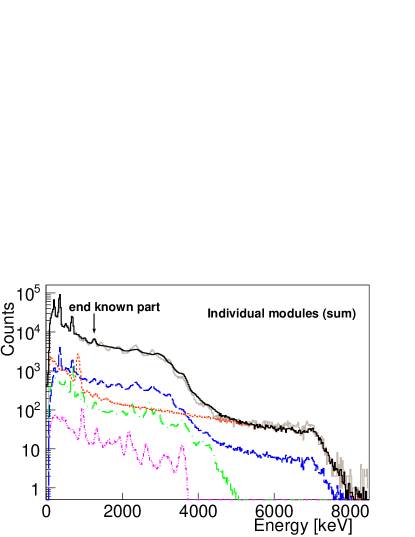
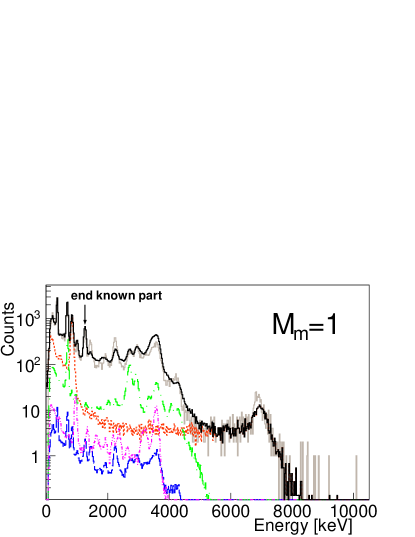
As in the case of 137I the branching ratio matrix used in these analyses was tested investigating the reproduction of the sum of the individual-module spectra (see Fig. 14) and the module-multiplicity gated spectra (see Fig. 15). The result of the analysis of the -gated spectrum with the 500 ns time gate was used as the reference one. As for 137I, the overall agreement is excellent and the larger differences are found for the multiplicity gated total absorption spectrum and the sum of the individual-module spectra. The discrepancies in the reproduction of the fine structure in these spectra above the last discrete level in the known level scheme, seem to reflect the difficulty in the statistical model of reproducing variations in the branching to the g.s for individual levels. The impact of these discrepancies in the -intensity distribution is small, given the limited contribution of to the total spectrum.
 |
 |
 |
 |
 |
 |
Similarly to the 137I case, we have considered different sources of systematic error for the reference solution obtained with a 500 ns time window. The maximum variation of the normalization factor for the -delayed neutron branch compatible with the reproduction of the total absorption spectrum was 10. Due to the large contribution of the -delayed neutron branch, especially at high energies, the summing-pileup normalization could be changed by a factor 100, and the activities of daughter and granddaughter were changed by a factor 50 without noticing a distortion in the reproduction of the spectrum. Apart from that, we have considered the same possible sources of uncertainty as in 137I for the threshold of the -detector, the energy calibration and the width calibration. We also considered the solution obtained by applying the ME deconvolution method. Apart from the ENSDF value of 8.7 Basu et al. (2010), alternative values have been used to normalize the -intensities to 100-: 8.87 Abriola et al. (2011) and 9.08 Agramunt et al. (2016). A modified branching ratio matrix reproducing the known -intensities for low-excitation levels, coming from high-resolution studies Kratz et al. (1983), was also considered (see Table 2). Although it gave acceptable results, it worsened the reproduction of the total spectrum and the reproduction of the module-multiplicity gated spectra. The intensity distribution obtained with a narrow gate of 20 ns is considered just as a cross-check (see Fig. 13) and it was not included in the error budget.
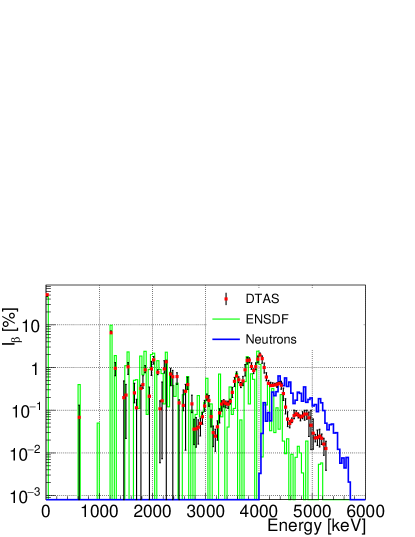
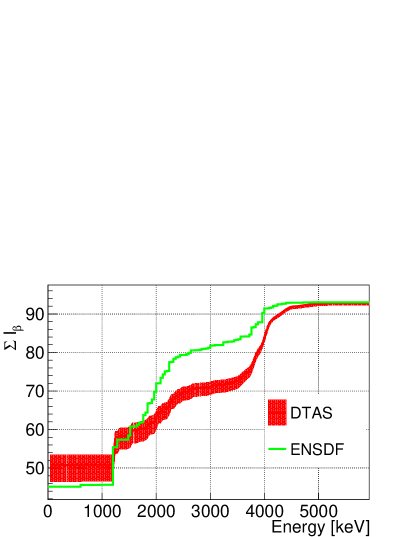
In Fig. 16, the -intensity distribution including the systematic uncertainty is compared with the high-resolution result from ENSDF Basu et al. (2010). The -intensity distribution obtained with DTAS is normalized to 100-, whereas the intensity in ENSDF is normalized to 77.941 Basu et al. (2010) since the evaluators recognized the incompleteness of the experimental information.
IV -neutron competition
In the two -delayed neutron emitters studied in this work a significant amount of intensity de-exciting by means of -rays, , is observed above . In order to compare with the neutron emission probability () we can define as the integrated above :
| (2) |
In Table 3 the values obtained in this work are compared with the values. The -intensity connecting to levels that de-excite by means of -rays represents 56 of the total -intensity above for 137I and 25 for 95Rb. The situation is similar to that found in the decays of 87,88Br Tain et al. (2015a); Valencia et al. (2017) and can be understood as a nuclear structure effect, as discussed below. Compared to the intensity observed above in high-resolution experiments, retrieved from the ENSDF data base, we observe 3 and 5 times higher values for 137I and 95Rb, respectively, indicating a sizable Pandemonium effect.
| Nucleus | ENSDF | TAGS | |
|---|---|---|---|
| [] | [] | [] | |
| 137I | 2.76 | 9.25 | 7.14(23) |
| 95Rb | 0.57 | 2.92 | 8.7(3) |
The uncertainties quoted in Table 3 are the quadratic sum of two terms. One term is evaluated from the dispersion of values calculated from the different intensity distributions obtained in our analysis under different assumptions, as explained in previous Sections. The second term arises from the uncertainty in the first bin considered in the integration of Eq. (2), due to the uncertainty of our energy calibration. This term amounts to 20 for 137I, and 26 for 95Rb and dominates the upper limit of the uncertainty given in Table 3.
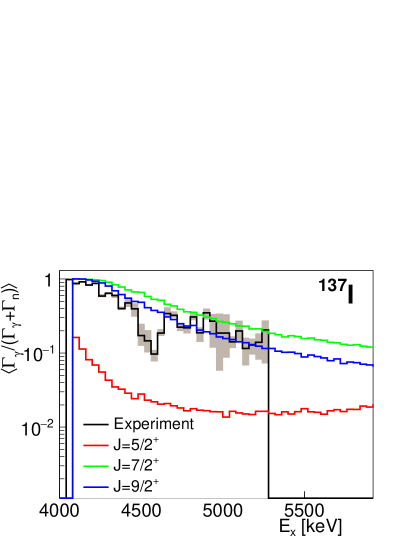
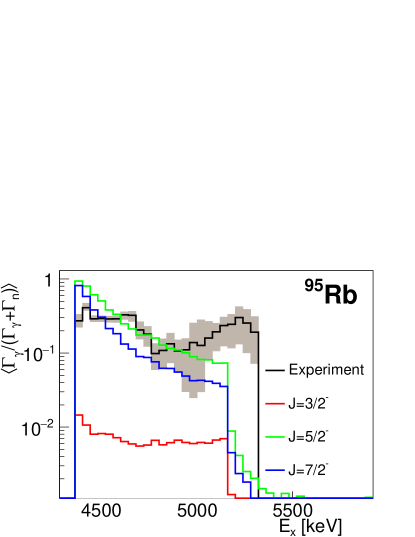
Similar to the previous works on 87,88Br and 94Rb Tain et al. (2015a); Valencia et al. (2017), we have evaluated the ratio as a function of the excitation energy above . This ratio is equivalent to the average ratio of widths: , that is calculated in the Hauser-Feshbach formalism as described in detail in Valencia et al. (2017); Tain et al. (2017a). The ingredients for these calculations are the NLD and the PSF in the daughter nucleus, and the NTC into the -delayed neutron descendant. The first two are the same used for the construction of the branching ratio matrix in the TAGS analysis, whereas NTC are obtained from optical model calculations performed with TALYS-1.8 Koning et al. (2005). In the case of 137I we only need to consider the neutron transmission to the 0+ g.s. of 136Xe, while in the case of 95Rb several levels are populated in 94Sr. Spin-parity values from RIPL-3 Capote et al. (2009) have been selected for those levels in 94Sr that have no experimentally assigned values.
For the calculation of the average ratio of widths we used the MC method explained in Valencia et al. (2017). This allows one to take into account Porter-Thomas fluctuations on neutron and widths. A direct comparison between the experimental ratio of -intensities and the average ratio of widths is meaningful, since the average is taken over all levels of a given in the daughter nucleus within the experimental energy bin of 40 keV. The allowed decay of 137I populates positive parity states with =5/2, 7/2, 9/2, while in the decay of 95Rb negative parity states with =3/2, 5/2, 7/2 are populated. In Fig. 17 the comparison between the experimental ratio and the calculation for each is shown. The uncertainty band around the experimental result (grey filled area) corresponds to the envelope of the ratios calculated for all possible intensity distributions compatible with the data, discussed in the previous Section. As seen in the figure, the large in 137I is coming from and states that need to emit neutrons to populate the g.s. in 136Xe. This emission is hindered by the centrifugal barrier. Analogously, in the decay of 95Rb, the emission of neutrons from and states to populate the g.s. in 94Sr is very suppressed up to keV, the energy of the first excited state in 94Sr, with . Above that energy neutron emission can proceed via and emission can no longer compete. Experimentally we observe still a sizable competition, but we ascribe it to the uncertainty in the subtraction of the contaminants. Note that this region contributes little to .
V energy spectra and mean energies
The -intensity distributions obtained in this work were also used to calculate the energy spectra by means of subroutines from the program of NNDC log . In the calculations we have assumed allowed shapes for all decay branches.
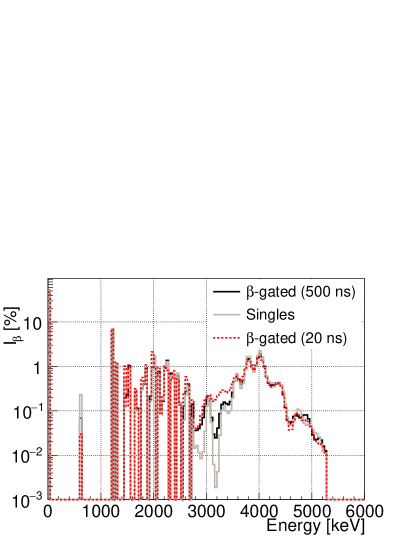
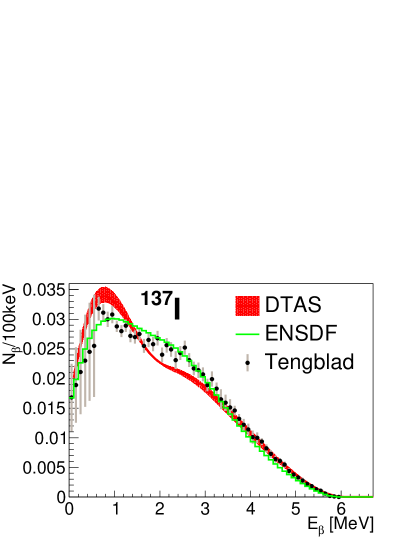
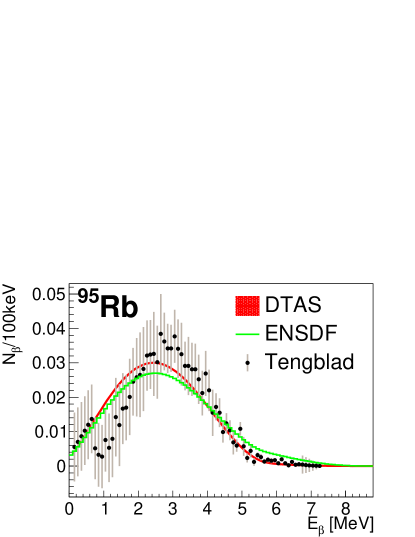
In Fig. 18 the deduced spectra for the decays of 137I and 95Rb are presented. The distributions calculated with the data from ENSDF, based on high-resolution -ray spectroscopy measurements Browne and Tuli (2007); Basu et al. (2010), are also included for comparison. They show a shift to higher energies with respect to the TAGS data, characteristic of the Pandemonium systematic error. The spectra include the contribution of the -delayed neutron branch. For both nuclei the spectra were measured by Tengblad et al. at OSIRIS-ISOLDE Tengblad et al. (1989) using a spectrometer. This method is also Pandemonium free and a meaningful comparison between our calculated spectra and their experimental data can be made, in line with Valencia et al. (2017); Rice et al. (2017). Differences in shape are observed for both isotopes, as shown in Fig. 18. This is especially clear in the case of 95Rb. For both nuclei we observe agreement at high energies, while our spectra is lower at intermediate energies and higher at lower energies. The jump observed in Tengblad et al. data below 0.8 MeV is due to the use of a different detector.
The average and energies obtained with the present TAGS results are listed in Table 4, where uncertainties correspond to the evaluation of the mean energies for all the solutions compatible with a good analysis result mentioned in Section III. For the mean energies we have summed the contribution from the beta-delayed neutron branch, taken from ENSDF Browne and Tuli (2007); Basu et al. (2010). In the mean -energy calculation of 95Rb the contribution of the emission in the de-excitation of 94Sr has also been taken into account. The average energies measured at OSIRIS by Rudstam et al. Rudstam et al. (1990), and the energies obtained by Tengblad et al. Tengblad et al. (1989) are also listed for comparison, taken from Rudstam et al. (1990). A similar comparison has been done in two recent publications Valencia et al. (2017); Rice et al. (2017) for a number of nuclei. A problem with the normalization of the average decay energies was pinpointed in Rice et al. (2017): all average energies in Rudstam et al. (1990) should be scaled up by 14. In our case, however, even though Rudstam mean energies are larger than the TAGS values, both sets of numbers are compatible within the quoted errors. It is not the case for the mean energies, where discrepancies beyond the quoted errors are found, following the trend shown in Valencia et al. (2017) and in line with the shape discrepancies of Fig. 18.
| Nucleus | [keV] | [keV] | ||||||
|---|---|---|---|---|---|---|---|---|
| ENDF | JEFF | Rudstam | TAGS | ENDF | JEFF | Rudstam | TAGS | |
| 137I | 1135(20) | 1212 | 1230(150) | 1220 | 1920(26) | 1861 | 2050(40) | 1934 |
| 95Rb | 2162(42) | 2629 | 3370(220) | 3110 | 2296(110) | 2824 | 2850(150) | 2573 |
In Table 4 we also include for comparison the and average energies from the ENDF/B-VII.1 Chadwick et al. (2011) and JEFF-3.1 JEF databases. Although a clear Pandemonium effect was observed when comparing the present TAGS -intensity distributions and the previous results from high-resolution measurements in Figs. 11 and 16 (especially evident for the comparison of the accumulated intensities), the average energies for 137I listed in Table 4 do not differ significantly. This is due to the redistribution of the -intensity consequence of the larger g.s. feeding probability that we determined. This is not the case for 95Rb, where the average energy of the databases is clearly underestimated, whereas the average energy is overestimated, as is normally found with the Pandemonium effect Algora et al. (2010).
VI Reactor summation calculations
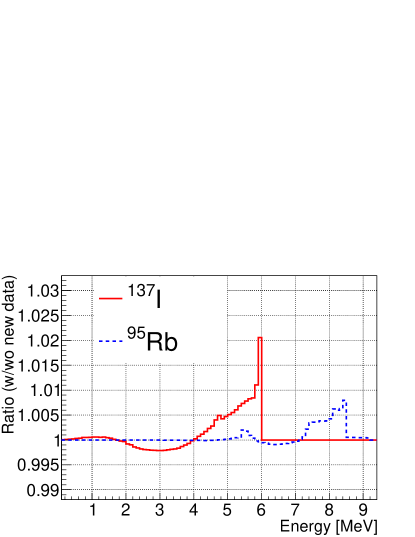
The impact of the present results on reactor antineutrino summation calculations has been evaluated. For this, the summation method developed by the group of Nantes Fallot et al. (2012) has been employed assuming allowed shapes. The impact of the present results in the calculation for each of the four main fissile isotopes in a pressurized water reactor (PWR) - 235U, 239Pu, 241Pu, and 238U - has been evaluated. For 239Pu the ratio between the antineutrino spectrum calculated with the inclusion of the present TAGS -intensity distributions, and the original calculation, where Rudstam data were taken, is shown in Fig. 19. Similar figures are obtained for the other three fissile isotopes. The effect of the results for 137I is to increase the ratio by up to 1 in the region 4-6 MeV for uranium and plutonium isotopes. On the other hand, the new results for 95Rb increase the ratio up to 0.5 in the region of 7-8.5 MeV in the four fissile isotopes.
A summation method was also employed for the calculation of the reactor DH. The impact of replacing the average and energies available at ENDF/B-VII.1 by the present TAGS values has been studied. The effect in the electromagnetic component of 235U and 239Pu is an increase of and , respectively, for times shorter than 1 s. The light particle component is reduced by less than 0.5 in both cases below 1 s. Such a modest impact can be understood on the one hand due to the similarity between the TAGS average energies and the values available at ENDF/B-VII.1 for 137I, and on the other hand because of the low cumulative fission yield of 95Rb.
VII Conclusions
In this work we reported the results of the TAGS measurements of two important -delayed neutron emitters. The sensitivity of our technique made it possible to determine the -intensity to states above followed by -rays. This -intensity was found to be larger than in previous measurements affected by the Pandemonium effect. Moreover, it represents 56 and 25 of the -intensity above in 137I and 95Rb, respectively. The competition between neutron emission and de-excitation can be understood as an effect of nuclear structure, due to the large neutron angular momentum required to populate the granddaughter levels, because of their spin-parity values.
The presence of the Pandemonium effect in previous high-resolution data was deduced when comparing the present TAGS -intensity distributions and the values from ENSDF, as well as the average and energies with the reference values from the databases. The spectra constructed with the -intensity distributions of this work were compared with the measured spectra free from Pandemonium from Tengblad et al.. Discrepancies in the shape of the spectra were found, in line with recent works Valencia et al. (2017); Rice et al. (2017).
A careful study of the systematic uncertainties was performed for each case in order to verify our results. We also considered the results obtained from the analyses of spectra constructed with a -neutron discrimination condition. Even though the set-up was not optimized for such a procedure, the reasonable quality of the results reinforces the interest of this methodology for future TAGS measurements of -delayed neutron emitters. In addition, for 137I, the analysis of the background subtracted singles spectrum was found to be in good agreement with the analysis of the -gated spectra.
Two stringent cross-checks of the branching ratio matrices for 137I and 95Rb were carried out by means of MC simulations based on our results: reproduction of the individual crystal spectra and reproduction of the module-multiplicity gated spectra. Both were reasonably well reproduced with the results of our TAGS analysis, showing two important features of our analysis procedure: the quality of the MC simulations (including the reproduction of the -n branch) and the validity of our branching ratio matrices. For low-lying levels, we have also reproduced the known absolute -intensities obtained with our -intensity distributions after modifying the branching ratio matrix. Although it did not lead to the best reproduction of the spectra, which was interpreted as a consequence of the incomplete knowledge of these decays, it was included in the estimation of systematic uncertainties.
Finally, the impact of these new results in reactor summation calculations has been evaluated. The effect of replacing previous database values with our new results was found to be less than 1 for both antineutrino spectrum calculations and DH calculations.
Acknowledgements.
This work has been supported by the Spanish Ministerio de Economía y Competitividad under Grants No. FPA2011-24553, No. AIC-A-2011-0696, No. FPA2014-52823-C2-1-P, No. FPA2015-65035-P, No. FPI/BES-2014-068222, No. FPA2017-83946-C2-1-P and the program Severo Ochoa (SEV-2014-0398), by the Spanish Ministerio de Educación under the FPU12/01527 Grant, by the European Commission under the FP7/EURATOM contract 605203 and the FP7/ENSAR contract 262010, and by the Programme (CSIC JAE-Doc contract) co-financed by FSE. We acknowledge the support of the UK Science and Technology Facilities Council (STFC) Grant No. ST/P005314/1. This work was also supported by the Academy of Finland under the Finnish Centre of Excellence Programme (Project No. 213503, Nuclear and Accelerator-Based Physics Research at JYFL).References
- Roberts et al. (1939) R. Roberts et al., Phys. Rev. 55, 510 (1939).
- Margaret Burbidge et al. (1957) E. Margaret Burbidge et al., Rev. Mod. Phys. 29, 547 (1957).
- Kasen et al. (2017) D. Kasen et al., Nature 551, 80 (2017).
- Mumpower et al. (2016) M. Mumpower et al., Prog. Part. Nucl. Phys. 86, 86 (2016).
- Hauser and Feshbach (1952) W. Hauser and H. Feshbach, Phys. Rev. 87, 366 (1952).
- Rauscher and Thielemann (2000) T. Rauscher and F.-K. Thielemann, At. Data Nucl. Data Tables 75, 1 (2000).
- Tain et al. (2015a) J. L. Tain et al., Phys. Rev. Lett. 115, 062502 (2015a).
- Valencia et al. (2017) E. Valencia et al., Phys. Rev. C 95, 024320 (2017).
- Tain et al. (2017a) J. L. Tain et al., EPJ Web of Conferences (2017a).
- Tain et al. (2017b) J. L. Tain et al., JPS Conf. Proc. 14, 010607 (2017b).
- Hardy et al. (1977) J. Hardy et al., Phys. Lett. B 71, 307 (1977).
- Alkhazov et al. (1989) G. D. Alkhazov et al., Leningrad Nuclear Physics Institute Report No. 1497 (1989).
- Spyrou et al. (2016) A. Spyrou et al., Phys. Rev. Lett. 117, 142701 (2016).
- Moeller et al. (2003) P. Moeller et al., Phys. Rev. C 67, 055802 (2003).
- Borzov et al. (2003) I. N. Borzov et al., Phys. Rev. C 67, 025802 (2003).
- (16) K. Okumura et al., Proceedings of the 2012 Symposium on Nuclear Data, Kyoto, JAEA-Conf. 2013-002, INDC(JPN)-198 (Japan Atomic Energy Agency, Tokaimura, 2013), p. 15. .
- Abe et al. (2012) Y. Abe et al., Phys. Rev. Lett. 108, 131801 (2012).
- An et al. (2012) F. P. An et al., Phys. Rev. Lett. 108, 171803 (2012).
- Ahn et al. (2012) J. K. Ahn et al., Phys. Rev. Lett. 108, 191802 (2012).
- Kim (2017) Y. Kim, J. Phys.: Conf. Ser. 888, 012010 (2017).
- Hahn et al. (1988) A. A. Hahn et al., Phys. Lett. B 218, 365 (1988).
- Haag et al. (2014) N. Haag et al., Phys. Rev. Lett. 112, 122501 (2014).
- Mention et al. (2011) G. Mention et al., Phys. Rev. D 83, 073006 (2011).
- Choi et al. (2016) J. H. Choi et al., Phys. Rev. Lett. 116, 211801 (2016).
- An et al. (2016) F. P. An et al., Phys. Rev. Lett. 116, 061801 (2016).
- Abe et al. (2016) Y. Abe et al., J. High Energy Phys. 01, 163 (2016).
- Fallot et al. (2012) M. Fallot et al., Phys. Rev. Lett. 109, 202504 (2012).
- Algora et al. (2010) A. Algora et al., Phys. Rev. Lett. 105, 202501 (2010).
- IAE (2015) “IAEA report INDC(NDS)-0676,” (2015).
- Moore et al. (2013) I. D. Moore et al., Nucl. Instrum. and Methods B 317, 208 (2013).
- Tain et al. (2015b) J. L. Tain et al., Nucl. Instrum. and Methods A 803, 36 (2015b).
- Eronen et al. (2012) T. Eronen et al., Eur. Phys. J. A 48, 46 (2012).
- Guadilla et al. (2018) V. Guadilla et al., Nucl. Instrum. and Methods A 910, 79 (2018).
- Zakari-Issoufou et al. (2015) A.-A. Zakari-Issoufou et al., Phys. Rev. Lett. 115, 102503 (2015).
- Rice et al. (2017) S. Rice et al., Phys. Rev. C 96, 014320 (2017).
- Guadilla et al. (2017) V. Guadilla et al., Phys. Rev. C 96, 014319 (2017).
- Cano-Ott et al. (1999a) D. Cano-Ott et al., Nucl. Instrum. and Methods A 430, 488 (1999a).
- Agostinelli et al. (2003) S. Agostinelli et al., Nucl. Instrum. and Methods A 506, 250 (2003).
- Brady (1989) M. Brady, Evaluation and Application of Delayed Neutron Precursor Data (Los Alamos National Laboratory, 1989).
- Kawano et al. (2008) T. Kawano et al., Phys. Rev. C 78, 054601 (2008).
- Kratz et al. (1982) K.-L. Kratz et al., Z. Phys. A 306, 239 (1982).
- Hoff (1981) P. Hoff, Nuclear Phys. A 359, 9 (1981).
- Gabelmann (1987) H. Gabelmann, Untersuchung des Beta-Verzogerten Neutronenzerfalls Neutronenreicher Brom-, Rubidium- und Caesiumisotope (Ph.D. thesis, Johannes Gutenberg-Universitat, Mainz, 1987).
- Cano-Ott et al. (1999b) D. Cano-Ott et al., Nucl. Instrum. and Methods A 430, 333 (1999b).
- Tain and Cano-Ott (2007a) J. L. Tain and D. Cano-Ott, Nucl. Instrum. and Methods A 571, 728 (2007a).
- Tain and Cano-Ott (2007b) J. L. Tain and D. Cano-Ott, Nucl. Instrum. and Methods A 571, 719 (2007b).
- Capote et al. (2009) R. Capote et al., Nucl. Data Sheets 110, 3107 (2009).
- Kopecky and Uhl (1990) J. Kopecky and M. Uhl, Phys. Rev. C 41, 1941 (1990).
- Raman et al. (2001) S. Raman, C. W. Nestor Jr, and P. Tikkanen, Atomic Data and Nuclear Data Tables 78, 1 (2001).
- Fogelberg et al. (1985) B. Fogelberg et al., Phys. Rev. C 31, 2041 (1985).
- Goriely et al. (2008) S. Goriely, S. Hilaire, and A. J. Koning, Phys. Rev. C 78, 064307 (2008).
- Goriely et al. (2007) S. Goriely, M. Samyn, and J. Pearson, Phys. Rev. C 75, 064312 (2007).
- Fogelberg and Tovedal (1980) B. Fogelberg and H. Tovedal, Nuclear Physics A 345, 13 (1980).
- Browne and Tuli (2007) E. Browne and J. K. Tuli, Nuclear Data Sheets 108, 2173 (2007).
- Rasco et al. (2017) B. C. Rasco et al., Phys. Rev. C 95, 054328 (2017).
- (56) “See Supplemental Material at url for intensity distributions,” .
- Koning et al. (2005) A. Koning, S. Hilaire, M. Duijvestijn, R. Haight, M. Chadwick, and T. K. (Eds.), Proceedings of the International Conference on Nuclear Data for Science and Technology, ND2004, AIP 769, 1154 (2005).
- Ohm et al. (1980) H. Ohm et al., Z. Phys. A 296, 23 (1980).
- Basu et al. (2010) S. K. Basu et al., Nuclear Data Sheets 111, 2555 (2010).
- Agramunt et al. (2016) J. Agramunt et al., Nucl. Instrum. and Methods A 807, 69 (2016).
- Abriola et al. (2011) D. Abriola et al., IAEA Consultants Meeting on Beta Delayed Neutron Evaluation, Summary Report, INDC(NDS)-0599 (2011).
- Greenwood et al. (1992) R. C. Greenwood, D. A. Struttmann, and K. D. Watts, Nucl. Instrum. and Methods A 317, 175 (1992).
- Kratz et al. (1983) K.-L. Kratz et al., Z. Phys. A 312, 43 (1983).
- (64) “ENSDF Analysis Programs, LOGFT, National Nuclear Data Center, Brookhaven National Laboratory,” http://www.nndc.bnl.gov/nndcscr/ensdf_pgm/analysis/logft/unx/.
- Tengblad et al. (1989) O. Tengblad et al., Nucl. Phys. A 503, 136 (1989).
- Rudstam et al. (1990) G. Rudstam et al., Atomic Data and Nuclear Data Tables 45, 239 (1990).
- Chadwick et al. (2011) M. B. Chadwick et al., Nucl. Data Sheets 112, 2887 (2011).
- (68) “The JEFF nuclear data library,” http://www.oecd‐nea.org/dbdata/jeff/.