????????? 111Part of the material and additional material is published in Schwengner14 ; Frauendorf14 .
Low-Energy Magnetic Radiation
Abstract
A pronounced spike at low energy in the strength function for magnetic radiation (LEMAR) is found by means of Shell Model calculations, which explains the experimentally observed enhancement of the dipole strength. LEMAR originates from statistical low-energy M1-transitions between many excited complex states. Re-coupling of the proton and neutron high-j orbitals generates the strong magnetic radiation. LEMAR is predicted for nuclides with participating in the r-process of element synthesis. It increases the reaction rates by a factor of 2.5. The spectral function of LEMAR follows Planck’s Law. A power law for the size distribution of the values are found.
1 Introduction
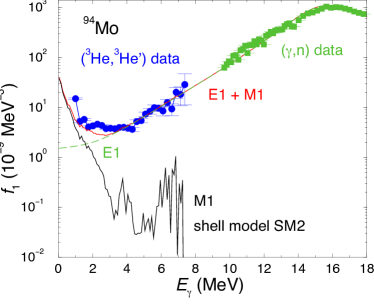
Photonuclear reactions and the inverse radiative-capture reactions between nuclear states in the region of high excitation energy and large level density are of considerable interest in many applications. A critical input to calculations of the reaction rates is the average strength of the cascade of -transitions de-exciting the nucleus, which is described by photon strength function. An increase of the dipole strength function below 3 MeV toward low -ray energy has recently been observed in nuclides in the mass range from 40 to 100, in particular, using (3He,3He’) reactions on various Mo isotopes gut05 . The data are shown in Fig. 1. Around 1 MeV, the experimental strength function (blue) is about a factor of 10 larger than expected for a damped Giant Dipole Resonance shown by the dashed green curve, which is calculated by the standard GLO expression commonly used for describing the strength of electric dipole (E1) radiation in this energy region.
The enhancement is not observed in the inverse process of absorbing -quanta by nuclei in the ground state. Only few discrete lines are found within the interval of the first 4 MeV Pietralla99 . The enhancement in the de-excitation cascade must be related to the complex structure of the highly excited states among which the transitions occur. We plotted the reduced probabilities of all discrete transitions reported for the nuclides with depending on their transition energy. The reduced probabilities of the magnetic transitions clearly increase toward zero transition energy, whereas no such tendency is seen for reduced probabilities for the electric transitions. Based on this observation we conjectured that the enhancement seen in experiments like the one in Fig. 1 is caused by transitions between high-lying states. To study this conjecture, we carried out Shell Model calculations for the nuclides 94,95,96Mo and 90Zr, for which the enhancement has been observed in experiment.
2 Shell Model Calculations
The Shell Model calculations included the active proton orbits and the neutron orbits relative to a 68Ni core. The set of empirical matrix elements for the effective interaction and of the single particle energies are given in Refs. Schwengner14 ; sch09 . For calculating the reduced transition probabilities effective -factors of have been applied.
To make the calculations feasible truncations of the occupation numbers were applied. Up to two protons could be lifted from the orbit to the orbit. In 94,95Mo, one neutron from the orbit and one neutron from orbit may be excited to the orbit or one neutron may be lifted from the orbit to the orbit and one from the orbit to the orbit. In 90Zr, one neutron from the orbit may be excited to the orbit and one to the orbit or two neutrons from the orbit may be excited to the orbit.
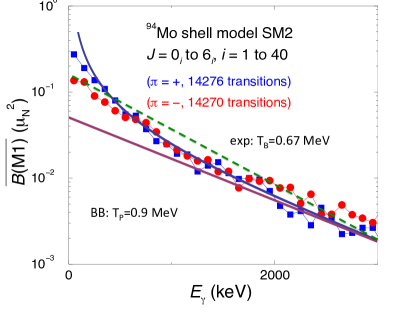
The calculations included states with spins from = 0 to 6 for 90Zr and 94Mo and from = 1/2 to 13/2 for 95Mo. For each spin the lowest 40 states were calculated. The reduced transition probabilities were calculated for all transitions from initial to final states with energies and spins . For the minimum and maximum , the cases and , respectively, were excluded. This resulted in more than 14000 transitions for each parity and , which were sorted into 100 keV bins according to their transition energy . The average value for one energy bin was obtained as the sum of all values divided by the number of transitions within this bin. The results for 94Mo are shown in Fig. 2.
Fig. 2 demonstrates that, up to 2 MeV, the LEMAR spike of is approximated by the exponential function
| (1) |
with and being constants. This is the case for all studied cases.
The exponential dependence on the transition energy is retained by the strength functions, which are defined by the relation
| (2) |
where the level density at the initial state is obtained from the Shell Model calculations. The level densities were determined by counting the calculated levels within energy intervals of 1 MeV for the two parities separately. These combinatorial level densities were used in calculating the strength functions by means of Eq. (2). As seen in Fig. 1, there is a pronounced enhancement below 2 MeV, which is well described by the exponential function
| (3) |
For 90Zr, 94Mo, 95Mo, and 96Mo, the parameters are = (34, 37, 39, 55) 10-9 MeV-3 and = (0.50, 0.50, 0.51, 0.48) MeV, respectively. The calculated M1- enhancement is consistent with the experiment, which however did not determine wether the radiation is electric or magnetic.
In the case of the Mo isotopes, the LEMAR transitions mainly originate from states between 2 and 4 MeV with a tail extending to 6 MeV. In 90Zr, the distribution starts at about 3 MeV and continues to 10 MeV. Within the studied range of , the transitions originate with about the same probability from initial states with different angular momentum.
LEMAR is generated by a huge number of weak low-energy transitions, which originate from high-lying states and add up to strong radiation. LEMAR accounts for the observed low-energy enhancement of the strength function.
3 Origin of the M1-strength
LEMAR is caused by transitions between many close-lying states of all considered spins located well above the yrast line in the transitional region to the quasi-continuum of nuclear states. Inspecting the composition of initial and final states, one finds large values for transitions between states that contain a large component (up to about 50%) of the same configuration with broken pairs of both protons and neutrons in high- orbits. The largest matrix elements connect configurations with the spins of high- protons re-coupled with respect to those of high- neutrons to the total spin . The main configurations are , , and for positive-parity states in 94Mo. Negative-parity states contain a proton lifted from the to the orbit in addition. The orbits in these configurations have large -factors with opposite signs for protons and neutrons. Combined with specific relative phases of the proton and neutron partitions they cause large total magnetic moments. The residual interaction between the valence particles and holes generates an energy difference between the states related to each other by recouping the angular momenta, which were degenerated without it. These energetic splittings enable transitions between the states by emitting an -quant. In this sense, it is the residual interaction that generates the radiation.
Magnetic Rotation (MR) fraRMP is a known example of the re-coupling mechanism generating strong low-energy magnetic transitions between near-yrast states. The configurations are rather pure, and the transition energies increase with angular momentum forming regular rotational sequences. The high-lying states that generate the LEMAR are composed of a strong mix of configurations. The complex mixing changes the residual interaction between the states. As a consequence, the distance between the states becomes randomized. Because there are several high-j orbitals involved in generating LEMAR there are other re-coupling possibilities leading to strong M1 transition than the simple type generating MR.
LEMAR consists of transitions between states related by angular momentum re-coupling of the same high-j proton and neutron configurations. Transition energies and probabilities are randomized. LEMAR is closely related to Magnetic Rotation.
4 Consequences for the astrophysical r-process
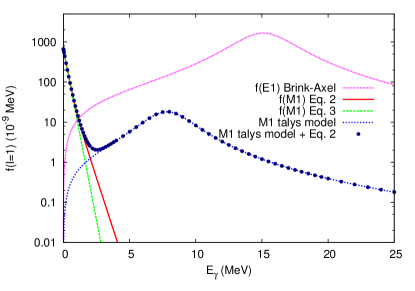
LEMAR is expected to enhance the rate for the reactions compared with standard calculations, an example of which is illustrated Fig. 3. The region with proton number below and neutron number above plays a key role in the r-process of element synthesis in violent stellar events. For this reason we studied 131Cd, which is a waiting point in the reaction chain. The Shell Model calculation was performed within the model space of the , , , proton holes and , , , , neutrons particles using a G-matrix derived from the CD-Bonn NN interaction. Fig. 3 shows that the LEMAR spike is quite similar to the ones for the stable Mo isotopes. Including LEMAR into the M1-strength function model used in the statistical model code TALYS code increases the M1 strength function by approximately five orders of magnitude at very low energy. As a result, the M1 strength function dominates the E1 for < 2 MeV. Adding LEMAR to the standard M1-strength function, a calculation by means of the TALYS increases the rate of the reaction rate by a factor of 2.5 over a wide temperature range of the stellar environment.
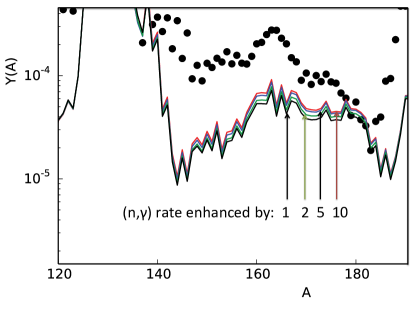
Investigations of LEMAR remain on going for additional nuclei in this and other regions that are applicable to r-process nucleosynthesis. The current limiting factor is the computational cost of Shell Model calculations. To estimate the impact of LEMAR on r-process abundance predictions we have artificially enhanced rates of nuclei in the region defined by to and to . Fig. 4 shows the results the context of a ‘cold’ r-process, where equilibrium between neutron captures and photo-dissociations is short-lived or nonexistent. After nuclei fall out of equilibrium individual neutron capture rates have the capacity to impact the predicted abundances.
The neutron capture rate enhancement from LEMAR can potentially boost final abundance predictions after the second () peak which partially fills in the deficiencies found in this sector relative to the baseline calculation where the rates remained unchanged. This abundance boost better matches the solar isotopic r-process residuals (black dots).
5 Statistical Properties of the Transitions
As the LEMAR is generated by a huge number of weak transitions between complex states, it is natural to study their statistical characteristics. The study is still on the way, and we report only tentative results obtained so far.
As illustrated by Fig. 2 the average reduced transition probabilities decrease approximately exponentially with the energy difference between initial and final states of the transitions. The decrease is determined by the parameter in Eq. (1), which scatters around 0.5 MeV for the studied nuclides. The strength functions decrease exponentially as well, with the characteristic parameter in Eq. (3) MeV. The mean value of the transition energy for the strength function is MeV.
However as seen in Fig. 2, there is a slight convex curvature, which appears systematically for all studied nuclei. The curvature is well accounted for by the modified expression
| (4) |
with and being constants. This is the case for all studied cases. Multiplying the expression by , the phase space factor of dipole photons, one obtains the spectral function of the LEMAR radiation width
| (5) |
with and being constants. The expression is recognized as Planck’s formula for Black Body radiation!
The appearance of the Black Body (BB) spectral function is new for nuclei. Familiar is a dependence on the transition energy corresponding to a Lorentzian resonance caused by a doorway state. Examples are the Giant Dipole Resonance in the strength function and the spin-flip resonance in the strength function shown in Fig. 3. The resonance energy is a combination of a characteristic particle-hole energy with the residual interaction, and the width reflects the coupling to the background of complex states. A BB spectrum appears when there is no such characteristic frequency, and the radiating constituents freely respond to the thermal activation. Examples are the free electrons in metals or the electrons and protons in the solar plasma. The spectra of hot metals and of the sun are almost perfectly BB. In the case of LEMAR, the mutual reorientation of the high-j orbitals in the spherical mean field does not cost energy, the residual interaction acts in a random way as a thermal activation, and a BB spectrum is the result. Fig. 5 substantiates the point. It shows a a Shell Model calculation with all interaction matrix elements multiplied by a factor of 0.5. Clearly, the distribution is well approximated by the BB formula (4) with half the temperature of the calculation with the full interaction strength shown in Fig. 2. The residual interaction plays the role of a thermal agitation of the spins of the high-j orbitals, and the interaction strength sets the agitation scale, which is the temperature.
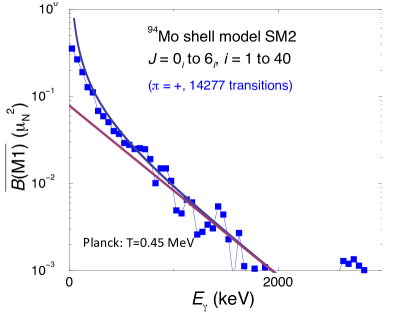
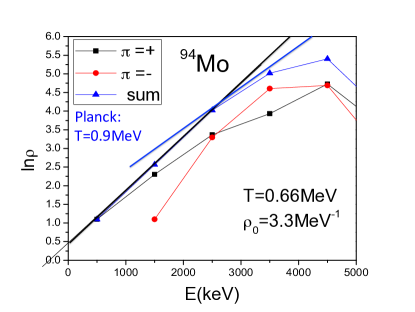
Fig. 6 shows that the total level density is well reproduced by the constant-temperature (CT) expression
| (6) |
with MeV as long as 2.5 MeV. The experimental level density, as published in the RIPL3 data base RIPL3 , is very well described by the CT expression (6) with MeV up to MeV, where the experimental level scheme becomes incomplete. The Shell Model rather well reproduces the CT level density up to MeV. For higher energies the combinatorial level density deviates from the CT expression (6) and eventually decreases with excitation energy. Obviously, this due to progressively missing configurations the present Shell Model space when increases beyond 2.5 MeV.
The value MeV of the constant temperature part of the combinatorial level density ( MeV) is smaller than the value =0.9 MeV obtained from the BB distribution of the . The difference may be explained by the fact that most of the transitions originate from states with MeV where the entropy deviates from the straight line due to missing configurations in the calculation. The micro canonical temperature increases with in this region, and the higher value of arises as some average over the region. Accordingly, the value of corresponds to the slope of near MeV. Thus, the difference between and seems to be an artifact of Shell Model calculation. 94Mo is representative for the remaining nuclei studied. In the light of these findings we conjecture that , i. e. that LEMAR is thermal radiation with a temperature that is equal to the micro canonical temperature of the level density. The experimental level densities are known to be very well accounted for by the CT expression (6) up to the neutron binding energies RIPL3 . Thus one expects that the temperature is constant over the range of excitation energies from which LEMAR is emitted. The experimental value for 94Mo, MeV, should determine the spectral function of LEMAR in this nucleus. If LEMAR spectrum could be sufficiently accurately measured, it could serve as a new thermometer of the nuclear temperature.
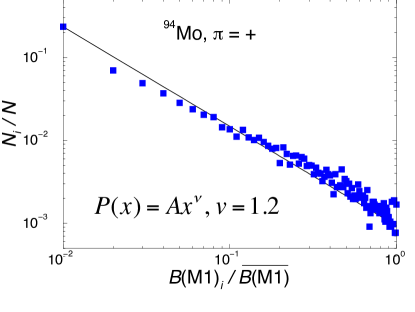
The size distribution of the values is shown in Fig. 7, where, is the mean value over the complete distribution. It follows the power law
| (7) |
with . The distributions for both parities in all three nuclides follow a power law with the exponents scattering around 1.2.
The fact that the LEMAR distributions can be described by a simple power law is remarkable. Based on Shell Model ham02 and experimental shr00 studies of - transitions between complex excited states one rather would expect a Porter-Thomas-like distribution. Power-law distributions are characteristic for scale-free systems, as for example the distribution of the number of clicks/site in the internet (Any site can connect with any number of other sites.) or the heat capacity near a second order phase transition (There is no scale for the fluctuations of the order parameter.). LEMAR may be classified as scale-free as follows. The various configurations that are related by re-coupling of the angular momentum have all the same energy. The energy difference between the mixed states is generated by the residual interaction, which acts in a random way between the complex states. This differs from the conventional situation, where the single particle level spacing represents an energy scale for the various configurations mixed by the residual interaction.
Statistical self-similarity is another signature of scale-free systems. It means that the statistical characteristics of the system are the same when studied on different scales (The length of coast lines is a popular example.). LEMAR exhibits statistical self-similarity. Fig. 5 shows the values calculated by multiplying residual interaction by a factor of 0.5 (i. e. changing the scale). Comparing with the results for the full interaction in Fig. LABEL:fig:BM1logMo94full , it is seen that the distribution remains BB, where the characteristic parameter MeV is one half of MeV of the full calculation. Remarkably, the condition for the appearance of the thermal black-body spectrum (no characteristic frequency) agrees with the prerequisite for a power-law distribution (scale-freeness).
LEMAR is thermal radiation. Its spectral function follows Planck’s Law with a temperature . The value of seems to agrees with the micro canonical temperature of combinatorial level density. The size distribution of the reduced transition probabilities is a power law with an exponent of . Both Planck’s Law and the power law seem to originate from the absence of an energy scale for the LEMAR transitions.
Acknowledgement: Supported by the Grant No. DE-FG02-95ER4093 of the US Department of Energy.
References
- (1) R. Schwengner, S. Frauendorf,A. C. Larsen, Phys. Rev. Lett. 111, 232504 (2013)
- (2) S. Frauendorf, R. Schwengner and K. Wimmer, AIP Conf. Proc. 1619, 81 (2014); http://dx.doi.org/10.1063/1.4899221; arXiv:1407.1721v1
- (3) M. Guttormsen et al., Phys. Rev. C 71, 044307 (2005).
- (4) N. Pietralla et al., Phys. Rev. Lett. 83, 1303 (1999).
- (5) http://www.nndc.bnl.gov/nudat2/
- (6) R. Schwengner et al., Phys. Rev. C 80, 044305 (2009).
- (7) S. Frauendorf, Rev. Mod. Phys. 73, 463 (2001).
- (8) R. Surman et al., Phys. Rev. C 79 045809 (2009).
- (9) C. Arlandini et al., ApJ, 525,886 (1999).
- (10) https://www-nds.iaea.org/cgi-bin/ripl_density_plot.pl?Z=42&A=94
- (11) A. Hamoudi et al., Phys. Rev. C 65, 064311 (2002).
- (12) J. F. Shriner et al., Phys. Rev. C 62, 054305 (2002)