Intrinsic Image Popularity Assessment
Abstract.
The goal of research in automatic image popularity assessment (IPA) is to develop computational models that can accurately predict the potential of a social image to go viral on the Internet. Here, we aim to single out the contribution of visual content to image popularity, i.e., intrinsic image popularity. Specifically, we first describe a probabilistic method to generate massive popularity-discriminable image pairs, based on which the first large-scale image database for intrinsic IPA (I2PA) is established. We then develop computational models for I2PA based on deep neural networks, optimizing for ranking consistency with millions of popularity-discriminable image pairs. Experiments on Instagram and other social platforms demonstrate that the optimized model performs favorably against existing methods, exhibits reasonable generalizability on different databases, and even surpasses human-level performance on Instagram. In addition, we conduct a psychophysical experiment to analyze various aspects of human behavior in I2PA.
1. Introduction
Recent years have witnessed an accelerated proliferation of images and videos being uploaded to various social platforms such as Instagram111https://www.instagram.com, Flickr222https://www.flickr.com, and Reddit333https://www.reddit.com. Some photos turn to be extremely popular, which gain millions of likes and comments, while some are completely ignored. Even for images uploaded by the same user at the same time, their popularity may be substantially different. This interesting phenomenon motivates us to ask what the secret of image popularity is. It is generally believed that image popularity is determined by a combination of factors, including the visual content, the user statistics, the upload time, and the caption (Pinto et al., 2013; Gelli et al., 2015; Khosla et al., 2014; McParlane et al., 2014).
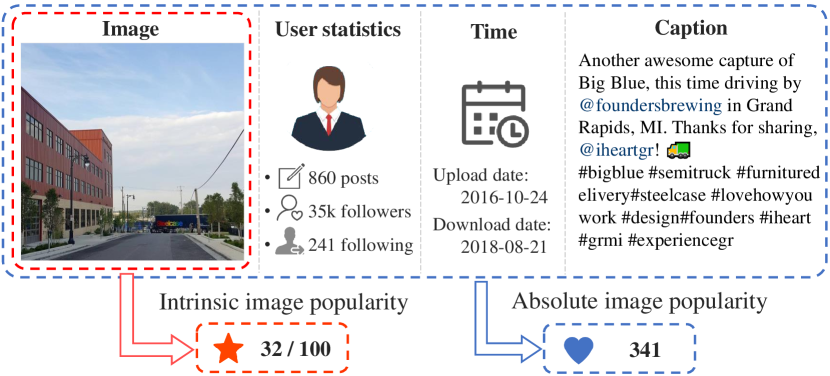
Computational models for absolute image popularity assessment (IPA) attempt to predict the number of received likes/comments of an image by combining all visual and non-visual factors (Khosla et al., 2014; McParlane et al., 2014). Here we aim to single out the contribution of visual content to image popularity, namely intrinsic image popularity, and develop computational models for intrinsic IPA (I2PA) for several reasons. First, by focusing on the visual content, I2PA is a cleaner and easier-to-interpret problem than absolute IPA (see Fig. 1). Second, computational models for I2PA guide the identification of potentially popular images with no social and textual contexts, and hold much promise in optimizing social image management and recommendation systems in the long run. For example, more computation and storage resources may be allocated to images with high intrinsic popularity. Third, from the users’ perspective, I2PA model predictions are ideal indicators of which images in their personal albums are worth uploading to gain great attention, when they just join the social network and have no social interactions. Moreover, the users may gain inspiration regarding how to filter and prioritize photos assisted by the model instead of their own biased opinions. Last, analyzing how image attributes such as image quality, aesthetics, contexts, and semantics contribute to intrinsic image popularity is by itself an interesting problem for human and computer vision study (see Sections 4.2 and 4.3).
In this paper, we conduct a systematic study of I2PA based on Instagram, a leading photo-sharing social network with over one billion monthly active users on the web and mobile clients (Constine, 2018). We first develop a probabilistic method to construct a new form of data - popularity-discriminable image pairs (PDIPs), which contain rich information about intrinsic image popularity by reducing the influence of non-visual factors. We show that such PDIPs can be generated at very low cost and high accuracy, leading to the first large-scale image database for I2PA. We then train deep neural networks (DNNs) to predict intrinsic image popularity by learning-to-rank (Burges et al., 2005; Chopra et al., 2005; Joachims, 2002) millions of PDIPs in the proposed database. Experimental results on Instagram and several other social platforms show that our model predicts intrinsic image popularity accurately, outperforms state-of-the-art methods (e.g., the commercialized products Virality Detection (ParallelDots, 2018) and LikelyAI (LikelyAI, 2017)), and generalizes reasonably. Moreover, we conduct a psychophysical experiment to collect human opinions on intrinsic image popularity, and find that our method slightly surpasses the human-level performance on Instagram.
Our contributions are four-fold. First, we revisit the concept of intrinsic image popularity with a new problem formulation. Second, we construct the first large-scale image database for I2PA, consisting of more than two million PDIPs with reliable annotations. Third, we develop a computational model for I2PA based on a DNN, which delivers human-level performance. Fourth, we conduct a psychophysical experiment to analyze various aspects of human behavior in I2PA.
2. Related Work
Popularity assessment of social media content (e.g., texts, photos, and videos) has been an active research field in the past decade. Traditional computer vision and natural language processing methods focused on handcrafting image and text features (Damashek, 1995; Lowe, 2004), which requires extensive human expertise. Recently, there has been a roaring wave of developing DNNs that emphasize automatic hierarchical feature learning for IPA (Hsu et al., 2017; Trzciński and Rokita, 2017; LikelyAI, 2017; ParallelDots, 2018).
Most studies investigate image popularity based on the professional photo-sharing site Flickr. McParlane et al. (McParlane et al., 2014) predicted image popularity (i.e., the number of comments and views) using image and user contexts. Khosla et al. (Khosla et al., 2014) predicted the normalized view counts, and analyzed the impact of low-level features (color patch variance, gradient, and texture), middle-level features (GIST (Oliva and Torralba, 2001)) and high-level features (semantics) on the prediction accuracy. Gelli et al. (Gelli et al., 2015) conducted a qualitative analysis regarding which visual factors may influence image popularity. Wu et al. (Wu et al., 2016a, 2017, b) incorporated multiple time-scale dynamics in predicting image popularity. Zhang et al. (Zhang et al., 2018b) proposed a user-guided hierarchical attention network for multi-modal content popularity prediction.
There are also several studies of IPA using other social networks. Mazloom et al. (Mazloom et al., 2016) predicted the popularity of brand-related posts on Instagram, and later extended their method to account for category specific posts (Mazloom et al., 2018). Zhang et al. (Zhang et al., 2018a) addressed user-specific popularity prediction on Instagram with a dual-attention mechanism. Deza and Parikh (Deza and Parikh, 2015) cast IPA as a classification problem based on images collected from Reddit, a popular website composed of many interest-centric sub-communities. Hessel et al. (Hessel et al., 2017) compared multi-modal content with social contexts in predicting relative popularity on Reddit. They found that visual and textual features tend to outperform user statistics.
Due to its commercial value, many companies have developed computational models for IPA. LikelyAI (LikelyAI, 2017) is such a product that assesses the popularity of Instagram posts. Trained on millions of images, LikelyAI is claimed to recognize popular patterns on Instagram. Virality Detection (ParallelDots, 2018) is a similar tool to score images based on their potentials to become popular on social media. Virality Detection is trained on a massive corpus of web images, and achieves high accuracy on the AVA dataset (Murray et al., 2012), suggesting close agreement between image aesthetics and image popularity.
Most of the above-mentioned methods try to predict absolute image popularity by combining various visual and non-visual features. In contrast, I2PA receives little attention despite broad practical applications. The closest studies to ours are due to Cappallo et al. (Cappallo et al., 2015), and Dubey and Agarwal (Dubey and Agarwal, 2017). Cappallo et al. learned a visual popularity predictor from both popular and unpopular images on Flickr using RankSVM (Joachims, 2002). However, their training pair generation process does not exclude the impact of non-visual factors such as user statistics and textual information. Moreover, their model is not end-to-end optimized, and may result in suboptimal performance. Dubey and Agarwal (Dubey and Agarwal, 2017) modeled image popularity with pairwise spatial transformer networks, whose training pairs suffer from similar problems (Cappallo et al., 2015). In addition, the image content based on Reddit (Deza and Parikh, 2015) is not diverse enough, and may hinder the generalizability of the learned networks.
3. Method
In this section, we first describe the probabilistic method for PDIP generation and ways to reduce the impact of non-visual factors. Based on the method, we build the first large-scale image database for I2PA. Last, we describe the specification and learning of our DNN-based computational model for I2PA.
3.1. PDIP generation and database construction
At the beginning, we crawl more than one million active users on Instagram using the snowball sampling (Biernacki and Waldorf, 1981) through the chain of followers. To decorrelate the sampled users, we randomly remove of them, and collect the information of each post of the remaining users, including the download time, the post URL, the user ID, the content type, the upload time, the caption (including emojis, hashtags, and @ signs), the number of likes, and the number of comments. As a result, we obtain over million distinctive posts as the candidates to build our database. Note that all data are collected via HTTP requests for research purpose only.
We present in detail the probabilistic method for PDIP generation. In agreement with (Almgren et al., 2016; Mazloom et al., 2018; Mazloom et al., 2016), the log-scaled number of likes is considered as the ground truth for absolute image popularity, based on which we make two mild assumptions.
-
•
obeys a normal distribution (assuming the Thurstone’s model (Thurstone, 1927))
(1) with mean and standard deviation (std) . Here is a random variable, which can be viewed as the average number of likes received by an image in the log scale, if the image were uploaded and rated multiple times. Without any prior knowledge, we assume is flat with a finite positive support. To simplify the derivation, we treat as a positive constant to be determined.
-
•
The intrinsic image popularity is a monotonically increasing function of .
Using the Bayes’ theorem, we have
| (2) |
where the second proportion follows from the assumption that is flat. That is, conditioning on , is Gaussian with mean and std .
| Attribute | Value |
|---|---|
| Number of PDIPs | |
| Number of users involved | |
| Average likes per image | |
| Average | |
| Average upload time interval | days |
| Proportion of no hashtag | |
| Proportion of no @ sign | |
| Proportion of no caption | |
| Average length of descriptive text | words |
To ensure that Image is intrinsically more popular than Image in a PDIP, we compute the probability
| (3) | ||||
| (4) |
where Eq. (3) follows from the assumption that is a monotonically increasing function of . Assuming the variability of intrinsic popularity across images is uncorrelated, and conditioning on and , the difference is also Gaussian
| (5) |
Combining Eq. (3) with Eq. (5), we have
| (6) |
where is the standard normal cumulative distribution function. indicates the probability that Image A is intrinsically more popular than Image B. In practice, we choose a large threshold to ensure the popularity discriminability of PDIPs.
Enumerating all possible pairs that only satisfy the probability constraint is not enough, as image popularity may be affected by other non-visual factors. Therefore, it is desirable to further constrain the two images in a pair to have similar textual and social contexts. According to the mechanism of Instagram, we consider three major non-visual factors.
-
•
User statistics. Several studies have showed that the popularity of an image is highly correlated with the user who uploads it (Can et al., 2013; Gelli et al., 2015; Yamaguchi et al., 2014). The most obvious reason is that different users have different numbers of followers. Images posted by the users with more followers have higher chances of receiving more likes. The number of active followers and their preferences make the relationship more complicated. Considering the above issues, we restrict images from the same user for PDIP generation.
-
•
Upload time. A user often has a different number of followers at different times. To reduce this effect, the post time difference of the two images in a PDIP is set to a maximum of ten days. In addition, it is helpful to exclude images just uploaded to the social network as the number of likes has not reached a stable state. According to the analysis in (Almgren et al., 2016), the number of likes for most images stops to increase after four weeks. As such, we exclude images posted within one month. In addition, the upload time in a day may also affect image popularity. Failing to model this issue may result in minor label noise. However, as will be clear in Section 4.2, our learning process is quite robust to label noise in PDIPs.
-
•
Caption. Image captions have a noticeable impact on image popularity, especially those containing hashtags and @ signs. A hot hashtag contributes significantly to image popularity because of the extensive exposure to viewers beyond followers. Generally the more hashtags of a post, the greater chances of receiving more likes. @ signs may also affect image popularity. For example, images @ a celebrity would probably receive more likes than those @ an ordinary user or without the @ sign. To remove the textual bias, we restrict the hashtag and @ sign of the images in a PDIP to be the same (in both content and number). Moreover, the length of the caption (excluding the hashtag and @ sign) is restricted to a maximum of six words.
We summarize the four constraints of images for PDIP generation as follows:
-
•
;
-
•
from the same user;
-
•
posted more than one month and within ten days;
-
•
caption with a maximum of six words and the same hashtag/@ sign.
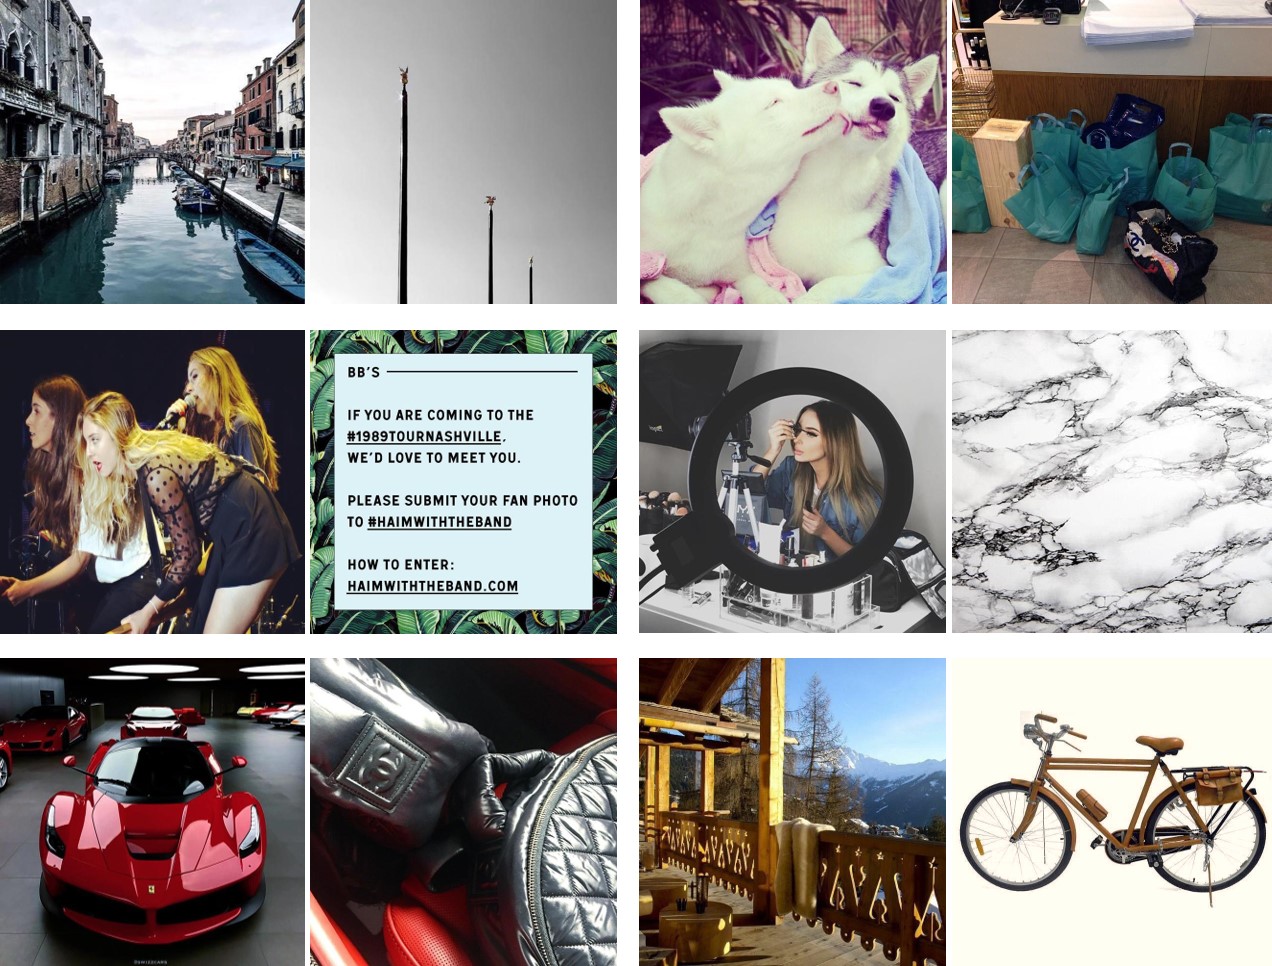
An Instagram post may contain multiple images, videos, or a mixture of them. Here we only consider single image posts because it is difficult to allocate the number of likes across multiple images in a post. In addition, we exclude images with less than likes to reduce the boundary effect. From more than million candidate images on Instagram, we construct the first large-scale database for I2PA, which contains approximately million of PDIPs, satisfying all of the above constraints. To ensure the content diversity, one image only participates in one PDIP. Table 1 summarizes the statistics of the proposed database, and Fig. 2 shows six sample PDIPs.
3.2. DNN-based computational models for I2PA
In this subsection, we describe a DNN-based computational model for I2PA by learning-to-rank millions of PDIPs. As a machine learning technique, learning-to-rank was extensively studied in the context of information retrieval (Liu, 2009), and later found its way to computer vision (Chopra et al., 2005), image processing (Ma et al., 2017), and natural language processing (Li, 2011). Pairwise learning-to-rank approaches assume that the relative order between two instances is known (or can be inferred), and aim to minimize the average number of incorrectly ordered pairs. The PDIPs in our database fit the pairwise learning-to-rank scheme naturally, and we use them to drive the learning of a Siamese architecture for I2PA (see Fig. 3).
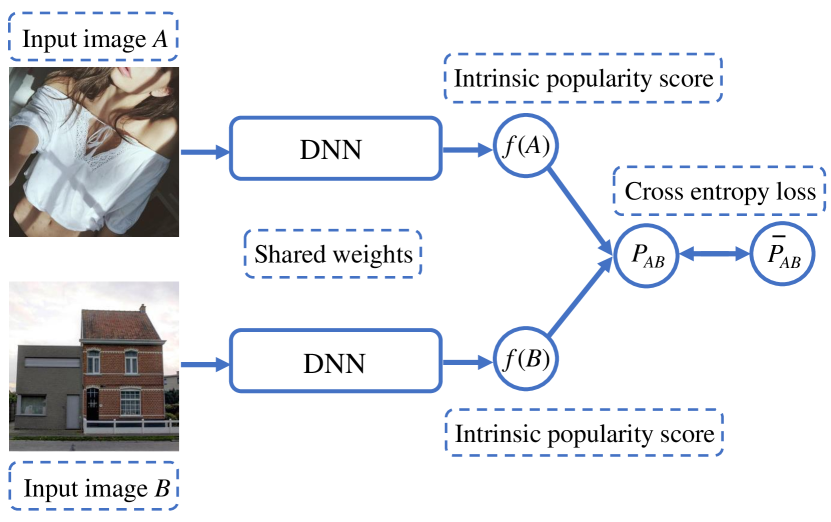
The input of a PDIP to the first stream is an RGB image, and the output is the predicted intrinsic popularity score . Similarly, the second stream inputs the other image and predicts . The network architectures of the two streams are the same, whose weights are shared during training and testing. We compute the predicted score difference , and convert it to a probability using a logistic function
| (7) |
Denote the ground-truth binary label of a PDIP as , where indicates Image is intrinsically more popular than Image and otherwise . We adopt the binary cross entropy as the loss function
| (8) | ||||
| (9) |
After training, the optimal predictor (either stream in the Siamese architecture) is learned. Given a test image , we perform a standard forward pass to obtain the predicted intrinsic popularity score
| (10) |
4. Experiments
In this section, we first describe the implementation details, including the default DNN architecture and the training procedure. We then quantitatively compare our model with the state-of-the-art. We also conduct qualitative analysis of our model, and have a number of interesting observations. Last, we perform a psychophysical experiment to analyze human behavior in this task.
4.1. Implementation details
We adopt ResNet-50 (He et al., 2016) as our default DNN architecture, and replace the last layer with a fully connected layer of one output, representing the predicted intrinsic popularity score. The initial weights are inherited from models pre-trained for object recognition on ImageNet (Deng et al., 2009), expect for the last layer that is initialized by the method of He et al. (He et al., 2015). The two parameters and that govern the reliability of PDIP generation are set to and , respectively. During both training and testing, the short side of the input image is rescaled to , from which a sub-image is randomly cropped. The training is carried out by optimizing the cross entropy function using Adam (Kingma and Ba, 2014) with an penalty multiplier of and a batch size of . The learning rates for the pre-trained DNN layers and the last layer are set to and , respectively. After each epoch, we decay the learning rates linearly by a factor of . Training takes approximately one day on an Intel E5-2699 2.2GHz CPU and an NVIDIA Tesla V100 GPU. Our model takes ms and ms to process an image of size on CPU and GPU, respectively. To facilitate research in I2PA, we make the PyTorch implementation of our model and the large-scale image database publicly available at https://github.com/dingkeyan93/intrinsic-image-popularity.
4.2. Quantitative evaluation
Main results on Instagram. We adopt pairwise accuracy as the quantitative measure, which is defined as the percentage of correctly ranked pairs. From the million of PDIPs in the proposed database, we randomly choose pairs for validation, pairs for testing, and leave the rest for training. The weights that achieve the highest pairwise accuracy on the validation set are used for testing.
As a relatively new problem, it is difficult to find computational models specifically for I2PA in the literature. We try our best to compare our model with four most relevant and state-of-the-art methods, whose implementations are publicly available for testing only. These are Khosla14 (Khosla et al., 2014), Hessel17 (Hessel et al., 2017), Virality Detection (ParallelDots, 2018), and LikelyAI (LikelyAI, 2017). Khosla14 makes one of the first attempts to predict absolute image popularity. It also provides an API to assess intrinsic image popularity. Hessel17 is a multi-modal content popularity predictor based on Reddit. Six category-specific models are trained, and the one (for the pics category) that achieves the highest pairwise accuracy on our test set is used for comparison. Virality Detection and LikelyAI are two commercialized products, aiming to predict image popularity in a variety of practical scenarios (with or without social and textual contexts).
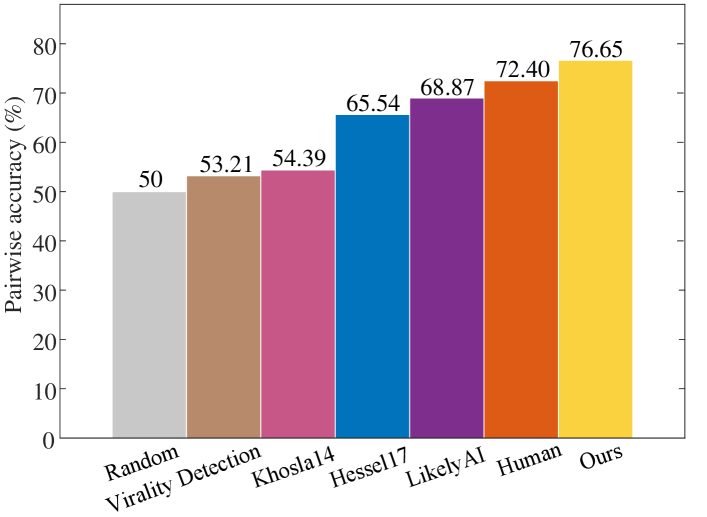
Fig. 4 shows the results, where we see that our model achieves the best performance with a pairwise accuracy of . Khosla14 and Virality Detection marginally outperform the random guess baseline, which may be due to the distribution mismatch between training (Flickr) and testing (Instagram) images. Specifically, Instagram is a community conductive to self-expression, while Flickr focuses more on photographs of high visual quality and aesthetics. Hessel17 suffers from the similar issue, whose training data are crawled from Reddit rather than Instagram. Trained on Instagram images, LikelyAI performs slightly better than Hessel17, but is inferior to our model by a large margin. We believe this performance improvement arises because the PDIPs used for training contain reliable information about intrinsic image popularity, and our end-to-end optimized model is able to capture the features and attributes of images that are highly relevant to intrinsic image popularity. Our results also suggest that a fine-grained treatment of I2PA based on different social platforms may be needed to combat data distribution mismatch.
Generalizability on Reddit and Flickr. To probe the generalizability of our model trained on Instagram, we test it on two other social platforms - Reddit and Flickr. The Reddit database (Hessel et al., 2017) contains over pairs of popular and unpopular images categorized by six sub-datasets. We choose the largest sub-dataset pics due to its diverse content variations. Our model achieves a pairwise accuracy of (on pairs), and is slightly worse than Hessel17 (Hessel et al., 2017) (), which is trained on the same Reddit database.
Next, we test our model on images from Flickr. Due to the lack of intrinsic image popularity databases on Flickr, we decide to build a small one for testing. Specifically, we choose the social media headline prediction challenge database (Wu et al., 2017) as the starting point. The database contains over posts from over users. For simplicity, we select the most popular images and the most unpopular images according to the normalized number of views, and pair them randomly. When considering the visual content only, our model achieves a pairwise accuracy of , and is slightly better than of Khosla14 (Khosla et al., 2014), which is trained on the same Flickr database.
As previously discussed, the performance drop of our Instagram-based model on Reddit and Flickr may be because the dataset distributions are different. In addition, without reducing the effect of non-visual factors, the test image pairs are much noisier.
| Noise | |||||
|---|---|---|---|---|---|
| Accuracy (%) |
| DNN | AlexNet | VGGNet | ResNet-50 | ResNet-101 |
|---|---|---|---|---|
| Accuracy (%) |

Ablation study. We provide a baseline for our model - a DNN trained for absolute IPA and used to assess intrinsic image popularity. Specifically, we first summarize the visual content by a scalar using the same ResNet-50 (He et al., 2016), and combine the image-based score with six non-visual features: the number of followers, followings, posts, hashtags, @ signs, and the length of caption. The seven-dimensional feature vector is fed to a fully connected neural network with a ---- structure to predict the number of likes. We train the entire model end-to-end on million images used to generate training PDIPs. We adopt the mean squared error (MSE) as the loss function. The training procedure is the same as in Section 4.1. The optimized model predicts absolute image popularity reasonably, as evidenced by a Pearson correlation of on the training set and on the test set, respectively. However, when tested on the PDIPs, this baseline model only achieves a pairwise accuracy of . The performance drop may be because strong features (e.g., the number of followers) tend to dominate the learning, leaving less room for exploiting the visual content.
We analyze the impact of and in PDIP generation on the final performance. However, due to the limited computation and storage resources, we perform a similar but simulated label noise experiment. In particular, we select a percentage to randomly flip the binary labels of PDIPs in the training set and retrain the models, whose test results are listed in Table 2. It is clear that the training is robust to label noise. When the label noise level is , our model is still competitive with humans. Although it seems impossible to eliminate the impact of non-visual factors in our current PDIP generation process, our experiment suggests that the induced label noise does not seem to hinder the learning of a robust model for I2PA. In addition, we may relax the constraints of PDIP generation (i.e., decrease or increase ) to obtain pairs with more diverse content.
| Accuracy (%) | Majority | Single | Female | Male | ||||
|---|---|---|---|---|---|---|---|---|
| Mean | ||||||||
| Std | — |
We also investigate the impact of different DNN architectures on pairwise accuracy, including AlexNet (Krizhevsky et al., 2012), VGGNet (Simonyan and Zisserman, 2014), ResNet-50 (He et al., 2016) (default), and ResNet-101 (He et al., 2016). From the results in Table 3, we find that there is still room for improvement on top of ResNet-50 if deeper and more advanced networks are adopted.
4.3. Qualitative analysis
We provide qualitative analysis of I2PA from three perspectives: global image content (Fig. 6), local image content (Fig. 7), and comparison with human data (Fig. 9). It should be noted that these results would become less obvious if we predict absolute image popularity and do not single out the contribution of image content.
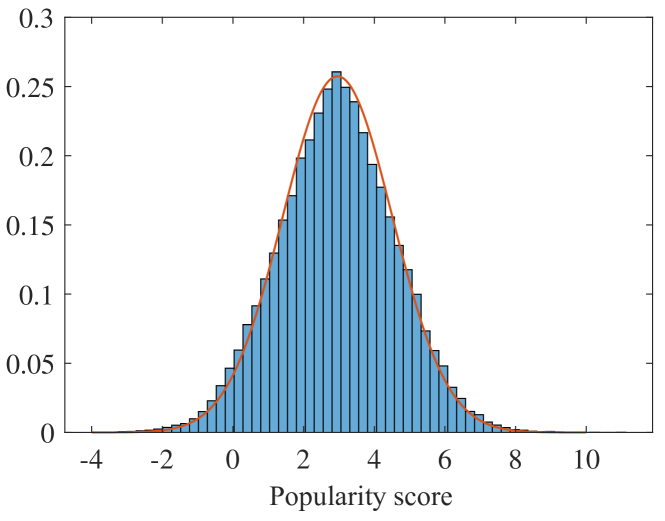
We first exam the histogram of predicted intrinsic popularity scores by our model on the test set, which provides a good coverage of representative Instagram images. The histogram can be well fitted by a Gaussian distribution with mean and std . A higher value indicates better intrinsic popularity (see Fig. 5).
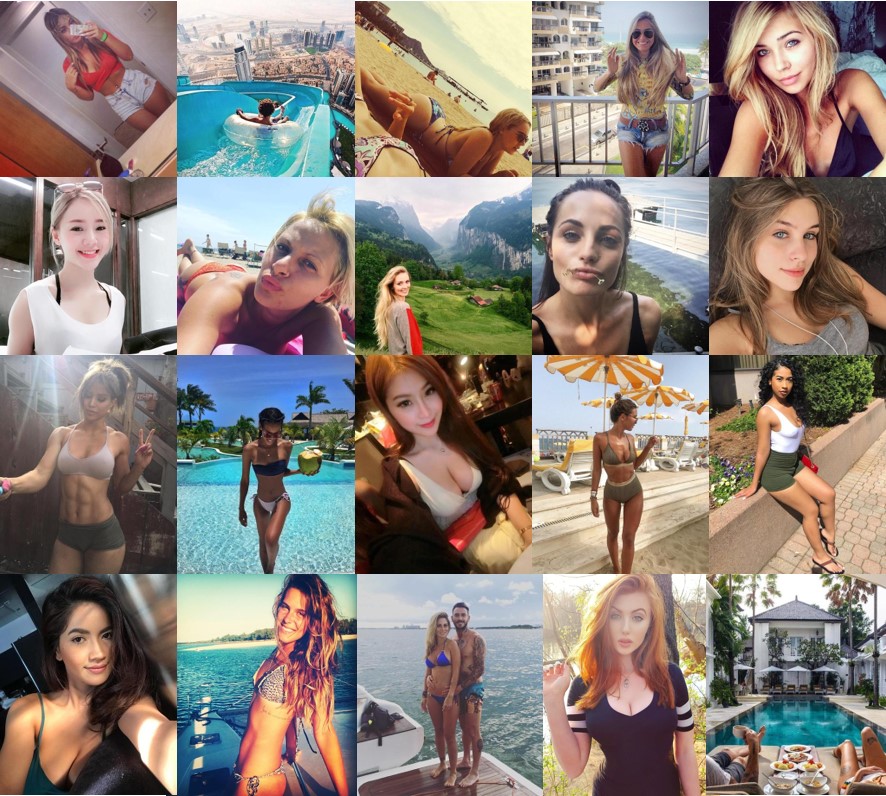
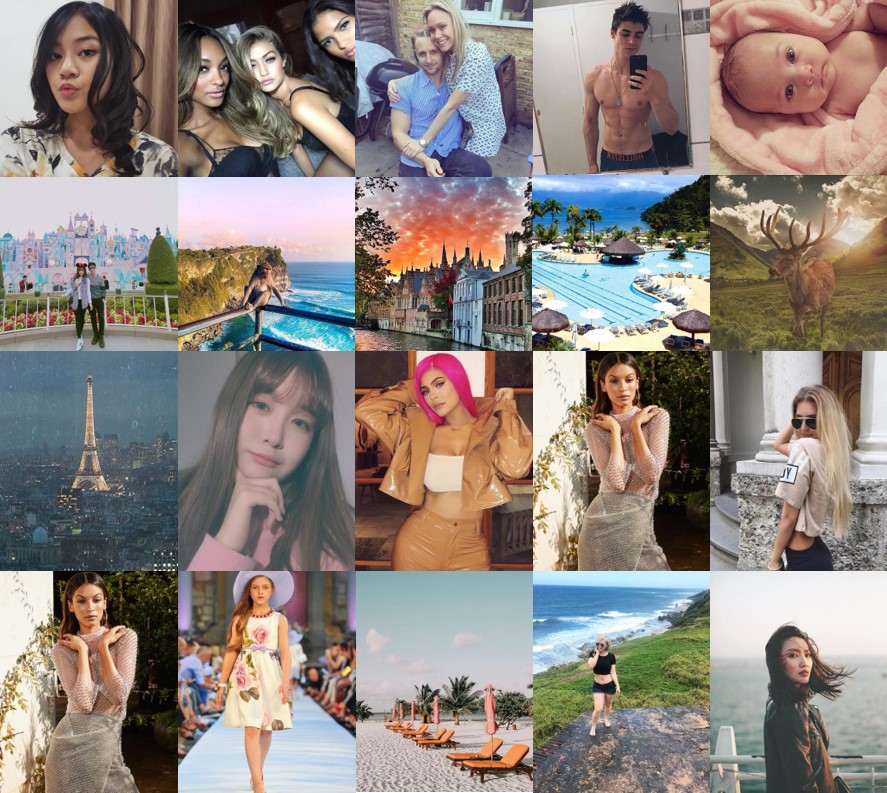
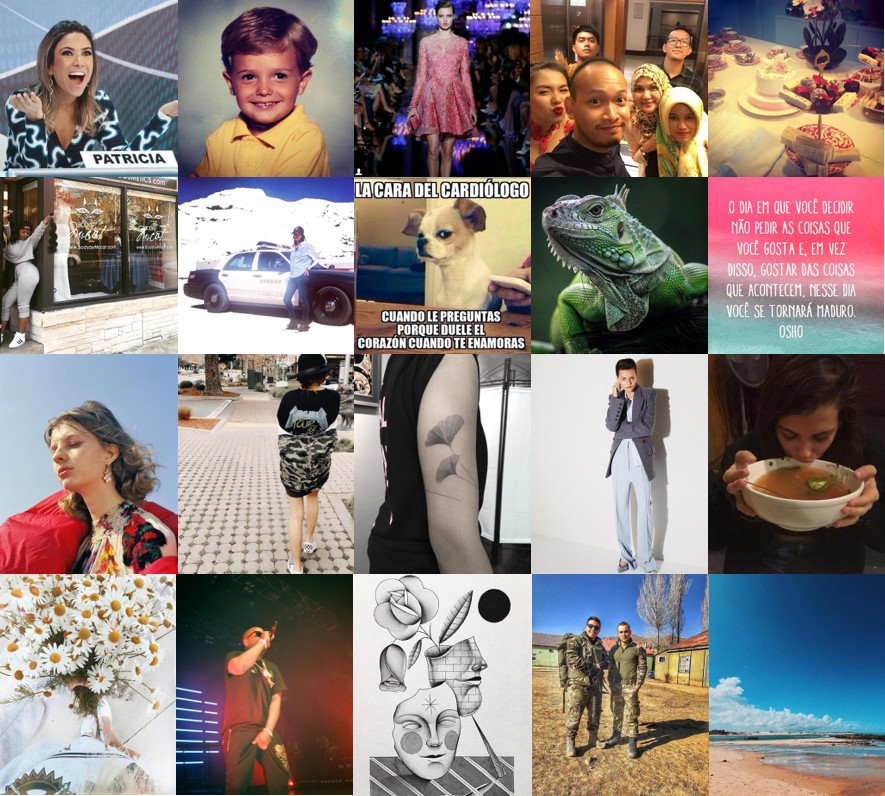
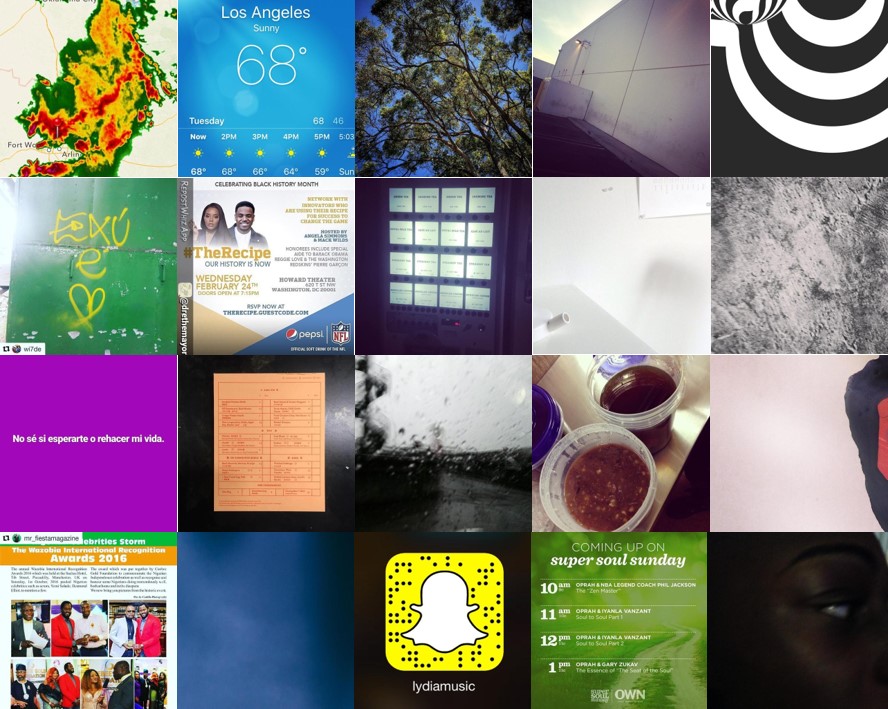
To better analyze how global image content affects I2PA, we define five popularity levels - “excellent”, “good”, “fair”, “bad”, and “poor” that evenly cover the predicted score range. Fig. 6 shows representative images of each level. We find that images in the excellent level are often beautiful and attractive people, which is in close agreement with Park and Lee’s conclusion (Park and Lee, 2017). Images in the good level tend to be brilliant selfies and spectacular sceneries. The high-score selfies are often accompanied by beautiful faces, which is consistent with the result that photos with faces are more likely to receive likes (Bakhshi et al., 2014). Images in the fair level look ordinary and forgettable, whose common characteristics are difficult to summarize because of the content diversity. Images in the bad level are less prominent, and may lack interesting and distinguishable features. Images in the poor level mainly consist of empty backgrounds with few salient objects.
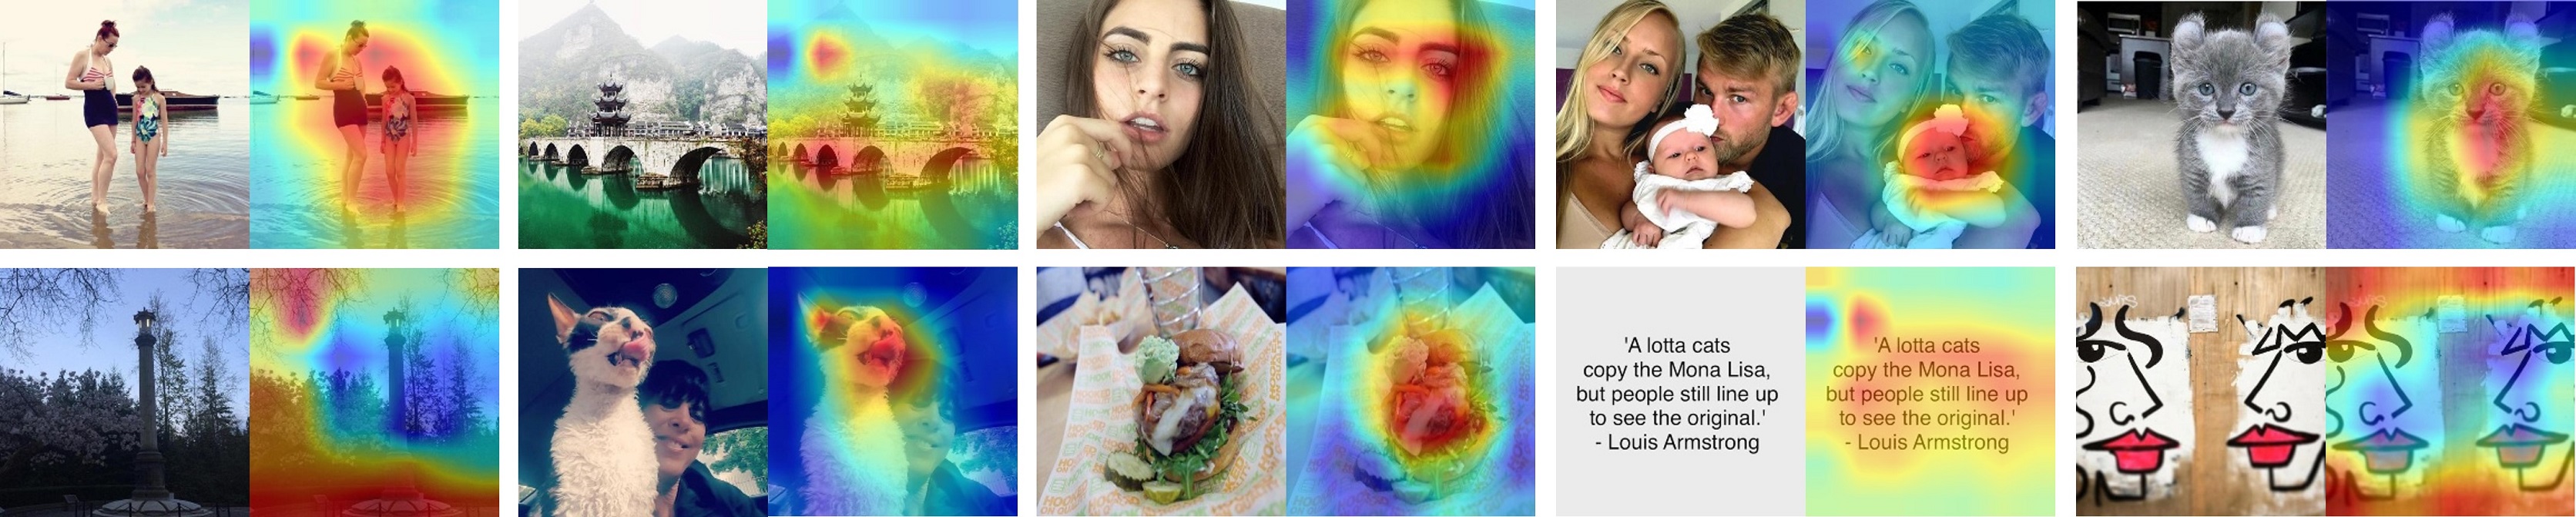
We also investigate how local image content contributes to I2PA. Specifically, we generate the heatmaps of sample images by Grad-CAM (Selvaraju et al., 2017; Bielski and Trzcinski, 2018), a visual explanation for deep networks via gradient-based localization. A warmer region in the heatmap indicates that it plays a more important role in I2PA. From the first row of Fig. 7, we find that several elements such as fine architectures (the second image), pretty faces (the third image), lovely kids (the fourth image), and cute animals (the fifth image) are often activated, leading to high popularity predictions. By contrast, for images in the second row, poor quality regions (the first image), unsightly expressions (the second image), textual descriptions (the fourth image), and empty backgrounds (the fifth image) tend to dominate, leading to low popularity predictions.
4.4. Psychophysical experiment
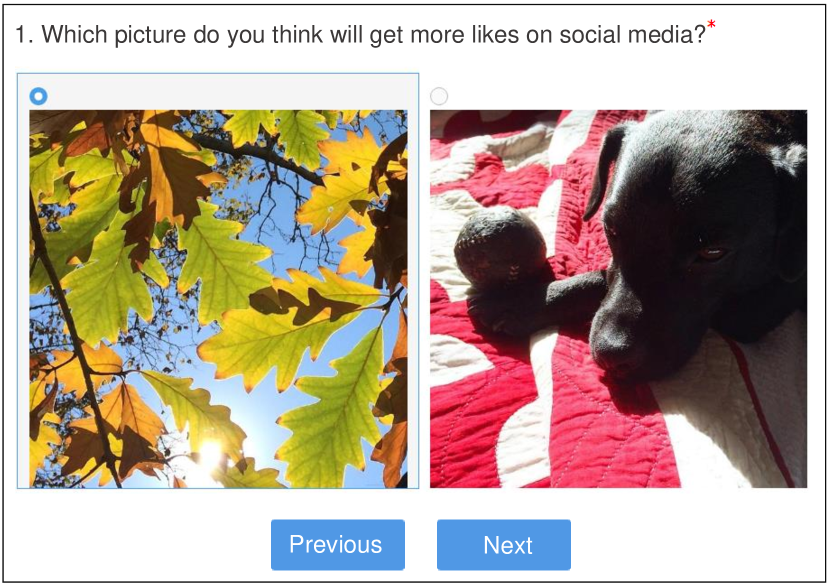
To understand human behavior in I2PA and to make the results more interpretable, we conduct a psychophysical experiment. Specifically, we randomly select PDIPs from the test set, and invite subjects to perform a two-alternative forced choice (2AFC) using a web-based platform (see Fig. 8). The subjects ( females and males) are all college students of age to , among whom have used Instagram before. Besides, subjects spend more than three hours on various social platforms every day. At the beginning of the experiment, eight training pairs are displayed to help the subjects build the concept of intrinsic image popularity. After that, they are free to make decisions based on their own understanding of image popularity. To reduce the fatigue effect, the experiment is divided into four sessions, each of which is limited to a maximum of minutes. The subjects are encouraged to participant in multiple sessions. In the end, the subjects are allowed to review and compare their choices with the ground truths.
Table 4 lists the subjective results, where we see that the majority vote strategy significantly outperforms individual subjects, reflecting the difficulty of this task for a single observer. We next analyze the influence of the gender, the Instagram experience, and the online social time per day on I2PA. From table 4, we find that 1) both male and female subjects tend to perform at a similar level; 2) subjects with Instagram experience (denoted by ) perform statistically better (based on t-statistics (Montgomery and Runger, 2013)) than those with little knowledge about Instagram (denoted by ); 3) subjects who spend more than three hours on social media per day (denoted by ) perform statistically better than those with less online social experience (denoted by ).
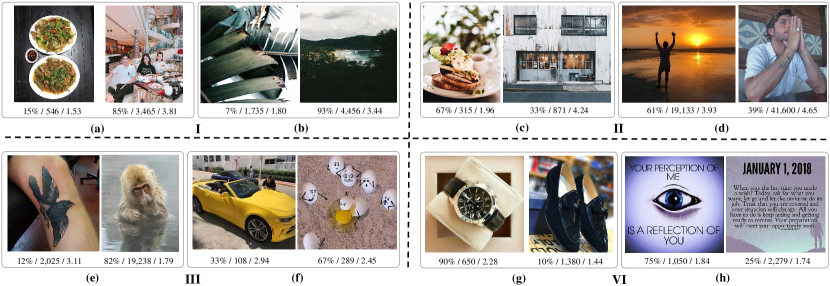
We further compare the subjects’ choices against our model predictions and the ground truths using four types of pairs, as shown in Fig. 9. Pairs (a) and (b) in Part I have clear popularity discriminability based on different visual appearances, leading to easy predictions for both subjects and our model. Most PDIPs in the proposed database belong to this category.
For the pair (c) in Part II, of the subjects predict the food image to receive more likes than the house image. However, we find that the user has posted too many food images, of which the followers may get tired. The more likes received by the house image indicates that the followers are more interested in viewing images with novel content. This contextual interactions among posts complicate I2 PA because humans and our model do not get access to such information. For the pair (d), many subjects pay too much attention to image aesthetics (i.e., they think the left image is more beautiful), which often results in selection bias. On Instagram, brilliant selfies generally receive more likes, which has been successfully captured by our model.
The pairs in Part III are difficult for our model because extremely abstract attributes such as the peculiar gesture (the pair (e)) and the creative/funny content (the pair (f)) need to be parsed and transformed to the concept of popularity. By contrast, humans have a better understanding of these concepts, and are able to make consistent choices easily.
For the pair (g) in Part VI, nearly all subjects prefer the elegant watch than the ordinary shoes, and our model agrees on this point. However, the shoes image receives more likes. We conjecture that the shoes may convey a special meaning (e.g., as a memorable gift), of which the subjects in the psychophysical experiment are unaware. The number of likes may also be boosted by the Internet vendor for sales promotion. For the pair (h), the number of likes is mainly determined by the texts in the image, which are difficult for most subjects to comprehend due to the cultural differences. Our model also fails to understand the words, and tends to give text images low popularity scores.
5. Conclusion
We have conducted a systematic study of I2PA. The principle behind I2PA is to predict image popularity based on the image content only, and the concept of PDIP is introduced to reliably infer intrinsic popularity. The first large-scale image database for I2PA is established, and a DNN-based computational model is further proposed, which achieves human-level performance. In addition, we have carried out a psychophysical experiment to understand how humans tend to behave in this task.
Acknowledgements
The authors would like to thank Dr. Zhuo (Jimmy) Wang for insightful discussions on the probabilistic formulation of I2PA.
References
- (1)
- Almgren et al. (2016) Khaled Almgren, Jeongkyu Lee, and Minkyu Kim. 2016. Predicting the future popularity of images on social networks. In Multidisciplinary International Social Networks Conference on Social Informatics, Data Science. 1–6.
- Bakhshi et al. (2014) Saeideh Bakhshi, David A Shamma, and Eric Gilbert. 2014. Faces engage us: Photos with faces attract more likes and comments on Instagram. In SIGCHI Conference on Human Factors in Computing Systems. 965–974.
- Bielski and Trzcinski (2018) Adam Bielski and Tomasz Trzcinski. 2018. Pay attention to virality: Understanding popularity of social media videos with the attention mechanism. In IEEE Conference on Computer Vision and Pattern Recognition Workshops. 2335–2337.
- Biernacki and Waldorf (1981) Patrick Biernacki and Dan Waldorf. 1981. Snowball sampling: Problems and techniques of chain referral sampling. Sociological Methods & Research 10, 2 (1981), 141–163.
- Burges et al. (2005) Chris Burges, Tal Shaked, Erin Renshaw, Ari Lazier, Matt Deeds, Nicole Hamilton, and Greg Hullender. 2005. Learning to rank using gradient descent. In International Conference on Machine Learning. 89–96.
- Can et al. (2013) Ethem F Can, Hüseyin Oktay, and R Manmatha. 2013. Predicting retweet count using visual cues. In ACM International Conference on Information & Knowledge Management. 1481–1484.
- Cappallo et al. (2015) Spencer Cappallo, Thomas Mensink, and Cees GM Snoek. 2015. Latent factors of visual popularity prediction. In ACM International Conference on Multimedia Retrieval. 195–202.
- Chopra et al. (2005) Sumit Chopra, Raia Hadsell, and Yann LeCun. 2005. Learning a similarity metric discriminatively, with application to face verification. In IEEE Conference on Computer Vision and Pattern Recognition. 539–546.
- Constine (2018) Josh Constine. 2018. Instagram hits 1 billion monthly users, up from 800M in September. https://techcrunch.com/2018/06/20/instagram-1-billion-users
- Damashek (1995) Marc Damashek. 1995. Gauging similarity with n-grams: Language-independent categorization of text. Science 267, 5199 (1995), 843–848.
- Deng et al. (2009) Jia Deng, Wei Dong, Richard Socher, Li-Jia Li, Kai Li, and Li Fei-Fei. 2009. ImageNet: A large-scale hierarchical image database. In IEEE Conference on Computer Vision and Pattern Recognition. 248–255.
- Deza and Parikh (2015) Arturo Deza and Devi Parikh. 2015. Understanding image virality. In IEEE Conference on Computer Vision and Pattern Recognition. 1818–1826.
- Dubey and Agarwal (2017) Abhimanyu Dubey and Sumeet Agarwal. 2017. Modeling image virality with pairwise spatial transformer networks. In ACM on Multimedia. 663–671.
- Gelli et al. (2015) Francesco Gelli, Tiberio Uricchio, Marco Bertini, Alberto Del Bimbo, and Shih-Fu Chang. 2015. Image popularity prediction in social media using sentiment and context features. In ACM International Conference on Multimedia. 907–910.
- He et al. (2015) Kaiming He, Xiangyu Zhang, Shaoqing Ren, and Jian Sun. 2015. Delving deep into rectifiers: Surpassing human-Level performance on ImageNet classification. In IEEE International Conference on Computer Vision. 1026–1034.
- He et al. (2016) Kaiming He, Xiangyu Zhang, Shaoqing Ren, and Jian Sun. 2016. Deep residual learning for image recognition. In IEEE Conference on Computer Vision and Pattern Recognition. 770–778.
- Hessel et al. (2017) Jack Hessel, Lillian Lee, and David Mimno. 2017. Cats and captions vs. creators and the clock: Comparing multimodal content to context in predicting relative popularity. In International Conference on World Wide Web. 927–936.
- Hsu et al. (2017) Chih-Chung Hsu, Ying-Chin Lee, Ping-En Lu, Shian-Shin Lu, Hsiao-Ting Lai, Chihg-Chu Huang, Chun Wang, Yang-Jiun Lin, and Weng-Tai Su. 2017. Social media prediction based on residual learning and random forest. In ACM on Multimedia. 1865–1870.
- Joachims (2002) Thorsten Joachims. 2002. Optimizing search engines using clickthrough data. In ACM SIGKDD Conference on Knowledge Discovery and Data Mining. 133–142.
- Khosla et al. (2014) Aditya Khosla, Atish Das Sarma, and Raffay Hamid. 2014. What makes an image popular?. In International Conference on World Wide Web. 867–876.
- Kingma and Ba (2014) Diederik P Kingma and Jimmy Ba. 2014. Adam: A method for stochastic optimization. arXiv:1412.6980 (2014).
- Krizhevsky et al. (2012) Alex Krizhevsky, Ilya Sutskever, and Geoffrey E Hinton. 2012. ImageNet classification with deep convolutional neural networks. In Advances in Neural Information Processing Systems. 1097–1105.
- Li (2011) Hang Li. 2011. Learning to rank for information retrieval and natural language processing. Synthesis Lectures on Human Language Technologies 4, 1 (2011), 1–113.
- LikelyAI (2017) LikelyAI. 2017. Predict the popularity of your Instagram posts. https://www.likelyai.com
- Liu (2009) Tie-Yan Liu. 2009. Learning to rank for information retrieval. Foundations and Trends in Information Retrieval 3, 3 (2009), 225–331.
- Lowe (2004) David G. Lowe. 2004. Distinctive image features from scale-invariant keypoints. International Journal of Computer Vision 60, 2 (2004), 91–110.
- Ma et al. (2017) Kede Ma, Wentao Liu, Tongliang Liu, Zhou Wang, and Dacheng Tao. 2017. dipIQ: Blind image quality assessment by learning-to-rank discriminable image pairs. IEEE Transactions on Image Processing 26, 8 (2017), 3951–3964.
- Mazloom et al. (2018) Masoud Mazloom, Iliana Pappi, and Marcel Worring. 2018. Category specific post popularity prediction. In International Conference on Multimedia Modeling. 594–607.
- Mazloom et al. (2016) Masoud Mazloom, Robert Rietveld, Stevan Rudinac, Marcel Worring, and Willemijn Van Dolen. 2016. Multimodal popularity prediction of brand-related social media posts. In ACM International Conference on Multimedia. 197–201.
- McParlane et al. (2014) Philip J McParlane, Yashar Moshfeghi, and Joemon M Jose. 2014. Nobody comes here anymore, it’s too crowded; predicting image popularity on Flickr. In ACM International Conference on Multimedia Retrieval. 385–391.
- Montgomery and Runger (2013) Douglas C Montgomery and George C Runger. 2013. Applied Statistics and Probability for Engineers (6nd. ed.). Wiley, New York.
- Murray et al. (2012) Naila Murray, Luca Marchesotti, and Florent Perronnin. 2012. AVA: A large-scale database for aesthetic visual analysis. In IEEE Conference on Computer Vision and Pattern Recognition. 2408–2415.
- Oliva and Torralba (2001) Aude Oliva and Antonio Torralba. 2001. Modeling the shape of the scene: A holistic representation of the spatial envelope. International Journal of Computer Vision 42, 3 (2001), 145–175.
- ParallelDots (2018) ParallelDots. 2018. Virality Detection. https://www.paralleldots.com/virality-detection
- Park and Lee (2017) Hyanghee Park and Joonhwan Lee. 2017. Do private and sexual pictures receive more likes on Instagram?. In IEEE International Conference on Research and Innovation in Information Systems. 1–6.
- Pinto et al. (2013) Henrique Pinto, Jussara M Almeida, and Marcos A Gonçalves. 2013. Using early view patterns to predict the popularity of Youtube videos. In ACM international conference on Web search and data mining. 365–374.
- Selvaraju et al. (2017) Ramprasaath R Selvaraju, Michael Cogswell, Abhishek Das, Ramakrishna Vedantam, Devi Parikh, and Dhruv Batra. 2017. Grad-CAM: Visual explanations from deep networks via gradient-based localization.. In International Conference on Computer Vision. 618–626.
- Simonyan and Zisserman (2014) Karen Simonyan and Andrew Zisserman. 2014. Very deep convolutional networks for large-scale image recognition. arXiv:1409.1556 (2014).
- Thurstone (1927) Louis L. Thurstone. 1927. A law of comparative judgment. Psychological Review 34, 4 (1927), 273–286.
- Trzciński and Rokita (2017) Tomasz Trzciński and Przemysław Rokita. 2017. Predicting popularity of online videos using support vector regression. IEEE Transactions on Multimedia 19, 11 (2017), 2561–2570.
- Wu et al. (2016a) Bo Wu, Wen-Huang Cheng, Yongdong Zhang, and Tao Mei. 2016a. Time matters: Multi-scale temporalization of social media popularity. In ACM Multimedia Conference. 1336–1344.
- Wu et al. (2017) Bo Wu, Wen-Huang Cheng, Yongdong Zhang, Huang Qiushi, Li Jintao, and Tao Mei. 2017. Sequential prediction of social media popularity with deep temporal context networks. In International Joint Conference on Artificial Intelligence.
- Wu et al. (2016b) Bo Wu, Tao Mei, Wen-Huang Cheng, and Yongdong Zhang. 2016b. Unfolding temporal dynamics: Predicting social media popularity using multi-scale temporal decomposition.. In AAAI Conference on Artificial Intelligence. 272–278.
- Yamaguchi et al. (2014) Kota Yamaguchi, Tamara L Berg, and Luis E Ortiz. 2014. Chic or social: Visual popularity analysis in online fashion networks. In ACM International Conference on Multimedia. 773–776.
- Zhang et al. (2018b) Wei Zhang, Wen Wang, Jun Wang, and Hongyuan Zha. 2018b. User-guided hierarchical attention network for multi-modal social image popularity prediction. In International Conference on World Wide Web. 1277–1286.
- Zhang et al. (2018a) Zhongping Zhang, Tianlang Chen, Zheng Zhou, Jiaxin Li, and Jiebo Luo. 2018a. How to become Instagram famous: Post popularity prediction with dual-attention. In IEEE International Conference on Big Data. 2383–2392.