- •
Enhanced and multiband superconductivity in the fully-gapped ReBe22 superconductor
Abstract
In search of the origin of superconductivity in diluted rhenium superconductors and their significantly enhanced compared to pure Be (0.026 K), we investigated the intermetallic ReBe22 compound, mostly by means of muon-spin rotation/relaxation (SR). At a macroscopic level, its bulk superconductivity (with K) was studied via electrical resistivity, magnetization, and heat-capacity measurements. The superfluid density, as determined from transverse-field SR and electronic specific-heat measurements, suggest that ReBe22 is a fully-gapped superconductor with some multigap features. The larger gap value, k, with a weight of almost 90%, is slightly higher than that expected from the BCS theory in the weak-coupling case. The multigap feature, rather unusal for an almost elemental superconductor, is further supported by the field-dependent specific-heat coefficient, the temperature dependence of the upper critical field, as well as by electronic band-structure calculations. The absence of spontaneous magnetic fields below , as determined from zero-field SR measurements, indicates a preserved time-reversal symmetry in the superconducting state of ReBe22. In general, we find that a dramatic increase in the density of states at the Fermi level and an increase in the electron-phonon coupling strength, both contribute to the highly enhanced value of ReBe22.
Keywords: Superconductivity, multigap, intermetallics, SR, time-reversal symmetry
1 Introduction
As one of the lightest elements, beryllium exhibits high-frequency lattice vibrations, a condition for achieving superconductivity (SC) with a sizeable critical temperature. Yet, paradoxically, its K is so low [1], that its superconductivity is often overlooked. Clearly, is affected also by the electron-phonon coupling strength (typically large in elements with covalent-bonding tendencies) and the density of states (DOS) at the Fermi level (rather low in pure Be). The latter depends on the details of crystal structure and on atomic volume, both effects being nicely illustrated by metal-hydride SCs under pressure (see, e.g., reference [2]). In this regard, recently researchers could demonstrate a purely phonon-mediated superconductivity with up to 250 K in actinium hydrides at 200 GPa [3]. The key insight of this work was the discovery of a link between chemical composition and superconductivity. Namely, that the superconductivity is more likely to occur in materials containing metal atoms that are close to populating a new electronic subshell, such as the - (Sc, Y, La, and Ac) or (Be, Mg, and Ca) elements. In these cases, the electronic structure becomes highly sensitive to the positions of the neighboring atoms [4], resulting in stronger electron-phonon interactions and a higher . Based on this intuition, Be-rich alloys may achieve a much higher than elementary beryllium, a prediction which turns out to be true for ReBe22 [5], whose K is almost 400(!) times higher than that of Be. This is a remarkable result, deserving more attention and a detailed investigation of the ReBe22 electronic properties.
ReBe22 represents also a very interesting case in an entirely different aspect. Recently, a number of studies have shown that Re-based superconductors exhibit unconventional superconducting behaviour. For example, in non-centrosymmetric -Mn-type Re alloys ( = transition metal), the time-reversal symmetry (TRS) is broken, and the upper critical field is close to the Pauli limit [6, 7, 8]. Surprisingly, our previous results show that, below , even pure Re breaks TRS, thus behaving as an unconventional superconductor [8]. While binary Re-based superconductors have been investigated in both the full- (pure Re) and the intermediate Re limit (Re), it is not clear if the unconventional behavior, in particular the TRS breaking, persists also in the dilute Re limit. With only 4% of Re content, ReBe22 is a good test case to verify such scenario.
In this paper, we report on an extensive study of the physical properties in the normal and superconducting state of ReBe22, by means of electrical resistivity, magnetization, thermodynamic, and muon-spin relaxation (SR) methods. In addition, we also present numerical density-functional-theory (DFT) band-structure calculations. ReBe22 exhibits a fully-gapped, spin-singlet superconducting state with preserved TRS. Despite the very small amount of Re, the ReBe22 alloy shows a remarkable increase in compared to its elementary constituents, which we mostly attribute to the significant increase of DOS at the Fermi level.
2 Methods
Polycrystalline samples of ReBe22 were prepared by arc melting of elementary Be (Heraeus, 99.9%) and Re (Chempur, 99.97%) in an argon-filled glove box [MBraun, (H2O/O2) 0.1 ppm], dedicated to the handling of Be-containing samples [9]. To compensate for the evaporation losses and to avoid the formation of spurious Re-Be binary phases, a small excess of beryllium was used. Powder x-ray diffraction (XRD) measurements were performed on a Huber G670 image-plate Guinier camera (Ge-monochromator, Cu K radiation). The lattice parameter of cubic ReBe22 was determined from a least-squares fit to the experimental peak positions. The sample purity was then checked by electron microscopy and energy-dispersive x-ray spectroscopy (EDX) on a JEOL JSM-6610 scanning electron microscope equipped with secondary electron-, electron backscatter-, and UltraDry EDS detectors (see figure 14 in the Appendix). Besides traces of elemental Be, no chemical impurities or secondary phases could be detected.
The magnetic susceptibility, electrical resistivity, and specific-heat measurements were performed on a 7-T Quantum Design Magnetic Property Measurement System (MPMS-7) and on a 14-T Physical Property Measurement System (PPMS-14) equipped with a 3He option. The SR measurements were carried out at the GPS spectrometer of the Swiss muon source at Paul Scherrer Institut, Villigen, Switzerland [10]. The SR data were analysed by means of the musrfit software package [11].
The band structure of ReBe22 was calculated by means of density-functional theory. Here we used the full-potential nonorthogonal local orbital code (FPLO) [12]. To calculate the nonmagnetic band structure we employed the local-density approximation parametrized by the exchange-correlation potential of Perdew and Wang [13]. The strong spin-orbit coupling of Re atoms was taken into account by performing full-relativistic calculations by solving the Dirac Hamiltonian with a generic potential.
3 Results and discussion
3.1 Crystal structure
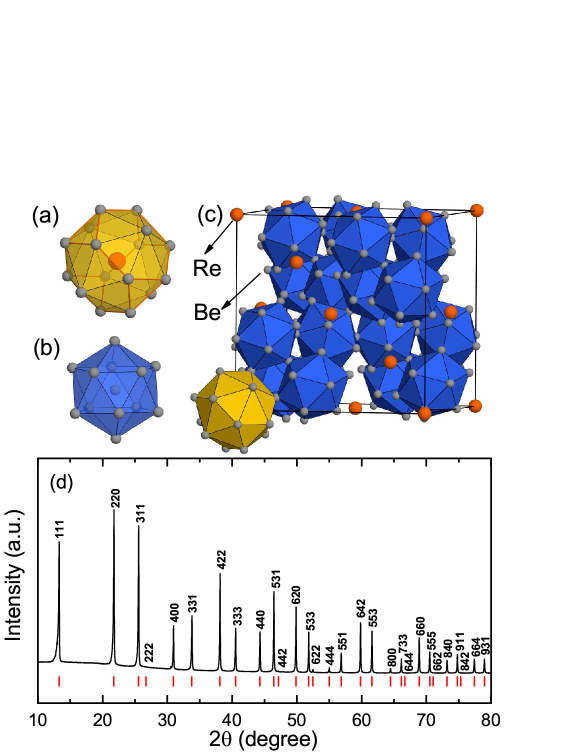
As shown in figure 1, the complex intermetallic compound ReBe22 adopts a cubic ZrZn22-type structure with space group (No. 227) and formula units per cell. The lattice parameter = 11.5574(4) Å, determined from the XRD pattern [see figure 1(d)], is consistent with the previously reported value [14]. No obvious impurity phases could be detected, indicating the high quality of the synthesized samples. The crystal structure can be visualized by means of two structural motifs. In the ReBe16 motif [see figure 1(a)], Re is coordinated by twelve Be atoms, lying 2.53 Å apart at the vertices of a truncated tetrahedron, also known as a Friauf polyhedron. Four additional Be atoms lie atop the hexagonal faces of the truncated tetrahedron at a distance of 2.50 Å from the center. A similar motif is also found in the NbBe2 superconductor [15, 16]. As for the rest of Be atoms, these form distorted Be-centered Be13 icosahedra, with the short interatomic distances ranging from 2.05 to 2.29 Å [figure 1(b)]. Such Be-icosahedra represent the structural building blocks of the complex Be13 phases with a NaZn13-type structure [17].
As shown in figure 1(c), the ReBe16 and Be13 units are connected by sharing the polyhedra vertices. The arrangement of the two types of polyhedra within a unit cell can be described as hierarchically derived from the MgCu2-type structure, where the Mg positions are occupied by ReBe16 units and those of Cu by Be13 icosahedra [18]. Both motifs, the truncated tetrahedron and the icosahedron, are found in the close-packed Laves phase structures. As a consequence of the high Be content, ReBe22 features structural motifs typically found in Be-rich intermetallic compounds, dominated by close-packing structures similar to that of hcp-Be [19, 20]. Since the ratio of metallic radii [/ = 1.223] is close to the ideal value of 1.225, this facilitates the close-packing of unequal spheres in ReBe22 and the accomodation of Re in the structure [21, 22]. The high packing fraction in this deltahedral structure is an important factor for the stabilization of this unusual stoichiometry, also found in the isostructural MoBe22 and WBe22 compounds, both featuring similar ratios of radii [23].
3.2 Electrical resistivity
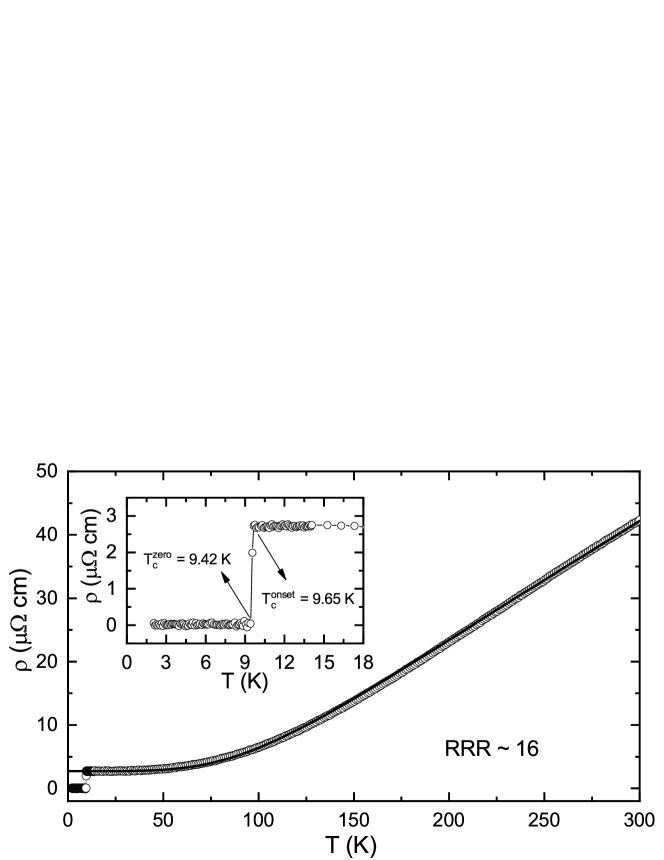
The temperature dependence of the electrical resistivity of ReBe22 was measured in zero magnetic field from 300 K down to 2 K. As shown in figure 2, the resistivity exhibits metallic features down to base temperature, dropping to zero at the superconducting transition at K (see inset). Between and 300 K the electrical resistivity can be modelled by the Bloch-Grüneisen (BG) formula [24, 25]:
| (1) |
Here, the first term is the residual resistivity due to the scattering of conduction electrons on the static defects of the crystal lattice, while the second term describes the electron-phonon scattering, with being the characteristic (Debye) temperature and a coupling constant. The fit (black-line) in figure 2 results in cm, cm, and K. Such a large value is consistent with the heat-capacity results (see below) and reflects the high frequency of phonons in ReBe22. This is compatible with the high Debye temperature of elemental Be ( 1031 K) [26], in turn reflecting the small mass of beryllium atoms. A relatively large residual resistivity ratio [RRR ] and a sharp superconducting transition ( K) both indicate a good sample quality.
3.3 Magnetization measurements
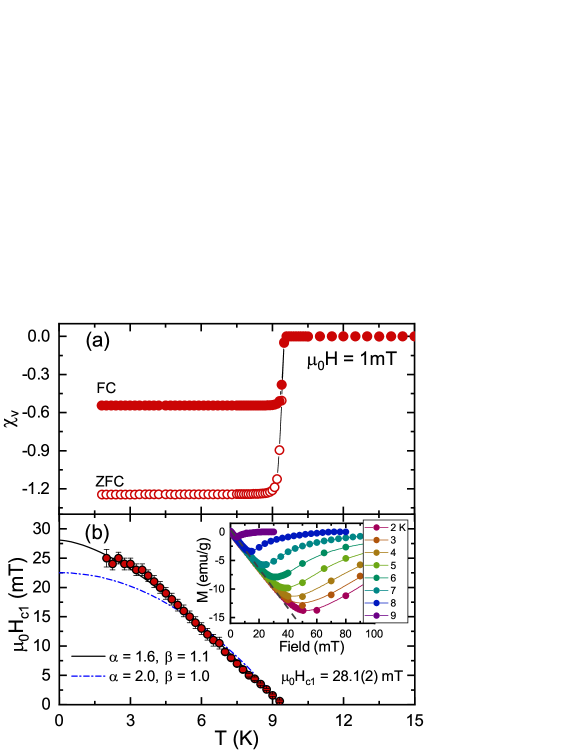
The bulk superconductivity of ReBe22 can be probed by magnetization measurements. The temperature evolution of the magnetic susceptibility , measured at 1 mT using both field-cooled (FC) and zero-field-cooled (ZFC) protocols, is shown in figure 3(a). The splitting of the FC- and ZFC-susceptibilities is typical of granular superconductors, where the magnetic-field flux is trapped (in open holes) upon cooling the material in an applied field [27]. The curves show the onset of the superconducting transition at K, in agreement with the values determined from electrical resistivity (figure 2) and heat capacity (see below).
The field-dependent magnetization , measured at various temperatures (up to ), was used to determine the lower critical field of ReBe22. As shown in the inset of figure 3(b), the curves, recorded using a ZFC-protocol, exhibit the typical response expected for a type-II superconductor. The resulting vs. temperature data are summarized in figure 3(b) and the phenomenological model was used to estimate . With and , the curve shown by a solid line in figure 3(b) gives a lower critical field mT. At the same time, the general model, with and , shows a poor agreement with the experimental data. Since is proportional to the inverse-square of the magnetic penetration depth (see section 3.5 and reference [28]), a complex -dependence of is indicative of multiband superconductivity in ReB22.
3.4 Specific heat
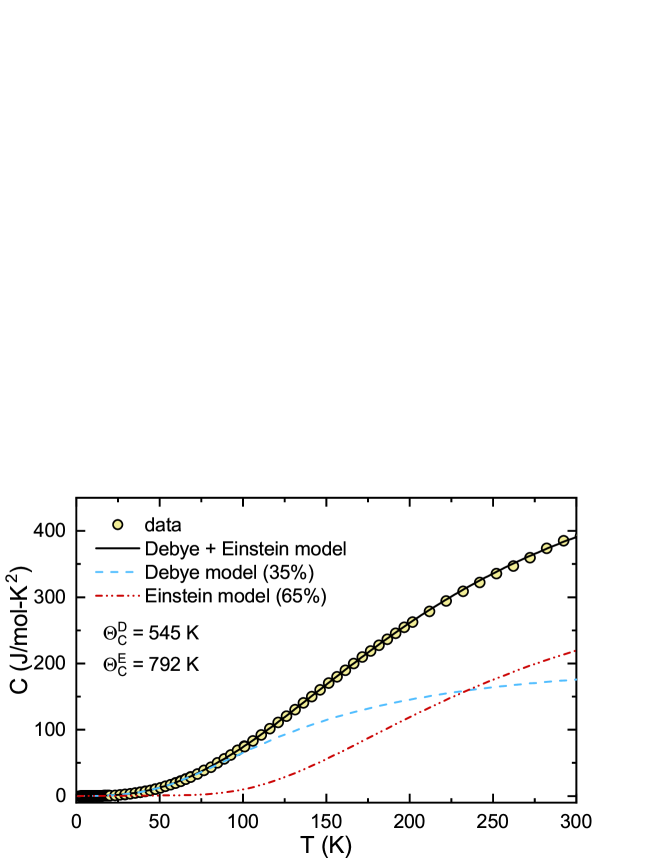
The temperature dependence of the heat capacity of ReBe22 was also measured in zero-field conditions from 300 K down to 2 K. Although a single Debye- or Einstein model cannot describe the data, as shown in figure 4, the normal-state can be fitted by a combined Debye and Einstein model, with relative weights and [29]:
| (2) |
The number of atoms per ReBe22 formula-unit () is considered in the above equation. The first term represents the electronic specific heat, which can be determined from the low- heat-capacity data (see below). The second and the third terms represent the acoustic- and optical phonon-mode contributions, described by the Debye and Einstein model, respectively [29]:
| (3) |
| (4) |
Here and are the Debye and Einstein temperatures, while J/mol-K is the molar gas constant. The best fit curve (solid line in figure 4) is obtained for K and K, with . The resulting Debye temperature is comparable to that derived from electrical resistivity data (see figure 2).
The low- specific-heat data were further analyzed, since they can offer valuable insight into the superconducting properties of ReBe22 through the evaluation of the quasiparticle DOS at the Fermi level. As shown in figure 5, the sharp specific-heat jump at again indicates a bulk superconducting transition and a good sample quality. The electronic specific heat / was obtained by subtracting the phonon contribution from the experimental data. The DOS at the Fermi level can be evaluated from the expression states/eV-f.u. (accounting for spin degeneracy) [30], where is the Boltzmann constant and mJ/mol-K2 is the electronic specific-heat coefficient. The electron-phonon coupling constant , a measure of the attractive interaction between electrons due to phonons, was estimated from the and values by means of the semi-empirical McMillan formula [31]:
| (5) |
The Coulomb pseudo-potential was fixed to 0.13, a typical value for metallic samples. From equation (5) we obtain for ReBe22, almost three times larger than the reported value for elemental Be (0.21) [32]. By using this value, finally, the band-structure density of states can be estimated from the relation ) [30], which gives = states/eV-f.u.
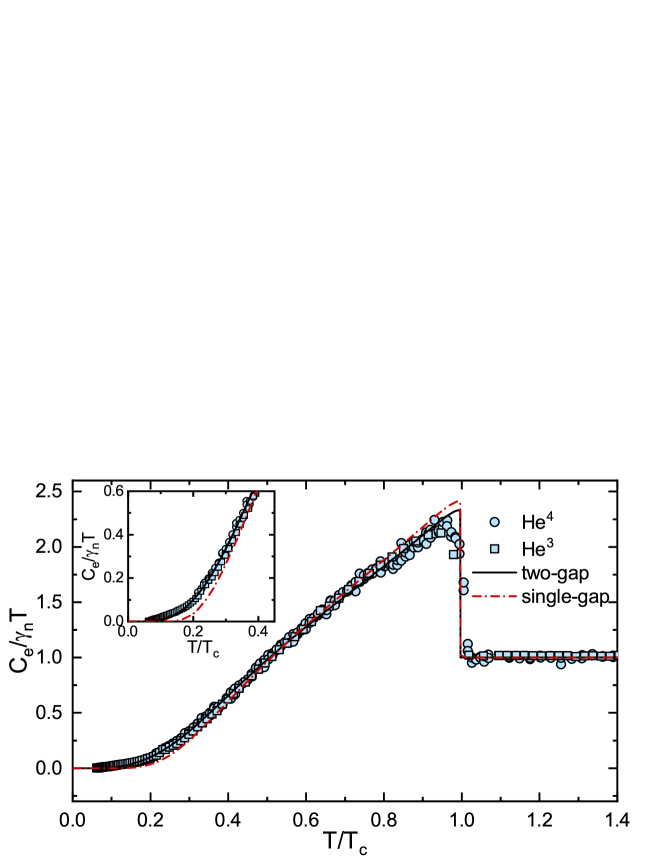
After subtracting the phonon contribution from the specific-heat data, the electronic specific heat divided by the electronic specific-heat coefficient, i.e., , is obtained (main panel in figure 5). The temperature-dependent superconducting-phase contribution to the entropy was calculated by means of the BCS expression [33]:
| (6) |
where is the Fermi function and is the excitation energy of quasiparticles, with the electron energies measured relative to the chemical potential (Fermi energy) [33, 37]. Here [38], with the gap value at zero temperature. The temperature-dependent electronic specific heat in the superconducting state can be calculated from . The dash-dotted line in figure 5 represents a fit with an -wave model with a single gap meV. While this reproduces well the experimental data in the range, out of it the single-gap model clearly deviates from the data (see lower inset). On the contrary, the two-gap model exhibits a better agreement, both at low temperatures as well as near . The solid line in figure 5 is a fit to the two-gap -wave model, known also as model [39]:
| (7) |
Here each term represents a single-gap specific-heat contribution, with the small- and the large gap, and the relative weight. The two-gap model gives , meV and meV, with both superconducting gap values being consistent with the SR results (see figure 9). In addition, the larger gap is comparable to the weak-coupling BCS value (1.4 meV), indicating weakly-coupled superconducting pairs in ReBe22. The specific-heat discontinuity at , i.e., , is smaller than the BCS value of 1.43. There are two possibilities for such a reduced specific-heat discontinuity, despite a good sample quality and full superconducting volume fraction: i) gap anisotropy, including a nodal gap, as observed in some heavy-fermion superconductors or in Sr2RuO4 [40, 41], or ii) multiband superconductivity, as e.g., in MgB2 or LaNiGa2 [36, 42]. Due to a highly-symmetric crystal structure and to a lack of gap nodes (see below), only the second scenario is applicable to the ReBe22 case.
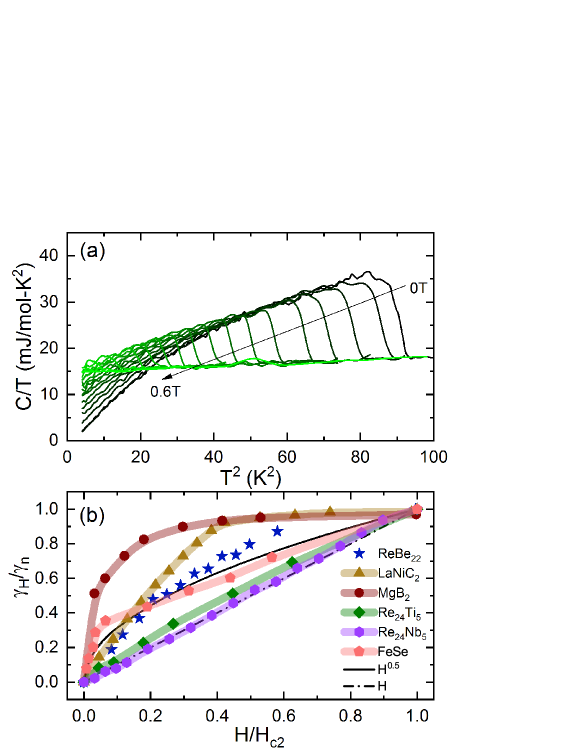
The multiband superconductivity of ReBe22 can be inferred also from the field dependence of the electronic specific heat coefficient . As shown in figure 6(a), at a given applied field, is obtained as the linear extrapolation of vs. (in the superconducting phase) to zero temperature. The dependence of the normalized vs. the reduced magnetic field is shown in figure 6(b) (here is the zero-field normal-phase value). Note that, the field dependence of at 2 K exhibits similar features to that evaluated at zero temperature. Due to the multiband effects, it is difficult to describe the field dependence of in ReBe22 with a simple formula. As can be seen in figure 6(b), clearly deviates from the linear field dependence (dash-dotted line) expected for single-gap BCS superconductors [43], or from the square-root dependence (solid line) expected for nodal superconductors [44, 45]. In fact, ReBe22 exhibits similar features to other multiband superconductors, as e.g., LaNiC2 [34], FeSe [35], and MgB2 [36] (the latter being a prototypical two-gap superconductor), although the slopes of close to are different.
3.5 Upper critical field
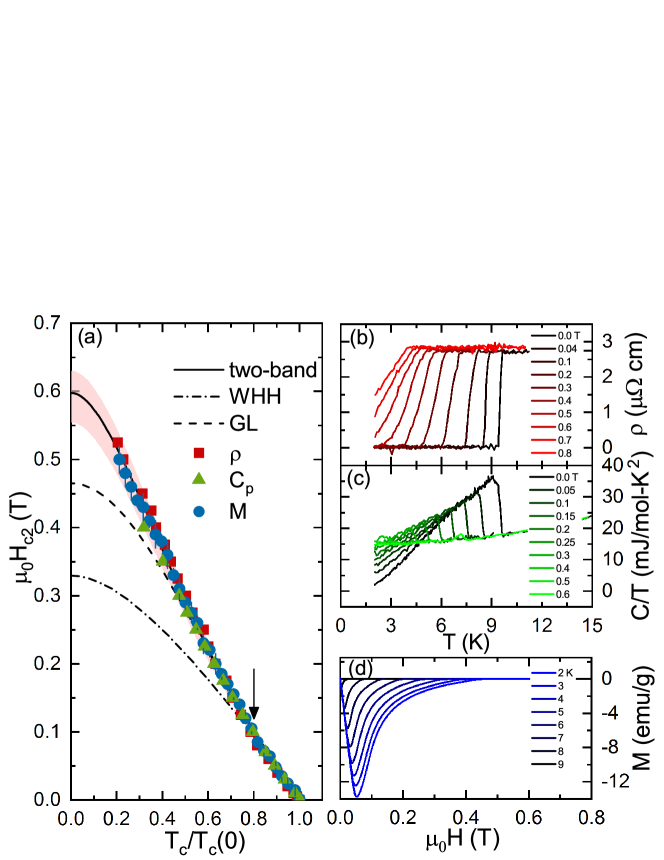
The upper critical field of ReBe22 was determined via temperature-dependent resistivity and specific heat measurements at various applied magnetic fields, as well as from the field-dependent magnetization at various temperatures. The derived values as a function of the reduced temperature /(0) are summarized in figure 7(a). Upon applying a magnetic field, the superconducting transition in both and specific heat / data shifts towards lower temperatures [see figures 7(b)-(c)]. In the case, the diamagnetic signal disappears once the applied magnetic field exceeds the upper critical field [figure 7(d)]. The values determined using different techniques are highly consistent. The temperature dependence of was analyzed by means of three different models, i.e., a Ginzburg-Landau (GL) [46], a Werthamer-Helfand-Hohenberg (WHH) [47], and a two-band (TB) [48] model. As can be seen in figure 7(a), at low fields, both GL and WHH models reproduce very well the experimental data. However, at higher magnetic fields, both models deviate significantly from the experimental data, providing underestimated values.
A positive curvature of near is considered a typical feature of multiband superconductors, as e.g., MgB2 [49, 50]. It reflects the gradual suppression of the small superconducting gap with increasing magnetic field, as evidenced also by the specific-heat data shown in figure 6. The arrow in figure 7(a) identifies the small kink in close to 0.1 T, here considered to coincide with the field value which suppresses the small superconducting gap. Also changes its slope near this critical field [corresponding to in figure 6(b)]. The remarkable agreement of the two-band model with the experimental data across the full temperature range is clearly seen in figure 7(a), from which we find T.
The superconducting coherence length can be calculated from = , where T m2 is the quantum of magnetic flux. With a bulk T, the calculated is 23(1) nm. The lower critical field is related to the magnetic penetration depth and the coherence length via ln, where = / is the GL parameter [28]. By using mT and T, the resulting magnetic penetration depth = 109(1) nm, is comparable to 87(1) nm (40 mT) and 104(1) nm (120 mT), the experimental values evaluated from TF-SR data (see section 3.6). A GL parameter , much larger than the threshold value of , clearly indicates that ReBe22 is a type-II superconductor.
3.6 Transverse-field SR
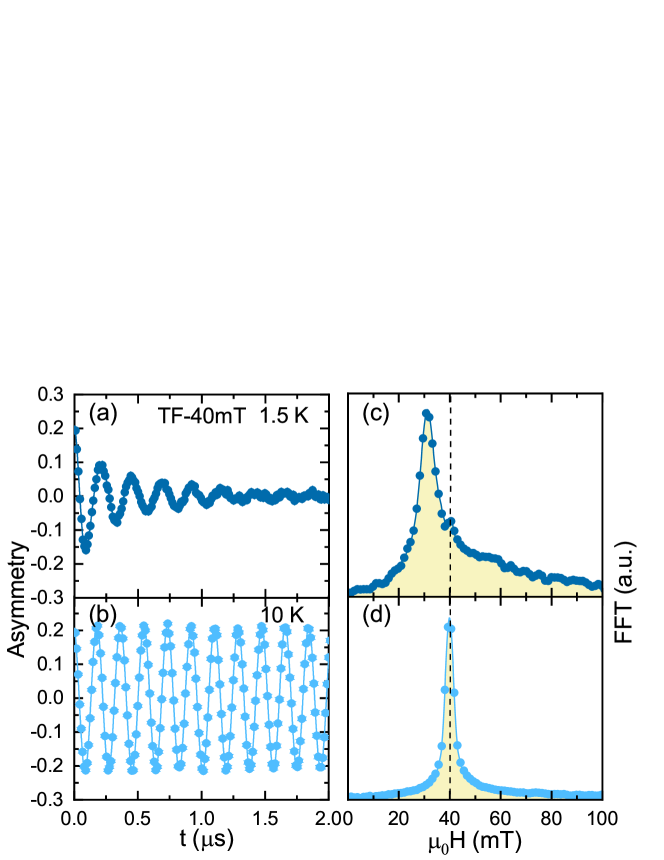
SR measurements in an applied transverse field (TF) were carried out to investigate the superconducting properties of ReBe22 at a microscopic level. Preliminary field-dependent SR depolarization-rate measurements at 1.5 K were carried out to determine the optimal field value for the temperature-dependent study (see figure 15 in Appendix). To track the additional field-distribution broadening due to the flux-line-lattice (FLL) in the mixed superconducting state, the magnetic field was applied in the normal state, prior to cooling the sample below . After the field-cooling protocol, which ensures an almost ideal FLL even in case of pinning effects, the TF-SR measurements were performed at various temperatures upon warming. Figures 8(a) and (b) show two representative TF-SR time-spectra collected in the superconducting (1.5 K) and the normal state (10 K) in an applied field of 40 mT at the GPS spectrometer. The enhanced depolarization rate below reflects the inhomogeneous field distribution due to the FLL, causing an additional distribution broadening in the mixed state [see figure 8(c)]. The SR spectra can be modelled by the following expression:
| (8) |
Here and represent the initial muon-spin asymmetries for muons implanted in the sample and sample holder, respectively, with the latter not undergoing any depolarization. and are the local fields sensed by implanted muons in the sample and sample holder, MHz/T is the muon gyromagnetic ratio, is a shared initial phase, and is a Gaussian relaxation rate of the th component. The number of required components is material dependent, generally in the range. For superconductors with a large (), the magnetic penetration depth is much larger than the coherence length. Hence, the field profiles of each fluxon overlap strongly, implying a narrow field distribution. Consequently, a single-oscillating component is sufficient to describe , as e.g., in Re [7, 8] or Mo3Rh2N [51]. In case of a small (), as e.g., in ReBe22, the magnetic penetration depth is comparable to the coherence length. The rather small implies fast-decaying fluxon field profiles and a broad field distribution, in turn requiring multiple oscillations to describe [52]. The fast-Fourier-transform (FFT) spectra of the TF-SR datasets at 1.5 K and 10 K are shown in figures 8(c) and (d). The solid lines represent fits to equation (8) using three oscillations (i.e., ) in the superconducting state and one oscillation in the normal state. The TF-SR spectra collected at 120 mT require only two oscillations (i.e., ), indicating a narrower field distribution compared to the 40-mT case. The derived Gaussian relaxation rates as a function of temperature are summarized in the insets of figure 9.
Above , the relaxation rate is small and temperature-independent, but below it starts to increase due to the onset of the FLL and the increase in superfluid density. In case of multi-component oscillations, the first-term in equation (8) describes the field distribution as the sum of Gaussian relaxations [52]:
| (9) |
Then, the first- and the second moment of the field distribution
can be calculated by:
| (10) |
| (11) |
where . The superconducting Gaussian relaxation rate related to the FLL () can be extracted by subtracting the nuclear contribution according to , where is the nuclear relaxation rate. The superconducting gap value and its symmetry can be investigated by measuring the temperature-dependent , which is directly related to the magnetic penetration depth and thus the superfluid density ().
Since the upper critical field of ReBe22 is relatively small (600 mT) compared to the applied fields used in the TF-SR study (40 and 120 mT), the effects of the overlapping vortex cores with increasing field ought to be considered when extracting the magnetic penetration depth from . For ReBe22, was calculated by means of [28, 53]:
| (12) |
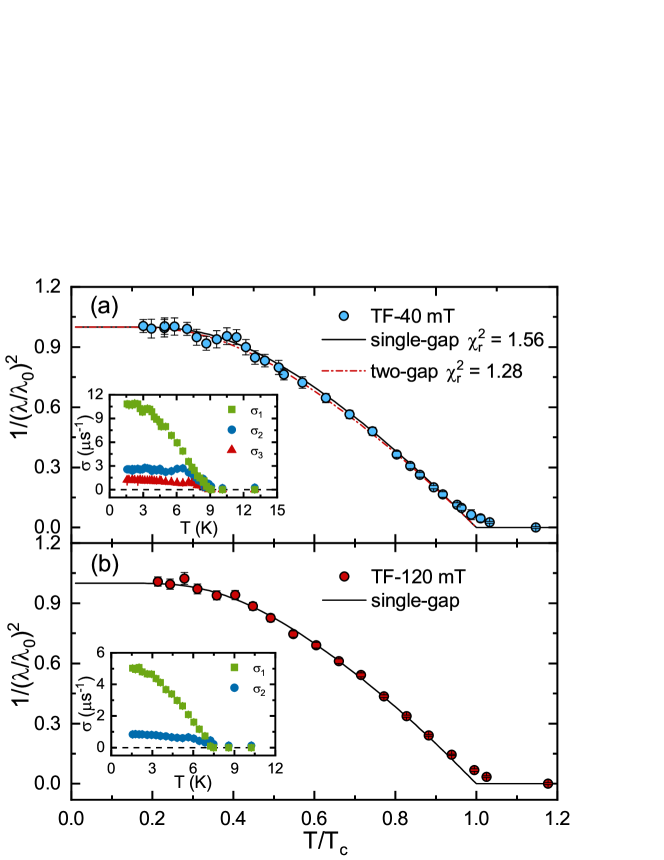
where , with the applied magnetic field. The above expression is valid for type-II superconductors with in the 1 field range. With and (TF-50 mT) and 0.2 (TF-120 mT), ReBe22 fulfills the above condition. Note that, in the above expression, only the absolute value of the penetration depth, but not its temperature dependence is related to the value. By using equation (12), we calculated the inverse-square of the magnetic penetration depth, which is proportional to the superfluid density, i.e., . As can be seen in figure 9, below , is practically independent of temperature, in agreement with the specific-heat results shown in figure 6, once more indicating a nodeless superconductivity in ReBe22. was further analysed by means of a two-gap -wave model, previously applied to the well-established two-gap superconductor MgB2 [38, 54]. In general, the superfluid density can be described by:
| (13) |
As in the specific-heat case, and are the superfluid densities related to the small () and large () gaps, and is a relative weight. For each gap, is given by:
| (14) |
where and are the Fermi- and the gap function, respectively, as in section 3.4. Here, the gap value at zero temperature is the only adjustable parameter. As can be seen in figure 9(a), for TF-40 mT, the temperature-independent behavior of is consistent with an -wave model with either a single- (solid line) or two gaps (dash-dotted line). The single-gap model, however, shows a less good agreement with the measured , as confirmed by the larger value (goodness of fit) compared to the two-gap model. Such conclusion is also supported by the low- specific-heat data shown in figure 5 and figure 6(b) and the upper critical field in figure 7. For the two-gap model, the zero-temperature magnetic penetration depth is nm and the estimated gap values are = 0.83(1) meV and = 1.35(1) meV, with a weight . The latter are consistent with the gap values obtained from specific-heat data. For the single-gap model, the estimated gap value is meV, with the same as in the two-gap case. In the TF-SR with mT [see figure 9(b)], the applied field suppresses the smaller gap [see details in figure 6(b) and figure 7]. Hence the dependence is consistent with a single-gap -wave model, leading to nm and meV.
3.7 Zero-field SR
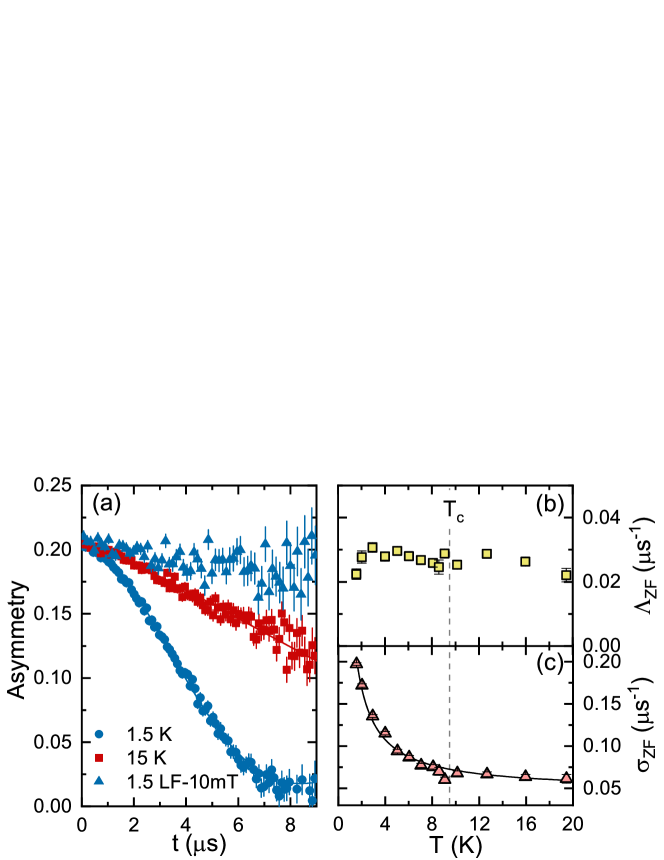
To search for a possible weak magnetism or TRS breaking in the superconducting state of ReBe22, ZF-SR measurements were performed in the 1.5–20 K temperature range. Normally, in the absence of external fields, there is no change in the ZF muon-spin relaxation rate near . However, in case of a broken TRS, the onset of tiny spontaneous currents gives rise to associated (weak) magnetic fields, causing an increase in the muon-spin relaxation rate in the superconducting state. Representative ZF-SR spectra for ReBe22 collected above (15 K) and below (1.5 K) are shown in figure 10. No oscillations could be observed, implying a lack of magnetic order in ReBe22. In such case, in absence of applied fields, the relaxation is mainly determined by the randomly oriented nuclear moments. Consequently, the ZF-SR spectra of ReBe22 can be modelled by means of a combined Lorentzian and Gaussian Kubo-Toyabe relaxation function [55, 56]:
| (15) |
Here and are the same as in the TF-SR case in equation (8). In polycrystalline samples, the 1/3-nonrelaxing and 2/3-relaxing components of the asymmetry correspond to the powder average of the local internal fields with respect to the initial muon-spin orientation. The resulting fit parameters vs. temperature, including the Lorentzian- and Gaussian relaxation rates , are shown in figures 10(b)-(c). Here was fixed to its average value of 0.205, however, the same features are also found in fits with released .
The large relaxation rates reflect the significant nuclear magnetic moments present in ReBe22. A similarly fast Gaussian relaxation was also found in other Re-based alloys [7, 8]. This is in contrast to superconductors containing nuclei with small magnetic moments, as e.g., Mo3Rh2N [51], which exhibit a negligibly small relaxation. Despite the clear difference in the ZF-SR spectra recorded in the normal and superconducting states [figure 10(a)], neither nor show distinct changes across . The enhanced below 6 K in figure 10(c) might be caused by tiny amounts of magnetic impurities, below the XRD and EDX detection threshold. This is also indicated by the Curie-Weiss-like behavior of in figure 10(c), i.e., , whose positive curvature is opposite to the negative one, common in case of TRS breaking [7, 8]. To further distinguish the intrinsic vs. extrinsic effects in , samples synthesized using even higher purity chemicals are desirable. We also performed auxiliary longitudinal field (LF) SR measurements at 1.5 K. As shown in figure 10(a), a field of 10 mT is already sufficient to lock the muon spins and to completely decouple them from the weak magnetic fields, confirming the sparse presence of magnetic impurities. In conclusion, the ZF-SR results indicate a preserved TRS in the superconducting state of ReBe22.
3.8 Electronic band structure

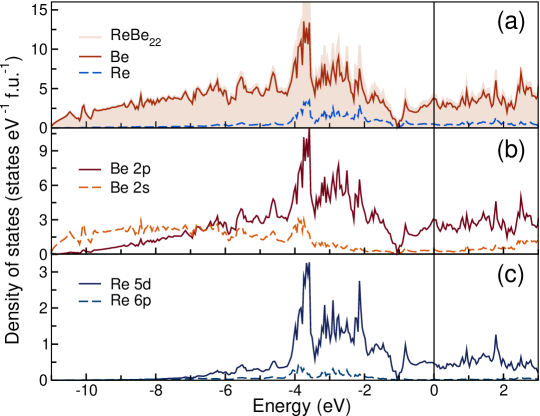
To shed more light on the underlying electronic properties of ReBe22, we performed electronic band-structure calculations based on DFT, including spin-orbit coupling. Figure 11 shows the total-, atomic-, and orbital-projected DOS, disclosing the metallic nature of the system through its nonzero DOS at the Fermi level. The main contributions to the latter arise from the Re- and Be- orbitals. While the Be-Be bonding is comprised primarily of 2 orbitals, the Re-Be hybridization consists of Re-5 and Be-2 states. Notwithstanding a 4% Re-to-Be ratio in a ReBe22 formula unit, Re atoms are over-represented with an almost 3 times larger weight of 12% in the density of states at the Fermi level. Our calculations estimate a total DOS at the Fermi level of states/eV-f.u., comparable to the 3.25 states/eV-f.u. extracted from specific-heat data. Both values are significantly larger ( 50 times) than that estimated for elemental Be [57] and, consequently, may justify the huge increase in with respect to Be (from 0.026 to 9.4 K). Interestingly, a similar value has been observed also when Be is deposited as a quenched condensed film [58]. Also in this case, the surge in was shown to originate from the increase of DOS at in the structurally disordered condensate [57].
The ReBe22 band structure shown in figure 12 reveals multiple dispersive bands crossing the Fermi energy. In particular, the electron pockets centered around the point are much larger than the hole pockets centered around the point. This circumstance is typical of multigap/multiband superconductors, as clearly reflected also in our experimental results. Finally, the band splitting due to the spin-orbit coupling of Re is barely visible here due to the low Re/Be ratio.
| Property | Value | Property | Value | |
|---|---|---|---|---|
| 9.42(2) K | 0.60(3) T | |||
| 2.72(5) cm | 23(1) nm | |||
| 590(5) K | (40 mT) | 8.8(1) K | ||
| 9.50(1) K | 0.10 | |||
| 28.1(2) mT | 0.83(1) meV | |||
| 24.9(5) mT | 1.35(1) meV | |||
| 9.36(2) K | (40 mT) | 87(1) nm | ||
| 15.3(2) mJ/mol-K2 | (120 mT) | 104(1) nm | ||
| 545(5) K | 64(1) nm | |||
| 792(5) K | 4.7(3) | |||
| 0.64(1) | 3.0(1) | |||
| 3.25(3) eV-f.u. | 1.9(1) | |||
| 1.98(1) eV-f.u. | 53(1) nm | |||
| 4 eV-f.u. | 62(1) nm | |||
| 0.13 | 2.06(5) 1028 m-3 | |||
| 0.68(1) meV | 3.29(7) 105 ms-1 | |||
| 1.43(1) meV | 2.07(5) 104 K | |||
| 1.24(2) |
3.9 Discussion
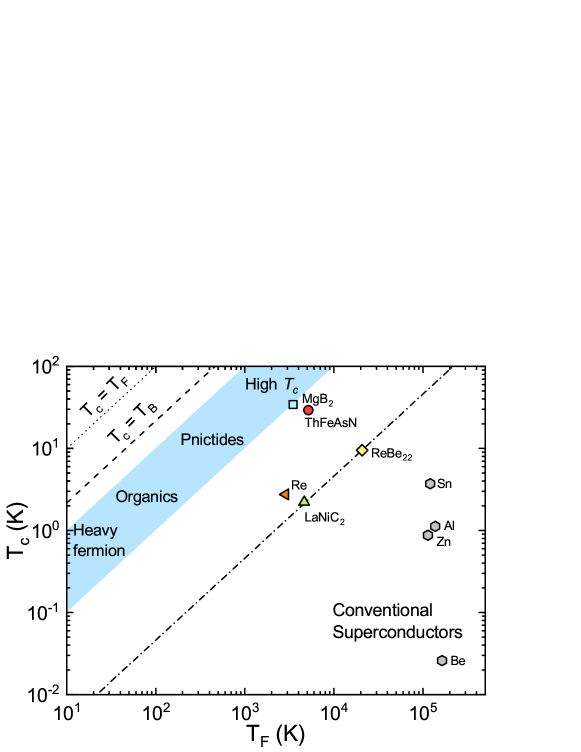
The different families of superconductors can be classified according to the ratio of the superconducting transition temperature to the effective Fermi temperature , in a so-called Uemura plot [63]. As can be seen in figure 13, several types of unconventional superconductors, including heavy-fermion, organic, high- iron pnictides, and cuprates, all lie in a range, here indicated by the shadowed region. Conversely, conventional BCS superconductors exhibit , here exemplified by the elemental Sn, Al, and Zn. Three typical examples of multiband superconductors, LaNiC2, ThFeAsN, and MgB2, are also shown in figure 13. According to the superconducting parameters obtained from our measurements (here summarized in table 1), the calculated value for ReBe22 is (diamond in figure 13). Although it cannot be classified as an unconventional superconductor, ReBe22 is far away also from the region of conventional superconductors and shows practically the same ratio as the multiband superconductor LaNiC2 (both lying in the same dash-dotted line). Compared to pure Be () [30, 1], the value of ReBe22 is enhanced due to the presence of diluted Re, the latter being characterized by a lower Fermi temperature and, hence, a larger ratio (see Re in figure 13). Such conclusion is further supported by our electronic band-structure calculations, which show that, although Re contributes only 4% to the atomic ratio, with its 12% weight, it is over-represented in the density of states at the Fermi level.
4 Conclusion
To summarize, we investigated the physical properties of the ReBe22 superconductor by means of electrical resistivity, magnetization, heat capacity, and SR measurements, as well as by electronic band-structure calculations. We find that ReBe22 is a type-II superconductor (), with a bulk K and critical fields mT and T. The temperature dependence of the zero-field electronic specific heat and superfluid density reveal a nodeless superconductivity, well described by an isotropic -wave model, which is more consistent with a multigap- rather than a single-gap superconductivity. The multigap features are further supported by the field-dependent electronic specific-heat coefficient, the upper critical field, and the calculated electronic band structure. The lack of spontaneous magnetic fields below indicates that, unlike in the Re-rich cases, in a Re-diluted superconductor such as ReBe22, time-reversal symmetry is preserved. Compared to pure Be, the observed 400-fold increase in is shown to be due to the concomitant increase of both the electron-phonon coupling strength and of the density of states at the Fermi level. Future high-pressure studies of ReBe22 should reveal the evolution of its superconducting properties upon decreasing the lattice parameter.
Appendix A EDX and field-dependent muon-spin relaxation
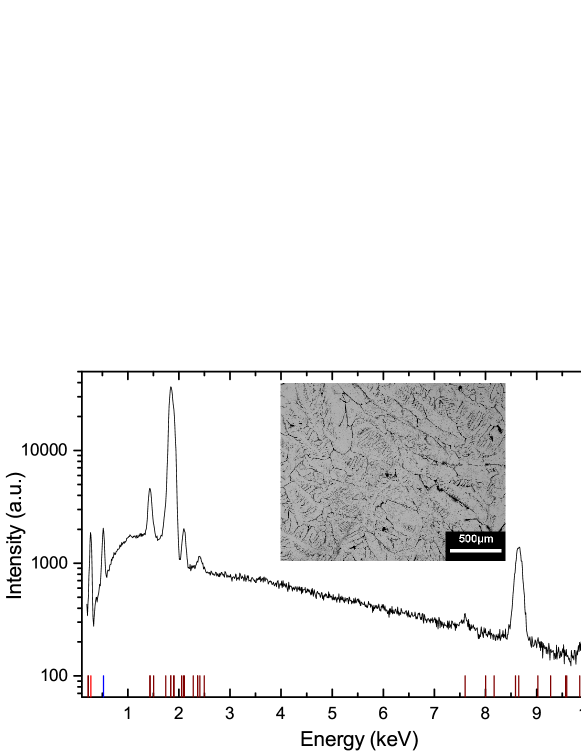
A typical energy-dispersive x-ray spectrum of ReBe22 and the respective electron micrograph are shown in figure 14. The high chemical purity of the sample is reflected in the lack of unknown peaks.
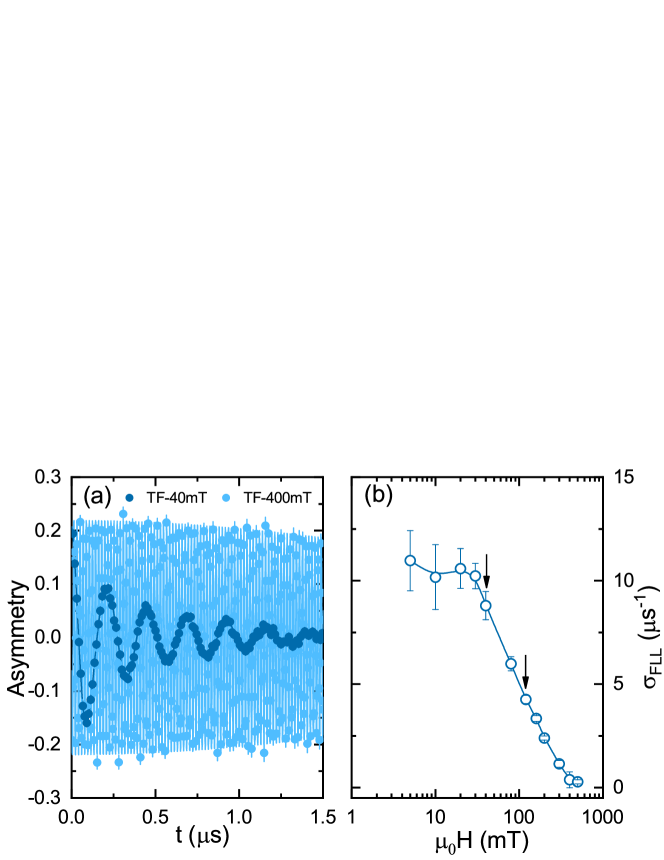
Figure 15(a) shows the time-domain TF-SR spectra of ReBe22, collected in two applied fields, 40 and 400 mT. The solid lines represent fits using the same model as that described in equation (8). The resulting superconducting Gaussian relaxation rate is summarized in figure 15(b). Above the lower critical field (28.1 mT), the Gaussian relaxation rate decreases continuously. By considering the decrease of the inter vortex distance with the field and the vortex-core effects, a field of 40 mT was chosen for the temperature-dependent TF-SR studies. For a comparison, the TF-SR relaxation was also measured in a field of 120 mT, here expected to suppress the small superconducting gap.
References
References
- [1] Falge Jr R L 1967 Phys. Lett. A 24 579
- [2] Duan D, Liu Y, Ma Y, Shao Z, Liu B and Cui T 2017 Natl. Sci. Rev. 4(1) 121–135
- [3] Semenok D V, Kvashnin A G, Kruglov I A and Oganov A R 2018 J. Phys. Chem. Lett. 9(8) 1920–1926
- [4] Slocombe D R, Kuznetsov V L, Grochala W, Williams R J P and Edwards P P 2015 Phil. Trans. Roy. Soc. A 373(2037) 20140476
- [5] Bucher E and Palmy C 1967 Phys. Lett. A 24 340
- [6] Wysokiński K I 2019 Time reversal symmetry breaking superconductors (Preprint 1903.06462)
- [7] Shang T, Pang G M, Baines C, Jiang W B, Xie W, Wang A, Medarde M, Pomjakushina E, Shi M, Mesot J, Yuan H Q and Shiroka T 2018 Phys. Rev. B 97 020502
- [8] Shang T, Smidman M, Ghosh S K, Baines C, Chang L J, Gawryluk D J, Barker J A T, Singh R P, Paul D M, Balakrishnan G, Pomjakushina E, Shi M, Medarde M, Hillier A D, Yuan H Q, Quintanilla J, Mesot J and Shiroka T 2018 Phys. Rev. Lett. 121 257002
- [9] Leithe-Jasper A, Borrmann H and Hönle W 2003 Scientific report Max Planck Institute for Chemical Physics of Solids Dresden 25
- [10] Amato A, Luetkens H, Sedlak K, Stoykov A, Scheuermann R, Elender M, Raselli A and Graf D 2017 Rev. Sci. Instrum. 88 093301
- [11] Suter A and Wojek B M 2012 Phys. Procedia 30 69
- [12] Koepernik K and Eschrig H 1999 Phys. Rev. B 59(3) 1743
- [13] Perdew J P and Wang Y 1992 Phys. Rev. B 45(23) 13244
- [14] Sands D E, Johnson Q C, Zalkin A, Krikorian O H and Kromholtz K L 1962 Acta Crystallogr. 15 832–834
- [15] Sands D E, Zalkin A and Krikorian O H 1959 Acta Cryst. 12 461
- [16] Schirber J E, Overmyer D L, Morosin B, Venturini E L, Baughman R, Emin D, Klesnar H and Aselage T 1992 Phys. Rev. B 45(18) 10787
- [17] Hidaka H, Shimizu Y, Yamazaki S, Miura N, Nagata R, Tabata C, S M, Yanagisawa T and Amitsuka H 2017 J. Phys. Soc. Jpn. 86 023704
- [18] Grin Y 2013 Crystal structure and bonding in intermetallic compounds Comprehensive Inorganic Chemistry II (Elsevier) p 359
- [19] Samsonov G V 1966 Usp. Khim. 35 339
- [20] Jacobson L A, Hanrahan R J and Smith J L 2002 Beryllides Intermetallic Compounds - Principles and Practice vol 3 ed Westbrook J H and Fleischer R L (Chichester: John Wiley & Sons) chap 3, pp 37–51
- [21] Pauling L 1960 The Nature of the Chemical Bond 3rd ed (Cornell University Press, Ithaca, NY)
- [22] Stein F, Palm M and Sauthoff G 2004 Intermetallics 12 713
- [23] Paine R M and Carrabine J A 1960 Acta Crystallogr. 13 680
- [24] Bloch F 1930 Z. Phys. 59 208
- [25] Blatt F J 1968 Physics of Electronic Conduction in Solids (New York: McGraw-Hill) p. 185–190
- [26] Chase M W, Curnutt J L, Hu A T, Prophet H, Syverud A N and Walker L C 1974 J. Phys. Chem. Ref. Data 3 311
- [27] Poole C, Farach H, Creswick R and Prozorov R 2014 Superconductivity 3rd ed (Amsterdam: Elsevier)
- [28] Brandt E H 2003 Phys. Rev. B 68 054506
- [29] Tari A 2003 The Specific Heat of Matter at Low Temperatures (London: Imperial College Press)
- [30] Kittel C 2005 Introduction to Solid State Physics 8th ed (Hoboken, NJ: John Wiley & Sons)
- [31] McMillan W L 1968 Phys. Rev. 167 331
- [32] Sklyadneva I Y, Chulkov E V, Schöne W D, Silkin V M, Keyling R and Echenique P M 2005 Phys. Rev. B 71(17) 174302
- [33] Tinkham M 1996 Introduction to Superconductivity 2nd ed (Mineola, NY: Dover Publications)
- [34] Chen J, Jiao L, Zhang J L, Chen Y, Yang L, Nicklas M, Steglich F and Yuan H Q 2013 New J. Phys. 15 053005
- [35] Chen J T, Sun Y, Yamada T, Pyon S and Tamegai T 2017 J. Phys. Conf. Ser. 871 012016
- [36] Bouquet F, Fisher R A, Phillips N E, Hinks D G and Jorgensen J D 2001 Phys. Rev. Lett. 87(4) 047001
- [37] Padamsee H, Neighbor J E and Shiffman C A 1973 J. Low Temp. Phys. 12 387
- [38] Carrington A and Manzano F 2003 Physica C 385 205
- [39] Bouquet F, Wang Y, Fisher R A, Hinks D G, Jorgensen J D, Junod A and Phillips N E 2001 Europhys. Lett. 56 856
- [40] Movshovich R, Jaime M, Thompson J D, Petrovic C, Fisk Z, Pagliuso P G and Sarrao J L 2001 Phys. Rev. Lett. 86(22) 5152
- [41] Mackenzie A P and Maeno Y 2003 Rev. Mod. Phys. 75(2) 657
- [42] Weng Z F, Zhang J L, Smidman M, Shang T, Quintanilla J, Annett J F, Nicklas M, Pang G M, Jiao L, Jiang W B, Chen Y, Steglich F and Yuan H Q 2016 Phys. Rev. Lett. 117(2) 027001
- [43] Caroli C, De Gennes P G and Matricon J 1964 Phys. Lett. 9 307
- [44] Volovik G E 1993 JETP Lett. 58(6) 469
- [45] Wen H H, Liu Z Y, Zhou F, Xiong J, Ti W, Xiang T, Komiya S, Sun X and Ando Y 2004 Phys. Rev. B 70(21) 214505
- [46] Zhu X, Yang H, Fang L, Mu G and Wen H H 2008 Supercond. Sci. Technol. 21 105001
- [47] Werthamer N R, Helfand E and Hohenberg P C 1966 Phys. Rev. 147 295
- [48] Gurevich A 2003 Phys. Rev. B 67(18) 184515
- [49] Müller K H, Fuchs G, Handstein A, Nenkov K, Narozhnyi V N and Eckert D 2001 J. Alloys Compd. 322 L10
- [50] Gurevich A, Patnaik S, Braccini V, Kim K H, Mielke C, Song X, Cooley L D, Bu S D, Kim D M, Choi J H, Belenky L J, Giencke J, Lee M K, Tian W, Pan X Q, Siri A, Hellstrom E E, Eom C B and Larbalestier D C 2004 Supercond. Sci. Technol. 17 278
- [51] Shang T, Wei W, Baines C, Zhang J L, Du H F, Medarde M, Shi M, Mesot J and Shiroka T 2018 Phys. Rev. B 98(18) 180504
- [52] Maisuradze A, Khasanov R, Shengelaya A and Keller H 2009 J. Phys.: Condens. Matter 21 075701 and references therein
- [53] Barford W and Gunn J M F 1988 Physica C 156 515
- [54] Niedermayer C, Bernhard C, Holden T, Kremer R K and Ahn K 2002 Phys. Rev. B 65(9) 094512
- [55] Kubo R and Toyabe T 1967 A stochastic model for low field resonance and relaxation Magnetic Resonance and Relaxation ed Blinc R (Amsterdam: North-Holland) p 810
- [56] Yaouanc A and de Réotier P D 2011 Muon Spin Rotation, Relaxation, and Resonance: Applications to Condensed Matter (Oxford: Oxford University Press)
- [57] Bakai A S, Timoshevkii A N, Kalkuta S A, Moeslang A and Vladimirov V P 2007 Low Temp. Phys. 33 889–891
- [58] Granqvist C G and Claeson T 1974 Phys. Lett. A 47 97–98
- [59] Pietronero L, Boeri L, Cappelluti E and Ortenzi L 2018 Quantum Stud.: Math. Found. 5 5
- [60] Adroja D, Bhattacharyya A, Biswas P K, Smidman M, Hillier A D, Mao H, Luo H, Cao G H, Wang Z and Wang C 2017 Phys. Rev. B 96(14) 144502
- [61] Shiroka T, Shang T, Wang C, Cao G H, Eremin I, Ott H R and Mesot J 2017 Nat. Commun. 8 156
- [62] Barker J A T, Breen B D, Hanson R, Hillier A D, Lees M R, Balakrishnan G, Paul D M and Singh R P 2018 Phys. Rev. B 98 104506 and references therein
- [63] Uemura Y J, Le L P, Luke G M, Sternlieb B J, Wu W D, Brewer J H, Riseman T M, Seaman C L, Maple M B, Ishikawa M, Hinks D G, Jorgensen J D, Saito G and Yamochi H 1991 Phys. Rev. Lett. 66(20) 2665